


Abstract
Right ventricular (RV) dysfunction is a strong predictor of outcome in heart failure and is a key determinant of exercise capacity. Despite these crucial findings, the RV remains understudied in the clinical, experimental, and computer modelling literature. This review outlines how recent advances in using computer modelling and cardiac imaging synergistically help to understand RV function in health and disease. We begin by highlighting the complexity of interactions that make modelling the RV both challenging and necessary, and then summarize the multiscale modelling approaches used to date to simulate RV pump function in the context of these interactions. We go on to demonstrate how these modelling approaches in combination with cardiac imaging have improved understanding of RV pump function in pulmonary arterial hypertension, arrhythmogenic right ventricular cardiomyopathy, dyssynchronous heart failure and cardiac resynchronization therapy, hypoplastic left heart syndrome, and repaired tetralogy of Fallot. We conclude with a perspective on key issues to be addressed by computational models of the RV in the near future.
1. Introduction
Whilst the overwhelming majority of clinical and experimental studies on heart failure focus on the left ventricle (LV), right ventricular (RV) failure has a particularly bleak prognosis.1 In recent years, interest in RV function in both patients and apparently healthy individuals with a wide range of conditions has increased. These conditions range from increased mortality in patients with RV infarction,2 to arrhythmogenic right ventricular cardiomyopathy (ARVC),3 to the RV’s crucial role in determining exercise capacity,4 and to maladaptive and arrhythmogenic RV remodelling in high performance athletes.5 The RV can also be the systemic ventricle in some individuals with congenital heart defects (CHDs), which is a subject of growing interest as the prognosis of CHD patients continues to improve.6
Why is RV function so challenging to study with imaging? The RV is a thin-walled, crescent shaped structure wrapped around the right side of the LV, and lies closely against the ribcage (Figure 1). The RV has a high degree of apical trabeculation, has the moderator band that crosses the RV cavity, and has three papillary muscles.7 These anatomical features and its intra-thoracic position make the RV hard to image satisfactorily, especially with echocardiography. Standard 2D imaging planes oversimplify RV contraction, which is a combination of longitudinal and circumferential shortening. Due to the limited echocardiographic views in which the RV wall is clearly visible, only longitudinal function parameters are commonly used (e.g. tricuspid annular plane systolic excursion—TAPSE, s′ of tissue Doppler of the tricuspid angle, longitudinal strain). Three-dimensional speckle tracking has shown that RV segments show a heterogeneous distribution of directions of contraction in normal hearts.8 RV function is therefore multi-dimensional, possibly explaining why changes measured by 3D RV ejection fraction are currently considered the most reliable global echocardiographic indicators of RV function.9 However, volumetric measurements can be distorted by the high degree of trabecularization in the RV.10 Some of these limitations can be overcome using cardiac magnetic resonance (CMR) imaging. However, because most clinical CMR protocols and imaging planes are designed to assess LV morphology, RV endocardial contour tracing is challenging, and specific axial RV slices are required for accurate RV volume measurements.11
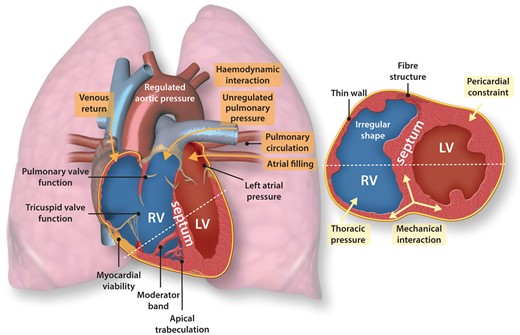
A conceptual summary of major challenges for imaging and modelling RV systolic function at rest. Two views of the heart are shown, loosely corresponding to an apical four-chamber long-axis view and a parasternal ventricular short-axis view. Haemodynamic interactions between the two ventricles are highlighted in red. Mechanical interactions between the two ventricles through their structural connections and the interventricular septum are highlighted in blue.
These limitations of RV imaging make computer modelling an appealing tool for studying RV function. Many cardiac models do now include the RV but, so far, few models have been used to study the RV pathophysiology. Moreover, most studies that investigate the RV, including our own, use a relatively simple representation of RV structure and function. This review aims to encourage computational modellers to increase their focus on RV function, and it aims to demonstrate the power of modelling for interpreting RV imaging in pathophysiological situations to physiologists and clinicians. We begin by summarizing approaches to modelling RV function considering the interactions in Figure 1. We then review how models have helped to understand clinical measurements of RV function in pulmonary arterial hypertension (PAH), ARVC, dyssynchronous heart failure, and CHD. We also address progress towards using models constructed from CMR to extract additional diagnostic information.
2. Modelling RV systolic function
All models of the RV are necessarily simplifications of reality. Both the question under investigation and the availability of imaging and haemodynamic data determine the level of detail used when modelling different aspects of the RV and its environment.
2.1 Right ventricular morphology
Three-dimensional biventricular models provide the opportunity to explore the effect of cardiac anatomy on pump function in detail.12 While generic models of the ventricles are still used to understand ventricular pump function, recent years have seen rapid developments in integrating computer models and in vivo cardiac imaging to produce personalized or ‘patient-specific’ biventricular models. Models can be created by either segmenting and fitting the endocardial and epicardial surfaces and then meshing the resultant geometry, or by morphing an existing generic model to fit the imaging data.13 The shape of the resulting models can be used in statistical analysis for phenotyping without the need to perform simulations, as demonstrated recently for the RV in repaired Tetralogy of Fallot patients.14 Alternatively, these models can be combined with descriptions of myocardial properties and used to simulate LV and RV pump function. The tissue model can then be personalized by adjusting model parameters to reproduce measured pressures and/or deformation with a certain error range.15 The irregularity of RV structure and its thin wall mean that tracking and constructing its geometry can be significantly more challenging than for the LV, which may limit the personalization approach when modelling the RV. RV function in most geometrically detailed models is used to provide appropriate mechanical and hemodynamic boundary conditions for studying LV function, but increasing clinical interest in the RV is now leading to studies that use patient-specific models to study the RV itself.16,17
2.2 Fibre architecture
Fibre structure determines the anisotropy incorporated within active and passive constitutive laws for RV myocardium. In humans, histology and dissection studies generally agree that RV epicardial myofibres are circumferentially oriented and are contiguous with the LV epicardial myofibres, whereas RV subendocardial myofibres are longitudinally oriented; that the endocardial myofibres of the RV are contiguous with those in the interventricular septum; and that the RV lacks the mid-myocardial layer of circumferentially oriented fibres found in the LV.7,18 Despite these differences from the LV, RV myocardial structure is frequently modelled using rule-based models derived from histological studies of LV fibre orientation with variation of the fibre angle within the RV.19,20 Diffusion tensor CMR has also been used to estimate personalized ventricular fibre orientation in vivo, although these measurements may be less reliable in the thin RV free wall.
2.3 Myocardial function
There is an accumulating body of evidence for functional differences between LV and RV myocardium, including electrophysiological and contractile function.21,22 These differences can be represented using biophysically detailed sarcomere contraction models coupled to electrophysiological models to realistically simulate myocardial function.16 Detailed modelling of RV myocardium may help to address unresolved issues in RV pathophysiology, such as why the sub-tricuspid region seems to be most vulnerable to functional changes in early-stage ARVC.23 Anisotropic passive constitutive laws for the RV myocardium have been developed based on biaxial testing using experimental animal studies,24,25 and some whole-heart electrophysiology simulation studies have included left-right differences in ion channel expression.26 However, most computer models use either generic or LV models to represent active and passive RV myocardial function.12 Hill-type phenomenological models have been used in both geometrically detailed and reduced-dimensional models to simulate contraction.27,28 Differences in wall thickness and pressure between the LV and RV can already generate substantial differences in wall mechanics without requiring specialized RV tissue models.29 When the mechanism of RV contraction is less critical, a time-varying elastance function that gives a pressure–volume relationship that varies throughout the cardiac cycle can be used.30
Regional variations in RV myocardial function can be simulated in a straightforward manner using geometrically detailed models by altering myocardial properties in, for example, a scarred region.31 Within cardiac models derived from imaging, regions of delayed gadolinium enhancement on CMR can be registered to the model geometry and used to define regions of fibrosis.32 However, delayed enhancement in the RV can be challenging to interpret in the RV because of the thin wall and fatty deposits on the epicardium.33
2.4 Simplified models of mechanical ventricular interaction
Ventricular mechanical interaction can occur through shared myofibres between the LV and the RV at the LV–RV attachment and through pressure differences across the interventricular septum. The main use of simplified models to study the RV has been the investigation of how mechanical interaction contributes to both LV and RV function and to the abnormal septal position observed in many cardiac pathologies.34 Early models allowed for a leftwards shift in the pressure–volume relationship of one ventricle with increases in pressure on the opposite ventricle, representing increases in diastolic pressure.35 This approach neglects how septal position affects ventricular pressure–volume dynamics, which can be addressed by assigning a volume of blood to the septum, giving a septal elastance dependent on the RV–LV pressure difference.36,37 Subsequently, Beyar et al. proposed a ‘force balance’ theory, which requires that tensile forces balance at the LV–RV attachment and adjusts septal position until this balance is achieved.38 The same study proposes a model incorporating bending moments of myocardial fibre layers, which reduced but did not abolish the leftwards shift of the septum with acute increases of RV pressure.
The static approaches above do not take into account the dynamic nature of ventricular pressure due to active tension generation by the myocardium. Sun et al. allowed for dynamic variation in septal position in response to cardiovascular system dynamics by using time-varying elastance models for LV and RV pressure together with an interventricular cross-talk determined by septal elastance.30,36 The CircAdapt model combines the ‘force balance’ theory in the simplified ‘TriSeg’ ventricular geometry with phenomenological models of active and passive myofibre stress generation and descriptions of atrial function and the systemic and pulmonary circulations.27,38 CircAdapt therefore allows a dynamic interaction between RV and LV myocardial contractile function, septal position, and ventricular pressures and volumes.
2.5 Pericardial constraint
Mechanical interaction also occurs through the pericardium, which surrounds both ventricles and most of the atria.39 With pericardial constraint, an increase in the volume of a chamber alters the pressure in the other chambers and, hence, diastolic filling and septal position. A common model for the pericardium is an elastic sac surrounding the four cardiac chambers, with a non-linear pressure–volume relationship determining the contribution to chamber pressures.30,35,40 Recently, Fritz et al. proposed a more anatomically realistic representation of the pericardium and surrounding tissue compatible with imaging-derived whole-heart models.41 Pericardial constraint had a much greater influence on atrial and RV function than on LV function. Incorporating pericardial interactions allows investigation of conditions that alter pericardial behaviour such as pericarditis and cardiac tamponade, which can exacerbate ventricular interaction and alter septal position.30,34
2.6 Thoracic pressures
Intrathoracic pressures are especially relevant for modelling the RV due to the pronounced effect of respiration on RV function.42 In multi-compartment models, the effects of variations in intrathoracic pressure that can influence both venous return and pulmonary vascular resistance can be included. Typically, this takes the form of an oscillating pressure applied equally to all compartments within the thorax (i.e. the vena cavae, heart, and pulmonary circulation).30
2.7 Valvular function and blood flow
Pulmonary and tricuspid valve function strongly influence RV systolic function by altering both preload (tricuspid regurgitation/stenosis, pulmonary regurgitation) and afterload (pulmonary stenosis, tricuspid regurgitation). The tricuspid and pulmonary valves have been modelled in much less detail than the mitral and aortic valves to date. Simple valve models open in the presence of a pressure gradient with a given resistance, which allows simulation of filling and ejection and, to an extent, stenosis.43 More advanced formulations include inertial effects of flow and incorporate Bernoulli energy losses across the valve. Incorporating valvular flow within 3D models of the RV allows the study of intraventricular systolic and diastolic flow patterns as measured in vivo using flow reconstruction from 3D ultrasound or phase contrast CMR.44,45 The role of fluid–structure interactions and kinetic effects in RV myocardial mechanics may be more pronounced than in the LV given the RV’s thinner walls, but applications of intraventricular computational fluid dynamics modelling to the RV remain scarce.31,46
2.8 Hemodynamic interactions
The RV lies between the low-pressure systemic venous system and the pulmonary circulation, whose arterial pressure is not controlled through any known homeostatic mechanism.47 There is a high degree of hemodynamic interaction between the LV and RV, both ‘forwards’ through venous return determining RV preload and left atrial filling determining LV preload, and ‘backwards’ through left atrial pressure and pulmonary pressures that determine RV afterload.48 These interactions can be incorporated either as boundary conditions to the RV or by using a closed-loop model of the circulation. An extensive review of reduced-dimensional computational models of the circulatory system has been provided by Shi et al.43 These models directly couple LV output and RV filling and vice versa, and contain simple models of ventricular and sometimes atrial function. They can also provide hemodynamic boundary conditions for more detailed models of the RV and LV.40,49,50
The pulmonary circulation normally operates with an inlet pressure (mean pulmonary artery pressure, around 14 mmHg) far below the inlet pressure for the systemic circulation (mean aortic pressure, around 92 mmHg), although this difference decreases during exercise.51 The most straightforward method for modelling RV afterload is a Windkessel model, which has the advantage of having a low number of parameters that are physiologically meaningful and consequently are parameterizable from clinical measurements.52,53 Models with non-linear pressure–flow relations based on experimental measurements or incorporating vascular distensibility and constriction have also been proposed.54–56 Branching tree formulations model both large arteries and veins, where inertial effects dominate, and smaller arterioles and capillaries where viscous effects dominate. These models therefore allow simulation of dynamic differences in RV afterload due to different aetiologies of pulmonary hypertension.57
Computational fluid dynamics simulations of blood flow in the pulmonary arteries can also be used for pulmonary arterial hemodynamics.58 Most computational fluid dynamics studies use a simple time varying elastance model for the RV as a boundary condition for the pulmonary artery model. It has been used for simulating pulmonary arterial haemodynamics in complex anatomies in CHD and in PAH.59,60 These models can also provide information on the consequences of pulmonary artery morphology for the RV as discussed later.
3. Understanding RV imaging using cardiac modelling
In this section, we review insights obtained from computer models into clinical measurements of RV function in a range of pathologies. Furthermore, we highlight progress towards using models constructed from RV imaging to derive additional diagnostic information from CMR.
3.1 Pulmonary arterial hypertension
PAH is one of the best-known examples for RV functional changes with increased afterload and the RV’s capacity for dramatic structural remodelling, and is probably the most deeply studied RV pathology using computer models. PAH is defined as a group of diseases in which pathological vascular remodelling raises the resistance of the pulmonary vascular bed progressively leading to chronic elevation of pulmonary arterial pressure.61 Although PAH can be considered a disease of the peripheral pulmonary vessels, hemodynamic and functional measurements related to RV performance have consistently shown to be most predictive for mortality of PAH patients.62
Patients with PAH undergo progressive RV structural remodelling including hypertrophy, dilation, and a leftwards shift in septal position (Figure 2). As the disease worsens, patients often develop profound abnormalities in RV systolic function, including reduced ejection fraction, pronounced late-systolic motion of the septum, and flow abnormalities including pulmonary flow acceleration, increased RV isovolumic contraction and relaxation times, and decreased tricuspid E/A ratio.63–65 Both RV and LV deformation can be profoundly abnormal in patients with PAH, with delays in RV onset and peak shortening, and rapid early diastolic stretching of the septum and LV free wall.66
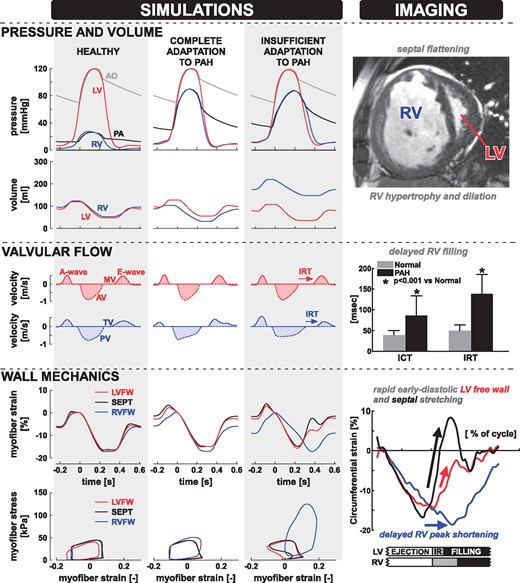
Insufficient adaptation to severe PAH causes RV functional abnormalities. Simulations from left to right: healthy heart simulation, full adaptation to PAH, partial adaptation to PAH. Both PAH simulations have the same mean pulmonary artery pressure (55 mmHg). Corresponding imaging findings from patients with severe PAH are shown on the right-hand side. A ventricular short-axis CMR view shows marked dilation and hypertrophy of the RV, wall thickening and convexity of the interventricular septum towards the LV. Prolongation of RV ICT and IRT were observed using echocardiography. Tagged MRI-derived myocardial strain from the LV free wall, RV free wall and septum shows prolonged RV contraction and abnormal LV stretch in early diastole. Abbreviations: aorta (AO), pulmonary artery (PA), aortic valve (AV), mitral valve (MV), pulmonary valve (PV), tricuspid valve (TV), LV free wall (LVFW), septum (SEPT), RV free wall (RVFW), isovolumetric relaxation time (IRT), isovolumetric contraction time (ICT), pulmonary arterial hypertension (PAH). The simulation data in the left panel are obtained with the CircAdapt model and are modified from Lumens et al.73 Top-right and bottom-right panels are modified from Marcus et al.66 with permission. The middle-right panel is modified from Tei et al.64 with permission.
3.1.1 PAH-induced interventricular imbalance of tissue load and adaptive remodelling
Modelling studies showed that simulating PAH by increasing pulmonary vascular resistance caused an inhomogeneous distribution of myofibre load throughout the ventricular walls,27,29 with a considerable increase of myofibre work in the RV free wall and a slight decrease in the LV free wall and septum (Figure 2). When allowing the myocardial tissue to compensate for increased load by structural adaptation based on mechano-sensing,67 RV free wall mass increased, whereas LV free wall and septal mass decreased.27 These modelling data are in line with clinical and animal experimental findings showing that PAH is associated with hypertrophic remodelling of the RV free wall,68,69 despite no remodelling or atrophy of the LV free wall and septum.70 Together these experimental and modelling data strongly suggest that the ability of the RV free wall tissue to compensate for increased load by structural remodelling determines overall cardiac pump function in severe PAH. Furthermore, this imbalance of ventricular load distribution may explain why exercise capacity is severely reduced in PAH patients,71 the more so because RV afterload increases with cardiac output during exercise.51 PAH therefore differs fundamentally from systemic hypertension, where increased ventricular tissue load and hypertrophic remodelling caused by LV pressure overload is distributed over the entire LV wall.72
Furthermore, RV afterload as measured by the mean pulmonary artery pressure is a surprisingly poor predictor of outcome in PAH. To understand this finding, computer simulations were used to simulate varying degrees of RV adaptation to PAH.73 With mean pulmonary artery pressure held constant at 55 mmHg, structural adaptation was used to produce a compensated PAH simulation, together with two decompensated simulations, one with partial adaptation and one with no adaptation (Figure 2).73 The fully compensated PAH simulation produced signals similar to the healthy simulation. In both the partially compensated and the decompensated PAH simulations, the RV end-diastolic volume as well as systolic and diastolic RV pressures increased, which lead to decreases in RV ejection fraction. These simulations suggest that the extent of RV structural adaptation to increased afterload, rather than the afterload itself, determines the interventricular imbalance of tissue load and hence cardiac pump function. Furthermore, it was observed that incomplete adaptation caused marked strain abnormalities similar to those reported by Marcus et al.,66 suggesting that early diastolic stretching of the septum and LV free wall myocardium is a marker for RV decompensation.73
3.1.2 Septal geometry and motion in PAH
Early experimental and modelling studies demonstrated that septal geometry depends on the transseptal pressure difference,38,74,75 with a characteristic ‘D-shaped’ LV cavity indicating an increased RV pressure relative to LV pressure (Figure 2, top right). Modelling studies have shown that septal dynamics also contain diagnostic information about the health of RV myocardial tissue. Septal motion changed drastically in the decompensated PAH simulations (Figure 3).56,73 All ventricular walls contract and relax uniformly in the healthy and compensated PAH simulations. In the decompensated PAH simulations, however, uniformity of ventricular deformation is lost, the septum is almost flat during diastole and a rapid leftward septal motion occurs during the RV isovolumic relaxation phase.
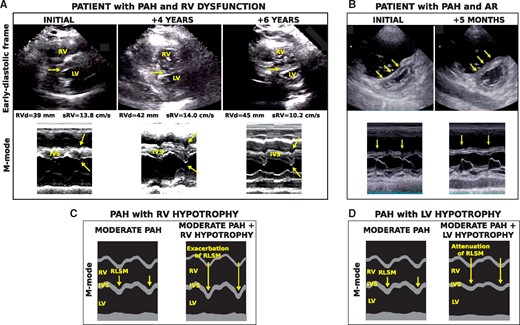
Exacerbation and attenuation of septal motion. An echocardiographic parasternal long-axis view and M-mode are displayed for (A) a patient with PAH (mPAP 59 mmHg) and diagnosis of gradual RV dysfunction at initial hospitalization, 4 years later, and 6 years later, and (B) a patient with PAH (mPAP 38 mmHg), at initial hospitalization and following development of AR 5 months later.77 Simulated M-modes with (C) moderate PAH with RV hypotrophy and (D) moderate PAH with LV hypotrophy are also shown. Increased interventricular relaxation dyssynchrony induced by RV hypotrophy (C) exacerbated septal motion, as observed in (A) following progressive RV dysfunction. In (D), reduced interventricular relaxation dyssynchrony induced by LV hypotrophy attenuated septal motion, as observed in (B) after onset of AR. Abbreviations: Aortic regurgitation (AR), interventricular septum (IVS), mean pulmonary arterial pressure (mPAP), RV basal diameter (RVd), RV pulsed Doppler S wave (sRV). Figure is reproduced from Palau-Caballero et al.56
Modelling has shown that this motion is caused by asynchronous ventricular relaxation.56,66 RV tissue overload caused by decompensated PAH prolongs RV contraction,76 which stretches both the septum and the LV free wall where the myocardium has already begun to relax.27,38 As a result, the RV pulls the septum transiently into the LV, raising LV diastolic pressure and delaying mitral valve opening (Figure 2, middle). This motion can be abolished through either reduced RV tissue load due to afterload reduction or hypertrophic remodelling, or an increase in LV myocardial load causing prolonged LV contraction (Figure 3).56,77 Therefore, the myocardial loading imbalance between the LV and the RV, rather than RV tissue load alone, determines the presence of early-diastolic leftward septal motion in PAH patients. This can have two clinical consequences: (i) septal motion is a marker for RV decompensation in PAH that does not require strain measurements and (ii) reduction of septal motion could imply either improvement in RV condition or deterioration of LV condition and should be interpreted cautiously.
Model simulations have shown that pre-excitation of the RV free wall to resynchronize relaxation relieves the RV of extremely high myofibre work while increasing LV free wall and septal myofibre work.29 RV free wall pre-excitation synchronized the RV and LV pressure curves, and gave a moderate improvement in RV pump function. Studies in isolated hearts of experimental animals with PAH78 and in patients with severe CTEPH79 have demonstrated similar beneficial effects.
3.1.3 Personalized cardiac models for PAH
Whilst the CircAdapt model used in the studies above allows qualitative assessment of the causes of abnormal findings of imaging in PAH, its simplified structure and highly phenomenological contraction model make quantitative comparisons to patient data challenging. A recent study has proposed that imaging-derived anatomical computer models can be used to extract functional parameters representing myocardial condition in PAH patients (Figure 4).16 Biventricular models of a normal subject and a PAH patient were constructed by manually segmenting and fitting endocardial and epicardial contours from long and short axis cine 3T CMR images to produce smooth 3D surfaces and then meshing to provide tetrahedral finite element geometries. Invasive catheter measurements of LV and RV pressures were registered with CMR images to construct pressure–volume loops. The myocardium was modelled using a transversely isotropic and hyperelastic model of passive behaviour and biophysically detailed representations of electrophysiology and sarcomere contraction. A rule-based fibre orientation was used for tissue anisotropy.20 Both models were parameterized by fitting contractility, stiffness, fibre helix angle, and the resistance of the Windkessel element used for ventricular afterload to the measured RV and LV pressure volume loops.
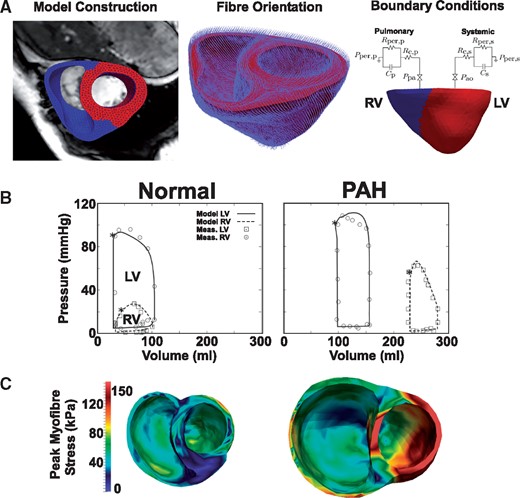
Personalized finite element modelling of pulmonary arterial hypertension. (A) Segmentation and meshing of a biventricular model from CMR. Fibre orientation was assigned using a rule-based method. Windkessel models were used as boundary conditions for the LV and RV. (B) The normal and PAH models reproduced clinically measured LV and RV pressure–volume loops. Note the RV dilation and increased systolic pressure in PAH. (C) Simulated regional distribution of peak myofibre stress within the ventricles. Figure is modified from Xi et al.,16 with permission from the American Society of Mechanical Engineers.
The models reproduced reduced RV strain, septal flattening, and increased Windkessel resistance in PAH. Furthermore, simulations with increased RV preload or afterload exhibited a flattening of the septum in line with earlier imaging studies. Strain patterns in the model showed qualitative differences with clinical recordings, with a greater strain amplitude in the RV and a much more rapid LV contraction in the model as compared with the subjects. Both the RV and LV in the PAH model were considerably stiffer and more contractile than that in the normal subject, suggesting that tissue properties can be extracted from imaging with the use of a computer model and that LV tissue has also remodelled in the PAH heart. However, it is unclear whether the fitted changes in LV stiffness are due to changes in LV tissue properties or due to mechanical interactions with the late-contracting RV as described in the previous section.
3.2 Arrhythmogenic right ventricular cardiomyopathy
ARVC is characterized by progressive fibro-fatty replacement of the RV myocardium and gradual RV dilation, although the LV is often also involved.3 Diagnosis of ARVC is extremely challenging due to reduced genetic penetrance and because individuals with ARVC are typically asymptomatic until they present with ventricular tachycardia or sudden cardiac death. Mutation carriers are normally detected through genetic analysis of family members of individuals expressing ARVC, many of whom never develop ARVC.80 There is great clinical interest in detecting individuals at the earliest stages of ARVC expression.
Electrophysiological abnormalities are believed to precede structural alterations, leading to three clinical ARVC stages: subclinical, electrical, and structural. Recent imaging studies have shown that individuals with ARVC-causing mutations frequently exhibit abnormal RV deformation whose severity is associated with arrhythmic events.81 A combined clinical and computer simulation study related abnormal RV deformation to the clinical stage of ARVC. Mast et al. studied 84 carriers of known ARVC-causing mutations and defined three distinct patterns of abnormal RV deformation in the basal region (Figure 5, top row).23 Almost half of the subclinically staged subjects exhibited an abnormal Type II deformation pattern. Type II was most prevalent in the electrical staged subjects, and the severely abnormal Type III was most prevalent in the structurally staged subjects.
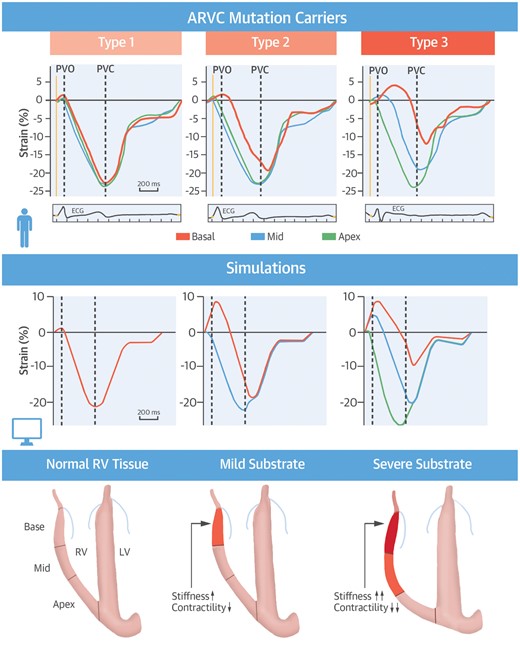
Imaging and modelling to explain mechanical abnormalities in ARVC clinical stages. Three distinct RV longitudinal deformation patterns were identified in ARVC mutation carriers. (Left) Type I, normal deformation as seen in healthy controls and approximately half of the subclinical mutation carriers. (Middle) Mildly abnormal Type II basal deformation patterns exhibited early-systolic stretching after pulmonary valve opening, post-systolic shortening after pulmonary valve closure, and mildly reduced systolic strain (<20%). Type III basal deformation patterns exhibited a more severe version of the Type II phenotype with severely reduced systolic strain (<10%). Simulations reproduced Types II and III through increased stiffness and reduced contractility. Figure is reproduced from Mast et al.,23 with permission.
Computer simulations of RV deformation were used to determine the substrates underlying these abnormal deformation patterns. Reduced regional contractility and mildly increased stiffness sufficed to reproduce a Type II pattern, and the Type III pattern arose through further increases in regional passive stiffness of the tissue, although systolic stretch in the simulations was considerably higher than that seen in the patient data (Figure 5). Electrical delay alone could not reproduce either the Type II or the Type III pattern, suggesting that delayed onset of shortening does not necessarily represent delayed activation, as originally proposed.82 The simulations demonstrated that the observed deformation patterns reflect pathological changes consistent with ARVC. Consequently, abnormal deformation reflects the severity of ARVC and can appear before overt structural abnormalities such as RV dilation, or electrophysiological diagnosis criteria on the ECG. Subclinically staged individuals with a Type II pattern are therefore likely to be showing the earliest signs of ARVC, which could help to improve sensitivity of ARVC diagnosis, and the appearance of mechanical abnormalities prior to detectable electrophysiological abnormalities challenges current thinking on ARVC progression.
3.3 Dyssynchronous heart failure and cardiac resynchronization therapy
3.3.1 The RV in the dyssynchronous heart
The interaction between dyssynchronous contraction, RV function, and CRT response has received relatively little attention in the literature, and the relation between RV function and CRT response is controversial.83,84 Personalized models derived from imaging that include the RV have been extensively used to study dyssynchronous heart failure and CRT, but have primarily focused on LV function to date.28,85,86
Previous experimental work has shown that dyssynchronous electrical activation redistributes the myofibre work performed within the LV, with earlier activated regions performing relatively less external work, and late-activated regions performing relatively more external work.87 Computer simulations of left bundle-branch block (LBBB) showed that this principle applies across both ventricles and so alterations in electrical activation sequence can expose ventricular mechanical interaction.88 Simulation of an LBBB activation pattern reduced the external myofibre work performed by the RV free wall as well as the septum. Pre-stretch of the LV free wall by the early-activated septum and RV free wall increased LV free wall work through the Frank–Starling mechanism (Figure 6). The LV myocardium then contracts against the early-activated and weak RV, forcing the LV free wall to increase its contribution to RV pump work while also stretching the early-activated septum.
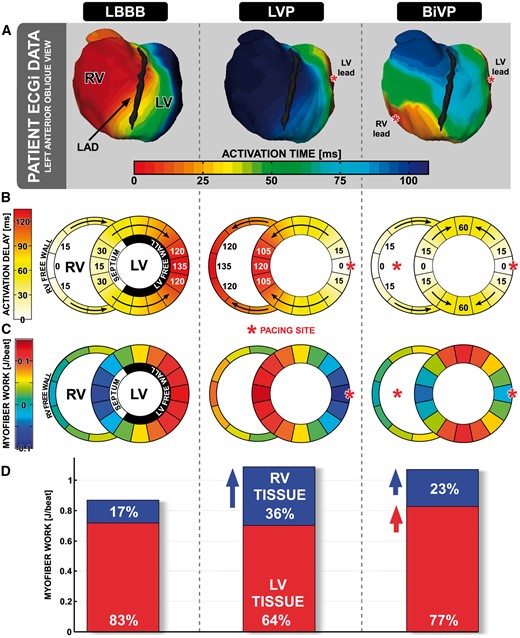
Pacing redistributes work from the LV lateral wall to the RV and septum. (A) ECGi imaging in a patient with left bundle branch block (LBBB) at baseline, during LV pacing (LVP), and during biventricular pacing (BiVP). Note the late RV activation during LVP. (B) Simulated activation sequences corresponding to LBBB, LVP, and BiVP. Red asterisks indicate pacing sites. (C) Colour maps indicate myofibre work per ventricular wall segment. (D) Bar charts indicate the proportion of ventricular pump work that is performed by the LV (red) and RV (blue) myocardium. Both LVP and BiVP increase ventricular pump work, but in LVP this effect arises through increased myofibre work in the RV myocardium (blue arrow), whereas in BiVP this effect occurs through increases in LV and RV myofibre work (red arrow). Figure is modified from Lumens et al.,88 with permission.
Patients with broad QRS complexes frequently show an early-systolic leftwards septal motion known as ‘septal beaking’ or ‘septal flash’ that is associated with favourable response to CRT.89 Multiple explanations for this phenomenon exist in the literature. Experimental studies in paced canine hearts suggested that this motion arose from a transient increase in RV pressure over LV pressure consistent with passive models of septal position.74,75 Later, experiments in a canine model with LBBB revealed that the pressure difference between LV and RV could decline during leftwards septal motion, and that the septum itself was shortening during this motion suggesting that active contraction of the septum caused septal beaking.90 A simulation study varied LV free wall, RV free wall, and septal timing of activation independently of one another and confirmed that septal motion could occur against a falling transseptal pressure gradient.91 However, the major driver of septal motion was the activation time of the RV free wall relative to the LV free wall because early contraction of the septum did not lead to septal motion when RV free wall activation time was also delayed. Consequently, lack of septal beaking may imply RV dysfunction or presence of RV activation delays coexisting with LV activation delays.
3.3.2 The RV in LV-only and biventricular pacing
One of the major effects of successfully applied CRT is electrical resynchronization of the LV. Consequently, CRT redistributes work away from the LV free wall and towards both the septum and the RV free wall, as demonstrated by computer modelling.88 Paradoxically, LV only pacing has been shown to provide similar benefit to biventricular pacing in many patients.92 Fusion of natural activation from the right bundle branch with the LV lead wavefront was originally proposed as the mechanism underlying this benefit. However, patient measurements and canine experiments demonstrated that LV free wall pacing could produce similar acute benefit to biventricular pacing, despite a lack of fusion that was confirmed by electrocardiographic imaging (Figure 6A).88 In the same study, computer modelling revealed that the mechanism was again work redistribution, this time from the early-activated LV lateral wall to the RV (Figure 6C). Through direct mechanical interaction, the RV could compensate for lost external work within the LV, boosting overall cardiac pump function. These computer modelling results suggest that LV-only pacing should be avoided in patients with RV dysfunction, which merits experimental and clinical investigation. How LV only pacing interacts with RV dysfunction remains unclear, and is of clinical interest as device manufacturers start to implement fusion pacing.
3.4 Congenital heart defects
Recent advances in cardiac imaging have led to the first applications of personalized computer models of CHD in the clinic.93 Interest is now growing in modelling the stresses that CHDs and palliative surgery place on the heart itself because increasing numbers of CHD patients are surviving into adulthood and exhibiting a tendency for RV dysfunction later in life.6
3.4.1 Hypoplastic left heart syndrome
Computer simulations have demonstrated that the choice of palliation for hypoplastic left heart syndrome (HLHS) can have significant effects on ventricular load. These simulations were performed by coupling a 3D finite volume computational fluid dynamics model of the modified Blalock–Taussig shunt, RV–pulmonary artery shunt, and the hybrid procedure used for the first stage of palliation in HLHS with a network model of the heart and circulation.59,94 In the simulations, the hybrid configuration gave the highest ventricular afterload and end diastolic volumes due to pulmonary banding, suggesting increased wall stress in this configuration. The RV–pulmonary artery shunt configuration resulted in the lowest ventricular load. Despite using a simple time-varying elastance model to represent ventricular function, this work demonstrates the potential of modelling for exploring how changes to the pulmonary circulation affect RV function. Given the considerable variability in HLHS patients’ anatomies, combining this approach with personalized imaging-derived models of the pulmonary circulation has potential for pre-procedural testing of these complex multi-stage surgical interventions.95
Recent work has also used computational fluid dynamics in personalized models to study the effect of ventricular morphology on filling patterns in HLHS patients.46 Myocardial boundaries were manually segmented from CMR imaging data from four HLHS patients undergoing the Norwood procedure and used to construct patient-specific finite element models. Tricuspid velocity profiles from Doppler were prescribed as boundary conditions at the basal plane to allow simulation of ventricular filling.
The patient-specific models could mechanistically link ventricular sphericity and E/A wave typology observed in the imaging study to vortex formation, intraventricular pressure gradients, and intraventricular flows during diastole. In the simulations from one patient with a fused inflow and highly spherical ventricle, only one vortex ring was formed and its propagation towards the apex was slow due to circumferential propagation, which caused lower filling velocities and dissipated kinetic energy. In another patient, the A wave was too weak to induce a second vortex, reducing the efficiency of filling. More elliptical ventricular morphologies exhibited more uniform peak intraventricular filling velocities and less dissipation of kinetic energy, resulting in a more efficient filling phase. Based on their findings, the authors proposed that kinetic energy derived from blood velocity measurements is a non-invasive alternative to pressure measurements for assessing diastolic function, although they acknowledge that further testing on more patients is required.
3.4.2 Repaired tetralogy of Fallot
Patients with repaired Tetralogy of Fallot frequently develop pulmonary valve dysfunction and scarring around the RV outflow tract patch leading to RV dilation and dysfunction. Determining when and how to intervene surgically in these patients has been investigated using biventricular modelling.96 Tang et al. constructed patient-specific RV models using planar slices from CMR throughout the cardiac cycle. As no active contraction model was used, parameters of a passive anisotropic myocardial model were fitted at 30 time points to match model geometry with CMR volumetric measurements.97 Fluid–structure interactions were also included in the model.31 In the simulations, smaller scar and patch sizes led to improved RV function, providing theoretical support for scar reduction surgery.96 In a subsequent study, a combination of morphological (wall curvature, RV volume) and mechanical properties (difference between begin and end ejection maximum principal stress) was found to best differentiate between patients with good and poor outcomes following pulmonary valve replacement.17
4. Assessment of modelling results
When evaluating model results, it is critical to consider the assumptions made when constructing the model. Inaccuracies can arise from an insufficient representation of physiology, or simply the choice of model parameters. For example, Figure 2 shows that the ‘normal’ CircAdapt simulation has a depressed E/A ratio and prolonged isovolumetric contraction times when compared with a healthy individual. This phenomenon may be due to the behaviour of CircAdapt’s highly phenomenological contraction model during early diastolic relaxation. This effect is likely to influence our results on prolonged RV contraction in PAH. Furthermore, CircAdapt cannot differentiate between longitudinal and circumferential strains due to its geometric simplicity. Bending stiffness of the septum is not included, which has been shown to influence the amplitude of changes in septal position.38 We also note a consistent over-estimation of systolic stretch in the ARVC simulations (Figure 5), which indicates that the passive behaviour of RV myocardium is not modelled accurately.
Many of the inherent limitations of simplified models can be addressed in the future by using more anatomically detailed models, such as those included in this review. Their advantages should be balanced against more parameters, the need for fitting processes, and increased computational costs. Imaging-based models can also neglect features of the RV whose mechanistic function is therefore difficult to assess. Many studies only include segmentations up to the tricuspid annulus in CMR data, neglecting the RV outflow tract. Outside of high-resolution electrophysiology meshes derived from histology,98 apical trabeculation, the moderator band, and papillary muscles are rarely included due to difficulties resolving these structures on imaging. Furthermore, many model outputs cannot be compared with any imaging modality to determine whether model outputs represent true physiological phenomena. An example is the highly heterogeneous distribution of peak myofibre stress in the simulations in Figure 4C.
The incorporation of temporal variations in RV function due to, for example, breathing and/or changes in exercise level,42 remains challenging for both imaging and modelling modalities at present although these phenomena have been included in lumped-parameter cardiovascular system models.99 Whilst several models incorporate structural remodelling,67,100 the transition to decompensation and failure remains challenging to simulate.
5. Conclusion
Computer modelling is a powerful tool for understanding cardiovascular function that has been under-utilized for studying the RV. We have demonstrated that computer modelling of the RV and cardiac imaging can work synergistically to uncover important mechanisms in a range of RV pathophysiologies and their treatment. We hope that this review will stimulate computer modellers, physiologists, and clinicians to increase their collaborative efforts to understand the ‘forgotten ventricle’.
Conflict of interest: none declared.
Funding
This work was supported by the Dutch Heart Foundation [NHS-2015T082 to J.L.].
