


Abstract
Q fever is a worldwide zoonosis caused by Coxiella burnetii. In some persons, particularly those with cardiac valve disease, infection with C. burnetii can cause a life-threatening infective endocarditis. There are few descriptive analyses of Q fever endocarditis in the United States.
Q fever case report forms submitted during 1999–2015 were reviewed to identify reports describing endocarditis. Cases were categorized as confirmed or probable using criteria defined by the Council for State and Territorial Epidemiologists (CSTE). Demographic, laboratory, and clinical data were analyzed.
Of 140 case report forms reporting endocarditis, 49 met the confirmed definition and 36 met the probable definition. Eighty-two percent were male and the median age was 57 years (range, 16–87 years). Sixty-seven patients (78.8%) were hospitalized, and 5 deaths (5.9%) were reported. Forty-five patients (52.9%) had a preexisting valvulopathy. Eight patients with endocarditis had phase I immunoglobulin G antibody titers >800 but did not meet the CSTE case definition for Q fever endocarditis.
These data summarize a limited set of clinical and epidemiological features of Q fever endocarditis collected through passive surveillance in the United States. Some cases of apparent Q fever endocarditis could not be classified by CSTE laboratory criteria, suggesting that comparison of phase I and phase II titers could be reexamined as a surveillance criterion. Prospective analyses of culture-negative endocarditis are needed to better assess the clinical spectrum and magnitude of Q fever endocarditis in the United States.
Q fever is a worldwide zoonotic disease caused by Coxiella burnetii. C. burnetii is widely distributed in the environment [1], particularly in agrarian settings [2]. Most human infections result from inhalation of aerosolized bacteria from soils and dusts contaminated by excreta and birth products of infected animals, particularly cattle, sheep, and goats, which serve as primary reservoirs for C. burnetii. Acute disease caused by C. burnetii presents most often as a nonspecific febrile illness that can occur in conjunction with hepatitis or pneumonia, but as many as 60% of acute Q fever infections are asymptomatic [3]. Infection with C. burnetii can manifest months to years after an acute infection as Q fever endocarditis, particularly in persons with preexisting damage to or abnormalities of a native cardiac valve and in those with a prosthetic valve.
The first documented case of Q fever endocarditis was reported in 1959 [4], and during the last 50 years the clinical features and demographic characteristics of this life-threatening condition have been described in several large patient series from various countries around the world, including France [5, 6], Great Britain [7, 8], Ireland [9], Switzerland [10], the Netherlands [11], Spain [12], Israel [13], and Australia [14]. However, the largest series previously reported from the United States described only 7 patients [15, 16]. Here, we summarize a limited set of clinical and demographic characteristics of patients with Q fever endocarditis in the United States collected passively through national surveillance during a 17-year period.
METHODS
Q fever has been a nationally notifiable disease in the United States since 1999 [17]. State and local health departments report case data to the Centers for Disease Control and Prevention (CDC) using standardized case report forms (CRFs). Data collected on the CRF include a limited set of demographical, clinical, and outcome data, as well as occupational and epidemiological risk factors associated with the disease.
All Q fever CRFs submitted to CDC during 1999–2015 that reported endocarditis among the clinical characteristics were considered for further analysis and were classified as confirmed or probable according to laboratory criteria defined by the Council for State and Territorial Epidemiologists (CSTE) [18]. Laboratory criteria for a confirmed case are (1) an immunoglobulin G (IgG) antibody titer to C. burnetii phase I antigen of ≥800 by indirect immunofluorescence antibody (IFA) assay, which must also equal or exceed the IgG antibody titer to C. burnetii phase II antigen if reported; (2) a positive result by polymerase chain reaction (PCR) assay or immunohistochemical (IHC) staining for C. burnetii; or (3) isolation in cell culture [18]. The laboratory criterion for a probable case was an IgG antibody titer to C. burnetii phase I antigen ≥128 and <800 [18]. Reported cases of endocarditis with IgG antibody titers to phase I antigen ≥800 that did not meet the criteria for a laboratory-confirmed case were denoted as nonclassified endocarditis (NCE). Demographic, laboratory, clinical characteristics, animal exposure history, and occupational risk factors were analyzed using SAS version 9.3 statistical software (SAS Institute, Cary, North Carolina). Preexisting valvular disease was defined as either recorded valvular disease on the CRF or any reported history of heart valve replacement, stenosis, regurgitation, or another inherited or acquired condition affecting one or more heart valves. Patients were considered to have a preexisting immunocompromising condition when recorded on the CRF or when another condition known to compromise the immune system was reported. Fisher exact test was used to test equality of proportions; P values <.05 were considered significant.
RESULTS
Case Classification
During 1999–2015, a total of 991 Q fever CRFs were submitted to CDC and 140 of these were unique cases that described endocarditis as a clinical manifestation. Forty-nine (35%) cases met the CSTE definition of confirmed Q fever endocarditis, with IgG titers against phase I antigen ≥800 that were greater than or equal to IgG titers against phase II antigen (40 [81.6%]), or by a positive PCR assay (3 [6.1%]), or both (6 [12.2%]). No confirmed cases were identified solely by IHC stain or by cell culture isolation. Thirty-six patients (25.7%) met the laboratory criterion for a probable case. Eight cases (5.7%) had an IgG antibody titer to phase I antigen ≥800 (range, 1024–131072) but with an IgG antibody titer to phase II antigen that exceeded the titer to phase I antigen; these were denoted as NCE. None of these patients had additional laboratory testing by PCR or IHC assays. The remaining endocarditis cases (n = 47) did not meet criteria for any classification and were excluded from further analysis.
Confirmed Cases
The majority of confirmed cases (n = 49) were male (39 [79.6%]), white (34 [69.4%]), non-Hispanic (34 [69.4%]), and ≥50 years of age (28 [57.1%]) (Table 1). The median age was 57 years (range, 23–85 years) (Figure 1). Confirmed cases originated from all regions of the United States; the Northeast region contributed the fewest cases (7 [14.3%]), half as many as the Midwestern states (16 [32.7%]), which had the highest burden (Table 1). Thirty-eight confirmed cases (77.6%) were hospitalized for their illness (Table 1).
Demographic Characteristics and Outcomes of Confirmed, Probable, and Nonclassified Cases of Q Fever Endocarditis Reported to the Centers for Disease Control and Prevention During 1999–2015
| Characteristic | Confirmed (n = 49) | Nonclassifieda (n = 8) | Probable (n = 36) | Total (N = 93) |
|---|---|---|---|---|
| Sex | ||||
| Male | 39 (79.6) | 7 (87.5) | 31 (86.1) | 77 (82.8) |
| Female | 10 (20.4) | 1 (12.5) | 5 (13.9) | 16 (17.2) |
| Race | b | |||
| White | 34 (69.4) | 5 (62.5) | 22 (61.1) | 61 (65.6) |
| Black | 3 (6.1) | 0 (0) | 2 (5.6) | 5 (5.4) |
| Asian | 2 (4.1) | 1 (12.5) | 1 (2.8) | 4 (4.3) |
| Native American | 0 (0) | 0 (0) | 1 (2.8) | 1 (1.1) |
| Unspecified | 10 (20.4) | 2 (25) | 10 (27.8) | 22 (23.7) |
| Ethnicity | b | |||
| Hispanic | 5 (10.2) | 0 (0) | 7 (19.4) | 12 (12.9) |
| Non-Hispanic | 34 (69.4) | 6 (75) | 20 (55.6) | 60 (64.5) |
| Unspecified | 10 (20.4) | 2 (25) | 9 (25) | 21 (22.6) |
| Age, y | b | b | ||
| <10 | 0 (0) | 0 (0) | 0 (0) | 0 (0) |
| 10–19 | 0 (0) | 0 (0) | 1 (2.8) | 1 (1.1) |
| 20–29 | 4 (8.2) | 0 (0) | 2 (5.6) | 6 (6.5) |
| 30–39 | 5 (10.2) | 1 (12.5) | 3 (8.3) | 9 (9.7) |
| 40–49 | 9 (18.4) | 0 (0) | 5 (13.9) | 14 (15.1) |
| 50–59 | 6 (12.2) | 4 (50) | 7 (19.4) | 17 (18.3) |
| 60–69 | 13 (26.5) | 2 (25) | 7 (19.4) | 22 (23.6) |
| ≥70 | 9 (18.4) | 1 (12.5) | 10 (27.8) | 20 (21.5) |
| Unspecified | 3 (6.1) | 0 (0) | 1 (2.8) | 4 (4.3) |
| Regionc | b | b | ||
| Northeast | 7 (14.3) | 1 (12.5) | 1 (2.8) | 9 (9.7) |
| Midwest | 16 (32.7) | 1 (12.5) | 11 (30.6) | 28 (30.1) |
| South | 13 (26.5) | 2 (25) | 11 (30.6) | 26 (28) |
| West | 13 (26.5) | 4 (50) | 13 (36.1) | 30 (32.3) |
| Hospitalized | ||||
| Yes | 38 (77.6) | 7 (87.5) | 29 (80.6) | 74 (79.6) |
| No | 6 (12.2) | 1 (12.5) | 5 (13.9) | 12 (12.9) |
| Unknown | 5 (10.2) | 0 (0) | 2 (5.6) | 7 (7.5) |
| Died | ||||
| Yes | 3 (6.1) | 1 (12.5) | 2 (5.6) | 6 (6.5) |
| No | 41 (83.7) | 7 (87.5) | 30 (83.3) | 78 (83.9) |
| Unknown | 5 (10.2) | 0 (0) | 4 (11.1) | 9 (9.7) |
Data are presented as No. (%).
Abbreviation: IgG, immunoglobulin G.
aIgG antibody titer to phase I antigen of Coxiella burnetii ≥800 and IgG antibody titer to phase II antigen > phase I antigen.
bDenotes significant P value <.05 for the category when compared to confirmed cases.
cRegions are defined as follows: Northeast includes cases reported from the states Connecticut, Maine, New Jersey, New York, and Pennsylvania; Midwest includes Iowa, Illinois, Kansas, Michigan, Minnesota, Missouri, Ohio, and Wisconsin; South includes Alabama, Georgia, North Carolina, Oklahoma, Tennessee, Texas, Virginia, and West Virginia; and West includes Alaska, California, Colorado, Idaho, Montana, New Mexico, Oregon, Utah, and Washington.
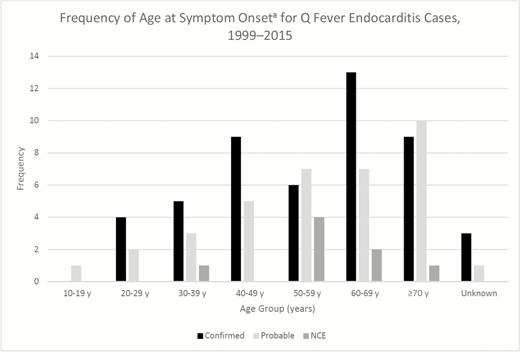
Frequency of age at symptom onset for confirmed, probable, and nonclassified cases of Q fever endocarditis (NCE) reported to the Centers for Disease Control and Prevention during 1999–2015.
aWhere onset date was not supplied, age was calculated using the first date of serum testing.
Only 6 cases reported one of the identified risk occupations: rancher (5 [10.2%]) and military (1 [2%]). Thirty-five confirmed cases (71.4%) reported occupations not associated with a known Q fever risk. Seven cases indicated they were retired (14.3%). Cats were the most frequently reported animal exposure (10 [20.4%]), followed by cattle (9 [18.4%]) and goats (8 [16.3%]). Animals not specifically listed on the CRF that also were reported included dogs (8 [16.3%]) and horses (4 [8.2%]). Few confirmed cases reported exposure to animal births (7 [14.3%]) or unpasteurized dairy products (4 [8.2%]).
Fever was the most frequently reported symptom (21 [42.7%]), followed by malaise (20 [40.8%]), cough (16 [32.7%]), and myalgia (16 [32.7%]) (Table 2). Splenomegaly was described in 3 cases (6.1%) and hepatomegaly in 2 cases (4.1%) (Table 2). Among confirmed cases, other symptoms included weight loss (4 [8.2%]), night sweats (4 [8.2%]), and gastrointestinal signs (3 [6.1%]). Fatigue, anemia, dyspnea, and neurological symptoms, including depression, blurred vision, and speech and memory problems were infrequently reported (≤5%). Seven cases (14.3%) reported a preexisting immunocompromising condition: one each reported systemic lupus erythematosus, diabetes mellitus, Hodgkin lymphoma with splenectomy, and chemotherapy; the remainder were not further specified. Thirty-four cases (69.4%) reported preexisting valvular disease, and although the nature of the valvulopathy was infrequently specified (n = 7), the majority had either a replacement (4 [57.1%]), stenosis (1 [14.3%]), or insufficiency (1 [14.3%]) of the aortic valve. There were 3 deaths reported among confirmed cases (case fatality rate [CFR] = 6.1%). All were non-Hispanic white men >50 years of age and all 3 had a history of valvular heart disease. The time between onset and death for these 3 cases was 29, 33, and 112 days.
Signs and Symptoms Reported for 93 Confirmed, Probable, and Nonclassified Cases of Q Fever Endocarditis Reported in the United States, 1999–2015
| Sign or Symptom | Confirmed (n = 49) | Nonclassifieda (n = 8) | Probable (n = 36) | Total (n = 93) |
|---|---|---|---|---|
| Fever | 21 (42.7) | 5 (62.5) | 23 (63.9)b | 49 (52.7) |
| Myalgia | 16 (32.7) | 2 (25) | 15 (41.7) | 33 (35.5) |
| Retrobulbar pain | 4 (8.2) | 0 (0) | 4 (11.1) | 8 (8.6) |
| Malaise | 20 (40.8) | 2 (25) | 18 (50) | 40 (43) |
| Rash | 8 (16.3) | 0 (0) | 2 (5.6) | 10 (10.8) |
| Cough | 16 (32.7) | 1 (12.5) | 15 (41.7) | 32 (34.4) |
| Headache | 10 (20.4) | 0 (0) | 6 (16.7) | 16 (17.2) |
| Splenomegaly | 3 (6.1) | 2 (25) | 0 (0) | 5 (5.4) |
| Hepatomegaly | 2 (4.1) | 1 (12.5) | 0 (0) | 3 (3.2) |
| Pneumonia | 6 (12.2) | 0 (0) | 9 (25) | 15 (16.1) |
| Hepatitis | 2 (4.1) | 1 (12.5) | 1 (2.8) | 4 (4.3) |
Data are presented as No. (%).
aImmunoglobulin G (IgG) antibody titer to phase I antigen of C. burnetii ≥800 and IgG antibody titer to phase II antigen > phase I antigen.
bDenotes significant P value <.05.
Probable Cases
Probable cases (n = 36) were predominantly male (31 [86.1%]), white (22 [61.1%]), non-Hispanic (20 [55.6%]), and >50 years of age (24 [66.7%]); however, the distributions of age, race, and ethnicity among the probable cases were statistically different from confirmed cases (P < .05) (Table 1). The median age was 57 years (range, 16–87 years) (Figure 1). Geographic distribution was also significantly different from confirmed cases (P = .0022), but again the fewest probable cases originated from the Northeastern region (1 [2.8%]) of the United States (Table 1). Twenty-nine (80.6%) probable cases were hospitalized for their illness.
Two probable cases worked at a dairy (5.6%), 3 were ranchers (8.3%), one was in the military (2.8%), and one worked in animal research (2.8%). Four cases (11.1%) indicated that they were retired. Cattle and cats were the most frequently reported animal exposure (5 [5.9%]), followed by sheep (4 [4.7%]); 5 probable cases reported contact with dogs (13.9%). No probable cases had contact with goats, and this was statistically significant when compared to confirmed cases (P = .0094). Additionally, 2 probable cases reported exposure to birthing animals (5.6%, cattle and sheep), and 2 (5.6%) reported consumption of unpasteurized dairy, both of which were significantly different than among confirmed cases (P = .0075 and P = .0128, respectively). Probable cases did not differ significantly from confirmed cases in occupation (P > .1).
Fever was the most frequently reported symptom (23 [63.9%]), followed by malaise (18 [50%]), myalgia (15 [41.7%]), and cough (15 [41.7%]) (Table 2). Fever was reported by a greater proportion of probable cases compared with confirmed cases, and this was statistically significant (P = .0285). More probable cases reported pneumonia (9 [25%]) than confirmed cases, but this was not statistically significant (P = .0732) (Table 2). Ten probable cases were immunocompromised (27.8%); the most frequently reported conditions were diabetes (5 [50%]) and end-stage renal disease (3 [33.3%]). Eleven (30.6%) reported valvular disease, the nature of which was not further specified. The proportion of probable cases reporting valvular disease was significantly different from confirmed cases (P < .001). There were 2 deaths reported among the probable cases (CFR = 5.6%). One occurred in a white, non-Hispanic female, >70 years of age from the Midwest region with preexisting valvular disease; death occurred 6 months after onset. The other death occurred less than a month after onset in a Native American man >70 years of age from the Western region.
Nonclassified Endocarditis Cases
Nonclassified endocarditis cases (n = 8) were predominately male (7 [87.5%]), white (5 [62.5%]), non-Hispanic (6 [75%]), and >50 years of age (7 [87.5%]) (Table 1). The median age was 55 years (range, 31–71 years) (Figure 1). The age distribution was significantly different from those cases who met the confirmed case definition (P < .05) (Table 1). The geographic distribution of these cases was also significantly different from that of confirmed cases (P = .021), with half of the cases originating from the Western region (Table 1). Seven patients (87.5%) were hospitalized for their illness.
Cattle (2 [25%]), sheep (2 [25%]), and dogs (2 [25%]) were the most frequently identified animal exposures. Two patients (25%) also reported exposure to birthing animals (cattle and sheep). None of these cases reported consumption of unpasteurized dairy. Compared with confirmed cases, there were no statistically significant differences among animal exposures, unpasteurized dairy consumption, or exposure to animal births (P > .05) (Table 2). All NCE cases reported “other occupation” and only one (12.5%) was associated with increased risk for Q fever.
Fever was the most frequently reported symptom (5 [62.5%]), followed by malaise (2 [25%]) and myalgia (2 [25%]) (Table 2). There were no statistically significant differences among the proportion of NCE cases reporting any symptoms compared with confirmed cases (P > .05). Two cases (25%) had a preexisting immunocompromising condition: one was unspecified and the other reported diabetes. Five (62.5%) had history of valvular disease, one of which had received 2 heart valve replacements (12.5%). When compared to confirmed cases, neither the proportion reporting history of valvular disease nor immunocompromising condition was significantly different (P = .28 and P = .27, respectively). IgG antibody titers to phase I and phase II antigens for each case in this subset are listed in Table 3. One death occurred in a 50-year-old man with a history of valvular disease and ventricular septal defect (CFR = 12.5%). Phase I IgG titers were 16384 and the phase II IgG titer was 65536 (Table 3).
Immunoglobulin G Antibody Titers to Phase I and Phase II Antigens of Coxiella burnetii for 8 Patients With Endocarditis Reporting Phase I Titers ≥800 and Phase II Titers Greater Than Phase I
| Case | IgG Antibody Titer to Phase I Antigen of Coxiella burnetii | IgG Antibody Titer to Phase II Antigen of Coxiella burnetii |
|---|---|---|
| 1 | 8192 | 32768 |
| 2 | 8192 | 16384 |
| 3 | 16384 | 65536 |
| 4 | 131072 | 131073 |
| 5 | 2048 | 4096 |
| 6 | 65536 | 131073 |
| 7 | 16384 | 65536 |
| 8 | 1024 | 4096 |
Abbreviation: IgG, immunoglobulin G.
DISCUSSION
These 93 cases of endocarditis reported to CDC during the first 17 years of national surveillance for Q fever represent the largest summary of cases of Q fever endocarditis reported from the United States. As described here and in other series, most persons presenting with Q fever endocarditis are male and >50 years of age [5, 11, 19–23]. Increasing age has been identified as a risk factor for chronic Q fever, likely due to an increased prevalence of valvulopathies in aging persons [24]. The apparent increased frequency of Q fever infection in male patients could be explained by the protective role of estrogens, which limit both bacterial load and granuloma infection in C. burnetii–infected mice [25]. These demographic features more specifically reflect a greater level of risk associated with degenerative valvular lesions in older male cohorts [26]. Although there were differences noted between the confirmed and probable groups among some of the demographic variables, there were no statistically significant differences in the proportion who were hospitalized or in the proportion who died.
The incidence of Q fever endocarditis in the United States is unknown. However, the overall incidence of infective endocarditis has increased steadily since the end of the 20th century, for multiple reasons that could include improvements in diagnosis and increasing survival of high-risk persons, such as those with congenital heart disease and intracardiac devices [27]. Coxiella burnetii is a fastidious organism that grows only in cells or specialized media and conventional blood cultures cannot be used to isolate this pathogen. Only a few studies worldwide have specifically examined the frequency of Q fever endocarditis among patients with blood culture–negative endocarditis, with estimates that range considerably, from 3.2% to 48% [28].
National surveillance for Q fever began in 1999 to address concerns regarding the potential use of C. burnetii as a bioweapon [29, 30]. The original goals of surveillance were to define the clinical profile, risk factors, and geographic distribution of naturally occurring cases, such that outbreaks of Q fever related to bioterrorism could be more readily identified [30]. The case definition for Q fever was later revised in 2007 and chronic Q fever was added as a separate notifiable condition [18]. Subsequently, the CRF was updated to reflect the new case definition, but the specific types of demographic, clinical, and laboratory data collected on the form did not change. As a result, much of the clinical and epidemiological data currently collected on reported cases of Q fever are more relevant for acute Q fever than for Q fever endocarditis.
Serological testing by IFA assay is the most commonly used laboratory method to diagnose Q fever endocarditis. In several countries where C. burnetii is endemic, the diagnosis of Q fever endocarditis is confirmed in persons who demonstrate clinical evidence of endocarditis and an IgG antibody titer to phase I antigen of ≥800 [31, 32]. In most persons with Q fever endocarditis, phase I antibody titers exceed those of phase II [33, 34]; nonetheless, as demonstrated in several studies [21, 33, 35, 36], some patients with Q fever endocarditis have antibody titers to phase II antigen that exceed those to phase I antigen. In our evaluation, the only statistically significant differences between the NCE group and the confirmed Q fever endocarditis group were in age and region; there were no statistically significant differences noted among clinical signs and symptoms or outcome. These 8 cases could not be classified by the current CSTE case definition, suggesting that comparison of phase I titers with phase II titers could be reevaluated as a surveillance criterion for Q fever endocarditis.
The data presented here were collected through passive surveillance and are subject to inherent limitations, including underreporting of cases and marked variability in the completeness of information provided for compilation and analysis. These data are provided to CDC voluntarily, and the reporting practices of health departments in different states are diverse. In this context, the information acquired by national surveillance inherently lacks the level of granularity of those data obtained by active surveillance or from institutional case series. Some findings reported here are not directly comparable with those summarized from smaller-scale studies with greater access to individual patient data. For example, the CFR for Q fever endocarditis cases described here is lower than that reported from other series [5, 6, 8, 9, 11, 12, 23]. Nonetheless, a recent capture-recapture analysis suggests that cases of fatal Q fever are underreported in the United States [37]. Existing national surveillance also does not capture many important characteristics regarding the nature and progression of Q fever endocarditis, including the frequency of cardiac failure, occurrence and distribution of cardiac vegetations, arterial emboli or septic infarcts, or the duration of illness. C. burnetii is also an important cause of other vascular infections, including those involving aneurysms or prosthetic grafts [38, 39]. Our evaluation did not include an assessment of these other types of endovascular infections; nonetheless, in some countries, these occur with greater frequency than Q fever endocarditis [21]. Further studies that more precisely target, collect, and analyze pertinent demographical and clinical data identified by other studies worldwide are warranted to better evaluate the characteristics and magnitude of Q fever endocarditis and other manifestations of chronic Q fever in the United States.
CONCLUSIONS
This study summarizes a limited set of demographical and clinical features of Q fever endocarditis collected through passive surveillance from state health departments during 1999–2015, comprising the largest collection and analysis of data for this life-threatening condition in the United States. Similar to other studies worldwide, most patients were male and >50 years of age. Current CSTE laboratory criteria failed to classify some cases of apparent Q fever endocarditis, to suggest a reexamination of strict comparisons between phase I and phase II titers as a surveillance criterion. Prospective analyses of patients with culture-negative endocarditis are needed to better assess the clinical spectrum and magnitude of Q fever endocarditis in the United States.
Notes
Acknowledgments. The authors thank the clinicians, laboratorians, and public health department staff who diagnose and investigate cases of Q fever. The findings described in this report are possible because of their continued efforts. We also thank Naomi Drexler, John Krebs, Kristen Nichols Heitman, Eric Mandel, and Lindsey Pool for assistance in compiling and organizing surveillance data used in this analysis.
Disclaimer. The findings and conclusions in this report are those of the authors and do not necessarily reflect the official position of CDC.
Financial support. This work was supported by the CDC.
Potential conflicts of interest. All authors: No reported conflicts of interest. All authors have submitted the ICMJE Form for Disclosure of Potential Conflicts of Interest. Conflicts that the editors consider relevant to the content of the manuscript have been disclosed.
References


Comments