


Abstract
Brain genetics is an active research area. The degree to which genetic variants impact variations in brain structure and function remains largely unknown. We examined the heritability of regional brain volumes (P ~ 100) captured by single-nucleotide polymorphisms (SNPs) in UK Biobank (n ~ 9000). We found that regional brain volumes are highly heritable in this study population and common genetic variants can explain up to 80% of their variabilities (median heritability 34.8%). We observed omnigenic impact across the genome and examined the enrichment of SNPs in active chromatin regions. Principal components derived from regional volume data are also highly heritable, but the amount of variance in brain volume explained by the component did not seem to be related to its heritability. Heritability estimates vary substantially across large-scale functional networks, exhibit a symmetric pattern across left and right hemispheres, and are consistent in females and males (correlation = 0.638). We repeated the main analysis in Alzheimer’s Disease Neuroimaging Initiative (n ~ 1100), Philadelphia Neurodevelopmental Cohort (n ~ 600), and Pediatric Imaging, Neurocognition, and Genetics (n ~ 500) datasets, which demonstrated that more stable estimates can be obtained from the UK Biobank.
Introduction
The contribution of genetic variations to brain structure and function is of great interest (Adams et al. 2016; Franke et al. 2016). One major goal of brain imaging genetic studies is to understand the degree to which genetics can explain variations in imaging phenotypes, which are usually measured by the associated heritability. Heritability is the proportion of observed phenotypic variation that can be explained by the inherited genetic factors. Specifically, heritability can be measured by either the proportion of total genetic variation (broad sense), or the proportion of total additive genetic variation (narrow sense) (Visscher et al. 2008). One traditional way to estimate narrow-sense heritability is using samples from twin/family studies (Bartels et al. 2003; Visscher et al. 2006), in which the pedigree information can capture the effects of all genetic variants on phenotype (Visscher et al. 2014). Then, heritability can be estimated by the fraction of phenotypic variation explained by the genetic relationships among these related subjects. However, family-based heritability estimator is based on contrasting the phenotypic similarity between monozygotic and dizygotic twins, and thus the genetic architecture of the phenotype is largely unknown. Genetic architecture is the characteristics of genetic variations, which contribute to the broad-sense heritability (Timpson et al. 2017). Particularly, when almost all genetic variants are believed to have small but nonzero contributions, the genetic architecture of this specific phenotype is described as highly polygenic, or onmigenic (Badano and Katsanis 2002; Boyle et al. 2017). With genome-wide genotyping data on unrelated individuals, an alternative estimator of narrow-sense heritability derives from the additive effects of all common single-nucleotide polymorphisms (SNPs) on phenotype among these unrelated samples, which is usually called SNP heritability (Speed et al. 2017). Instead of using the expected relationship based on pedigree information, SNP heritability is estimated from a genome-wide average across all common SNPs (Toro et al. 2015). Since SNP heritability can capture neither nonadditive genetic variation nor genetic variation not covered by SNPs measured by the selected genotyping microarray, it is usually viewed as a lower bound estimate for (narrow-sense) heritability. However, SNP data can reveal the genetic architecture of phenotypes. Such information provides rationale for downstream genetic association studies that aim to identify associated genes and pathways. Recently, computing tools such as genome-wide complex trait analysis (GCTA) (Yang et al. 2011), linkage disequilibrium score regression (Bulik-Sullivan et al. 2015), BOLT-REML (Loh et al. 2015), and massively expedited genome-wide heritability analysis (Ge et al. 2015) have been developed for SNP heritability estimation.
The genetic architecture of brain regional volumes has been previously reported in some studies, which often focus on a few specific brain regions, such as putamen, amygdala, and hippocampus (Hibar et al. 2015; Franke et al. 2016; Guadalupe et al. 2017). However, the genetic influences on many other brain regions are still largely unknown. In addition, these heritability studies are often using integrated datasets from several cohorts (Chen et al. 2015; Roshchupkin et al. 2016; Hibar et al. 2017), which may suffer from the heterogeneity of study populations. It is well known that heritability is not a fixed property of a phenotype, and analysis of different datasets can result in different estimates of heritability. The estimation of heritability depends on the relative contribution of genetic factors, nongenetic factors and possibly their interaction. People from different ethnic groups can have different genetic backgrounds and be subject to different nongenetic factors. Moreover, methodological factors, such as the sample size of the study and measurement error of the phenotype, can also impact the estimation. For these reasons, the United Kingdom (UK) Biobank (Sudlow et al. 2015; Satizabal et al. 2017) provides a unique opportunity to comprehensively study the genetic contributions to many brain regions in one single large-scale, relatively homogeneous population. It is an open-access, large prospective study with over 500 000 participants of middle or elderly age. Currently around 10 000 of these subjects have brain imaging data available (Alfaro-Almagro et al. 2018).
Here, we used all common (minor allele frequency [MAF] > 0.01) autosomal SNPs to estimate the heritability for 101 regional brain volumes (BVs), including the total BV, total gray matter (GM), white matter (WM), and cerebrospinal fluid (CSF). We partitioned genetic variation into individual chromosomes to examine the distribution of heritability across the genome. To assess whether functional annotation (Finucane et al. 2015; Hu, Lu, Liu, et al. 2017; Hu, Lu, Powles, et al. 2017; Wang et al. 2017) is associated with genetic effects, we partitioned genetic variation according to cell-type-specific annotations. In addition, we estimated the heritability of principal components (PCs) derived from the regional volume data and evaluated the variability of heritability estimations across brain regions and functional networks. Furthermore, we estimated gender-specific heritability in each region. We compared the main findings from the UK Biobank with those from the Alzheimer’s Disease Neuroimaging Initiative (ADNI, n ~ 1100) (Weiner et al. 2013), Philadelphia Neurodevelopmental Cohort (PNC, n ~ 600) (Satterthwaite et al. 2014), and Pediatric Imaging, Neurocognition, and Genetics (PING, n ~ 500) (Jernigan et al. 2016), which demonstrated that more stable estimates can be obtained from the UK Biobank.
Materials and Methods
Participants and Image Preprocessing
Datasets used in this article included the UK Biobank, ADNI, PNC, and PING.
For each dataset, we used subjects with both magnetic resonance imaging (MRI) and SNP data available after applying proper quality controls. We only used baseline data for longitudinal studies. Detailed data collection/processing procedures and quality control prior to the release of data are documented at http://www.ukbiobank.ac.uk/resources/ for UK Biobank, http://adni.loni.usc.edu/data-samples/ for ADNI, http://pingstudy.ucsd.edu/resources/genomics-core.html for PING, and https://www.ncbi.nlm.nih.gov/projects/gap/cgi-bin/study.cgi?study_id=phs000607.v1.p1 for PNC.
The MRI data were preprocessed using standard procedures via advanced normalization tools (ANTs) (Avants et al. 2011). Our preprocessing steps consisted of the N4 bias correction, registration-based brain extraction, and a prior-based N4-Atropos 6 tissue segmentation (oasis template), which classified the brain into WM, GM, deep GM, CSF, brainstem, and cerebellum. We then adopted the 101 regions of interest (ROIs) defined by the manually edited labels of the publicly available MindBoggle-101 dataset (Klein and Tourville 2012) to perform multiatlas cortical parcellation. We excluded subjects for whom the imaging data did not pass the standard imaging quality controls, and removed 3 ROIs with many missing values: X5th ventricle, left lesion and right lesion (missing rate > 99%). There was a total of 101 regional BVs, including total BV, GM, WM, and CSF. We standardized each volume to better fit the assumption for the LMM. By checking the studentized residuals of the linear model between volume with age and gender, we deleted the top 10 outlier subjects for each standardized volume. The demographic information related to the MRI datasets are listed in Supplemental Table S1.
Genotyping
Genotype imputation was performed on the PNC, ADNI, and PING datasets. A full description of the imputation procedure in PNC, ADNI, and PING datasets is provided in Supplementary Methods. For UK Biobank, we used an unimputed dataset. Previous study has reported that the heritability estimates from imputed and unimputed SNP data are similar (Davis et al. 2013). On each SNP dataset, we only selected subjects with available BV data, and then we used all autosomal SNPs and applied the same standard quality control procedures in each SNP dataset (Purcell et al. 2007): excluding subjects with more than 10% missing genotypes, only including SNPs with MAF > 0.01, with genotyping rate >90%, and passing Hardy–Weinberg test (P > 1 × 10⁻⁷). We further removed non-European subjects, if any. In PING, we only used biologically unrelated subjects. After quality control, we calculated the GRM by all SNPs and by SNPs on each chromosome separately using GCTA software (Yang et al. 2011). To avoid including closely related relatives, we excluded one of any pair of individuals with estimated genetic relationship larger than 0.025. The sample sizes of the datasets after conducting all quality control procedures are listed in Supplementary Table S2.
Heritability Analysis
First, for each regional volume, we estimated the proportion of variation explained by all autosomal SNPs with a LMM (101 analyses in total). The formal setting of the LMM and definition of likelihood ratio test statistics can be found in (Yang et al. 2011). The basic idea is to fit the GRM with random effects to the phenotypic measure, while adjusting for other covariates with fixed effects. The GRM was the correlation matrix of participants estimated by the common genetic variants, which was expected to capture the genetic similarity among unrelated individuals. Then the heritability of a phenotype was estimated by contrasting the genetic similarity among individuals with their phenotypic similarity. Baseline age, gender indicator, top 10 PCs of GRM and BV (for regions other than BV itself) were included as covariates, unless otherwise stated. We also included the phase indicator for the ADNI study to adjust for potential batch effects. Besides the combined sample, we fitted the LMM separately on female and male samples for UK Biobank data. Second, we partitioned the genetic variation by each chromosome. We estimated the GRM of each chromosome and fitted each of them separately on each volume (22 analyses per volume, 2222 analyses in total). The same set of covariates was included in these LMMs. Next, we performed PCA on the volumes and computed the heritability of the top 10 PCs. We also partitioned the genetic variation on the components by each chromosome. In the LMMs for the components, we did not adjust for BV unless otherwise stated, since we have observed that the variation of BV is almost captured by the first component, and should be orthogonal to the remaining components.
Finally, we fitted linear models between the length of a chromosome and the aggregate heritability of all volumes or their components to study the heritability distribution across the genome. We clustered the regions according to their biological functions and showed the heritability distribution across these communities using the R package circlize (Gu et al. 2014).
Functional Enrichment of Genetic Signals
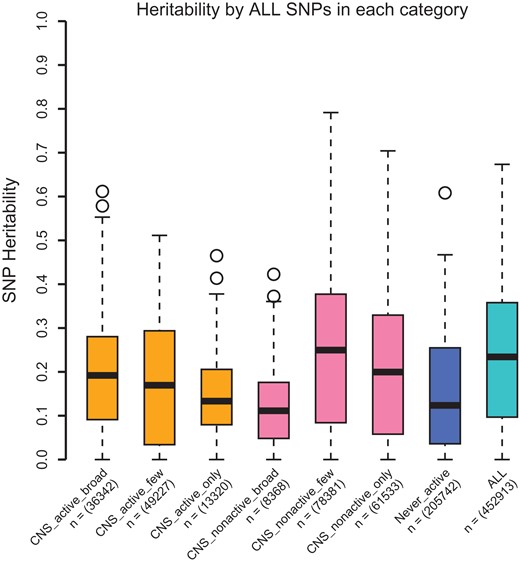
Cell-type-specific active chromatin annotations per SNP were from (Finucane et al. 2015) and (Boyle et al. 2017). According to Finucane et al. (2015), we performed functional annotation analyses using cell-type-specific annotations marked by the 4 histones: H3K4me1, H3K4me3, H3K9ac, and H3K27ac. Each cell-type-specific annotation corresponded to a histone mark in a single cell type, and there were 220 such annotations. The 220 cell-type-specific annotations were further divided into 10 groups, including adrenal gland and pancreas, CNS, cardiovascular system, connective tissue and bone, gastrointestinal, immune and hematopoietic systems, kidney, liver, skeletal muscle and other. The SNPs were first divided into 4 overlapping groups according to their activeness in all cell-type groups (only, few, broad, and never active). A SNP was labeled “only” if it was annotated as active in only 1 of the 10 cell-type groups. A SNP was labeled “few” if it was annotated as active in at most 5 cell-type groups. SNPs that were active in 6–10 cell-type groups were labeled “broad,” and SNPs that were not active in any cell type were labeled “never active.” Then, SNPs were further labeled as either active in the CNS cell group (“CNS active”) or not (“CNS inactive”). Finally, we have 7 SNP categories: CNS_active_broad (n = 36342), CNS_active_few (n = 49 227), CNS_active_only (n = 13 320), CNS_nonactive_broad (n = 8368), CNS_nonactive_few (n = 78 381), CNS_nonactive_only (n = 61533), and never_active (n = 205 742). We then calculated the heritability explained by all SNPs in each category on each region of interest.
Results
Heritability Estimates by all Common Autosomal SNPs
We first estimated the proportion of variation in regional BVs that can be explained by all common autosomal SNPs, using linear mixed-effect models (LMMs) (see Materials and Methods). Genetic similarity among individuals was captured by the genetic relationship matrix (GRM). We used GCTA tools (Yang et al. 2011) for heritability estimation, adjusting for baseline age, gender, top 10 PCs, as well as BV (to remove scaling effects for other regions).
Supplementary Tables S3 and S4 display the heritability estimates, standard errors, and P-values from the one-sided likelihood ratio test in each brain region. We found that a large proportion of variation in regional volume is explained by additive genetic effects. The heritability estimates vary across the brain (Supplementary Fig. S1). The top 10 regions with high heritability estimates are the brainstem 82.7%, cerebellar vermal lobules VIII.X 68.3%, cerebellar vermal lobules I.V 68.0%, BV 65.9%, left cerebellum exterior 64.1%, right cerebellum exterior 63.2%, WM 62.8%, right ventral diencephalon (DC) 62.4%, left ventral DC 58.8%, and right cerebellum WM 58.1%, in descending order of heritability point estimate. Noticeable evidence of symmetry in heritability estimates is observed in many brain regions. In Supplementary Fig. S1, many left/right pairs of regions (such as R/L 07, R/L 44, R/L 08, R/L 19) are located next to each other. Since we have a sufficiently large sample size (n ~ 9000), P-values for most regions are highly significant even after controlling the false discovery rate at 0.05 by Benjamini and Hochberg procedure (Benjamini and Hochberg 1995).
We investigated whether the observed considerable variability in heritability estimates across brain regions is driven by the varying levels of regional BVs. Supplementary Figure S2A shows the linear relationship between the SNP heritability estimate and the average volume of each brain region. Although there is significant association between heritability estimates and average volume size (P-value <0.002) in the UK Biobank, we observe that large region does not necessarily has high heritability estimate (R-squared = 0.096). Genetic contributions have large variation among regions with comparable mean volume sizes.
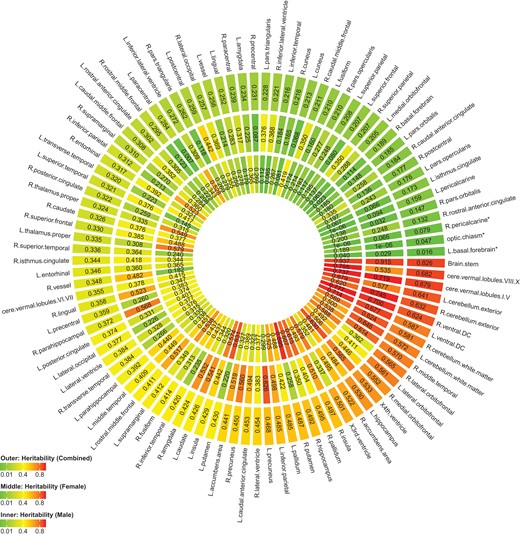
We also estimated gender-specific heritability in each region (Fig. 1). The top regions with largest gender disparity, as measured by absolute difference in point heritability estimates are listed in Supplementary Table S5. Although there are several regions showing strong evidence of gender difference, such as right putamen (difference = 0.437) and left putamen (difference = 0.411), the distribution of heritability is largely consistent among all, female and male subjects.
Gender-specific heritability estimate of each region in UK Biobank.
Partitioning Genetic Variation by Chromosome
To examine the distribution of heritability across the genome, we partitioned genetic variation into individual chromosomes. Specifically, we estimated GRM using SNPs on each chromosome and estimated heritability separately for each chromosome on each regional BV (22 analyses per region, 2222 analyses in total).
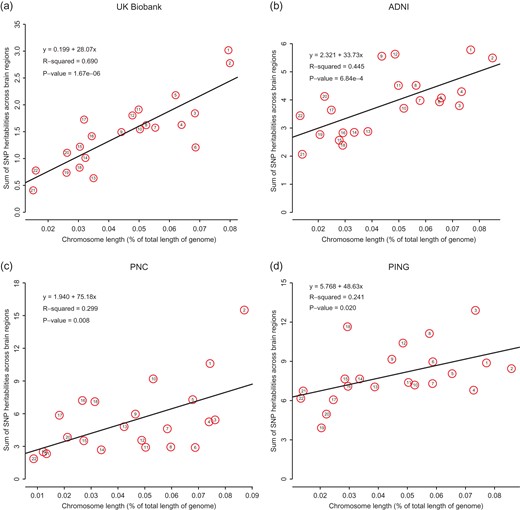
Supplementary Figure S3A shows the heritability estimates by chromosome. The chromosomes are ordered from left to right by their lengths. We found that longer chromosomes tend to have larger heritability estimates than shorter ones. We then calculated the aggregate heritability across all of the 101 regions and found that the aggregated heritability explained by each chromosome is also highly correlated with chromosome length (Fig. 2a, R2 = 69.0%, P-value = 1.67 × 10⁻⁶). These findings are consistent with a highly polygenic, or omnigenic model (Lee et al. 2012; Boyle et al. 2017) and indicate that SNPs contributing to variations in regional BVs are spread nearly uniformly across the genome.
Aggregated heritability of brain regions by each chromosome. In each dataset, heritability explained by each chromosome is highly correlated with chromosome length.
Partitioning Genetic Variation by Functional Annotation
We explored whether functional annotation of SNPs can explain the amount of genetic variation. Following (Finucane et al. 2015), we used 220 cell-type-specific annotations. Specifically, SNPs were divided into 7 groups according to their activeness among 10 cell groups, namely adrenal gland and pancreas, central nervous system (CNS), cardiovascular system, connective tissue and bone, gastrointestinal, immune and hematopoietic systems, kidney, liver, skeletal muscle and other. In our analysis, we particularly focused on SNPs active in the CNS cell group (see Materials and Methods). We found that the heritability estimated by SNPs residing in chromatin regions inactive across all cell groups is similar to the heritability estimated by SNPs residing in chromatin regions active in at least one cell group (mean difference = 0.028, P-value = 0.064, Fig. 3). Moreover, SNPs in chromatin regions particularly active in the CNS cell group and SNPs in CNS-inactive chromatin regions (but active in other cell groups) contributed similarly to the heritability of brain region volumes (mean difference = 0.014, P-value= 0.279). On average, SNPs in chromatin regions, which are active in a few cell groups, but not specifically active in CNS cell group, contribute the largest to the heritability of brain region volumes.
Heritability of brain regions by category of SNPs according to functional annotations in UK Biobank.
Heritability Pattern Across Brain Function Networks
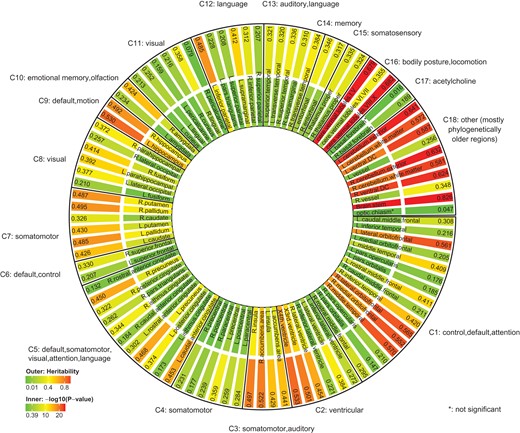
To investigate the heritability pattern across large-scale brain functional networks, we clustered 97 brain regions into 18 functional communities (Buckner et al. 2008; Sporns and Betzel 2016; Huang et al. 2017) (Supplementary Table S6). We found that the heritability estimates vary substantially across these functional communities, while the degree of gene control on these functional communities is comparable (Fig. 4). Communities with many functions (larger than 2) tend to have large regional variance in heritability. For example, communities C1 and C5 are involved in several networks, including default mode, somatomotor, visual, attention, and language. Regions within the 2 communities have large variance in heritability estimates. Other clusters linked to 1 or 2 functions (with smaller cluster size as well) tend to have smaller regional variance in heritability estimates. The heritability estimates cluster rather tightly together for regions within communities C9 (default mode, motion), C11 (visual), C13 (auditory, language), C14 (memory), and C15 (somatosensory). Most of the regions in C18 (other) are phylogenetically older regions which are involved in many critical functions for life. It is interesting to note that these foundational regions would be most heritable.
SNP heritability and adjusted P-values grouped by brain function networks in UK Biobank.
Heritability Analysis After Dimension Reduction
To evaluate BVs on a global scale, we performed principal component analysis (PCA) on the regional BVs and obtained the top 10 PCs. Since the top PCs can explain a large part of variation of the BVs, the heritability pattern of these top PCs may reveal the genetic contributions to all the regions at a global level. Supplementary Table S7 lists the heritability estimates for the top 10 PCs with and without adjusting for BV. We found that the first PC has a high heritability estimate without adjusting for BV (68.7%), but the heritability estimate is zero after adjusting for BV. These estimates indicate that the first PC fully captured the variance of BV. The Pearson correlation between the first PC and BV is 0.979. As the PCs are orthogonal, adjusting for BV did not affect the heritability estimates of other PCs.
Although the top 10 PCs are highly heritable, the amount of phenotypic variation explained by each PC does not seem to be related to the heritability of the PC. For example, the heritability of the second PC was much smaller than that of the other top 10 components. It makes sense because nongenetic factors, nonadditive genetic effects and even batch effects may also contribute to variation in BVs. We also calculated heritability estimates by each chromosome for these top 10 PCs (Supplementary Fig. S4A) and found that the sum of the heritability values explained by each chromosome is again highly correlated with chromosome length (Supplementary Fig. S5A, R2 = 49.6%, P-value = 2.48 × 10⁻⁴).
Similar to brain functional community analysis, we grouped the brain regions into 10 modules according to their loadings for the top 10 PCs. That is, we classified the regions corresponding to the top 10 loadings of each component into 1 module. Each region therefore can fall into more than 1 module. In our analysis, most regions fell only into 1 (44 regions) or 2 (25 regions) modules. Supplementary Figure S6 shows the distribution of heritability estimates across these 10 modules. Again, regions classified in modules corresponding to PCs that explain more volume variation do not necessarily have higher heritability estimates. As expected, regions in modules corresponding to PCs with higher heritability estimates also have higher heritability estimates.
Comparing UK Biobank Results With Results From Other Datasets
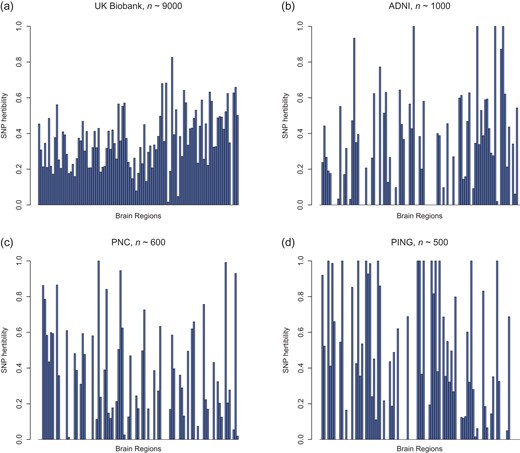
The same analyses presented above in the UK Biobank were conducted in 3 other datasets, namely ADNI, PNC, and PING datasets. Due to smaller sample sizes, heritability estimates from these 3 datasets have much larger variance than those from the UK Biobank (Fig. 5, Supplementary Figs S7 and S8). After multiple testing adjustment, we found few regions or PCs to be significant at a false discovery rate of 0.05 in the 3 studies (Supplementary Tables S8–S13).
Comparing SNP heritability in different datasets. Estimates of variation explained by all autosomal SNPs of each regional brain volumes as well as GV, WM, BV, and CSF (last 4 bars).
However, some findings are indeed consistent. For example, from each dataset, we observed the linear relationship between chromosome length and the variance explained by each chromosome. But the association tends to be weaker as the sample size decreases (Fig. 2 and Supplementary Fig. S5).
Discussion
In summary, our extensive analyses across 4 imaging genetic datasets support the following 5 important findings. First, regional volumes are generally heritable. The majority of brain regions are similarly heritable among females and among males. Study samples used in this work vary from young (PING, PNC) to middle-age/elderly participants (ADNI, UK Biobank). Second, we observe omnigenic patterns where genetic variants contributing to variations in BVs are widely spread across the genome with one major evidence being the significant positive linear relationship between chromosome-specific heritability estimates and chromosome length. Third, because the SNPs are sufficiently interconnected, genetic variants residing in CNS-cell active and CNS-inactive chromatin regions explain similar variation in BVs.
Fourth, through PCA, we demonstrated that the top PCs are also highly heritable, but the amount of BV variation explained by the PCs does not seem to be related to the heritability estimates of these PCs. Fifth, the genetic influences are not uniformly distributed across the brain regions or brain functional communities. Similar genetic control can be found among regions within a small community and on pairs of regions in the left and right hemispheres. Compared with ADNI, PNC, and PING, UK Biobank can provide more stable estimates of heritability with smaller standard errors.
We found that 65.9% of BV variability can be explained by genetic variation of all common autosomal SNPs for UK Biobank subjects. Adjusting for BV, 39.3% of CSF volume variability is explained by genetic variation. Without BV adjustment, the heritability estimates for GM (67.5%) are similar to the estimates for BV (65.9%); after adjusting for BV, the heritability estimates for GM are zero, suggesting that BV and GM share the same or very similar genetic bases. For WM, however, heritability estimates remain almost unchanged before and after adjusting for BV (62.8% and 62.0%, respectively), indicating that genes underlying WM are not general brain growth genes, but rather more likely to be genes that specific control this particular brain structure and subregions. Our heritability estimates are similar to those reported in Carmelli et al. (1998), Pol et al. (2006), Kremen et al. (2010), and Bryant et al. (2013). We have more clearly illustrated the different genetic bases behind BV/GM volume and WM volume. Different from the intracranial volume generated from the Freesurfer (Fischl 2012) software, the BV provided by ANTs (Avants et al. 2011) is calculated as the total volume of nonzero voxels within the brain mask, which could be an limitation of our findings.
In regional volume analysis, we obtained the heritability estimates of 97 regions, showing that the regions are highly heritable and genetic influences are not uniformly distributed across the brain. Particularly, the heritability is estimated to be 53.1% on left hippocampus, 49.2% on right hippocampus, 42.7% on left caudate, 32.7% on right caudate, 48.5% on left pallidum, 49.6% on right pallidum, 43.1% on left putamen, 48.8% on right putamen, 42.5% on right amygdala, and 23.5% on left amygdala, all of them are statistically significant after multiple testing adjustment and are within the range of previously reported heritability estimates (Roalf et al. 2015; Ge et al. 2016; Greenspan et al. 2016; Patel et al. 2017; Satizabal et al. 2017; Wigmore et al. 2017). To assess whether the lower heritability is caused by smaller regional volume, we quantify the concordance between the average volume sizes and heritability estimates and find regional variation of genetic contribution is observed among the regions with comparable average volume sizes. In addition, we found strong evidence that the estimates have a symmetric pattern across the left and right hemispheres. Many left/right pairs of regions have similar estimates, consistent with results from previous twin studies (Wright et al. 2002; Chen et al. 2012). Our gender-specific analysis across all regions show that the majority of additive genetic effects are shared between female and male subjects (correlation = 0.638, Supplementary Fig. S9). Several regions do have large gender differences in heritability, such as left/right putamen, whose gender differences have been previously reported (Guadalupe et al. 2017).
To further study the patterns of regional variations in heritability estimates, we clustered the regions by their biological functions. In brain functional network analysis, we grouped the 97 regions into 18 nonoverlapping brain functional communities. We found the community-wise variability in heritability across these functional communities, while the genetic influences widely prevail across the brain functional networks with comparable degrees of control (heritability). The regions within each community do not necessarily have similar heritability estimates, depending on the linked community functions. We performed PCA and found that the components explaining more volume variations do not necessarily have higher heritability, nor higher loadings on regions with higher heritability. This makes sense because PCA is an unsupervised dimension reduction technique. Nongenetic factors or nonadditive genetic effects that are not captured by SNPs also influence variation in BV.
The significant linear correlation between the variance explained by a chromosome and the length of the chromosome was observed on both the volumes and PCs. These patterns suggest that genetic variants controlling regional BVs are rather ubiquitously distributed across the genome. Similar findings have been reported on other phenotypes, such as height, body mass index, neuroanatomical phenotypes, and schizophrenia (Yang et al. 2011; Lee et al. 2012; Toro et al. 2015; Fritsche et al. 2016; Shi et al. 2016; Kemp et al. 2017; Shan et al. 2017). To explain this phenomenon, Boyle et al. (2017) proposed an omnigenic hypothesis where most heritability can be explained by effects of genes outside core pathways because gene regulatory networks are sufficiently interconnected. We observed that the CNS-active and CNS-inactive SNPs contribute similarly to heritability of brain region volumes. This phenomenon can be intuitively explained by the hypothesis of sufficiently interconnected SNPs proposed by (Boyle et al. 2017). However, the results should be interpreted with caution because the number of SNPs outside the CNS-active chromatin regions is larger than the number of SNPs within the CNS-active chromatin regions.
Finally, we compared the results from UK Biobank with the results from the other 3 datasets. The UK Biobank allows more stable estimation of the magnitude of genetic determination of the human brain. In ADNI, PNC, and PING, extreme estimates such as 0.999 or 0 occurred for some regions (Fig. 5); these estimates should not be interpreted as “true” heritability estimates, but only indicate large or small heritability values for a region. In UK Biobank, no such extreme estimates are observed, and the heritability estimates range from 1.6% to 82.6%, with standard error approximately 0.07. Although SNP heritability estimates are at the lower bound of (narrow-sense) heritability, we observed many heritable brain regions using the UK Biobank dataset, and the estimates are statistically significant using a likelihood ratio test after multiple testing adjustment (Benjamini and Hochberg 1995). For the other 3 datasets, however, few significant findings remain after multiple testing adjustment. This different pattern may be explained by insufficient sample sizes in these 3 datasets or the fact that nongenetic factors may be very different in the corresponding study populations.
Studying multiple (heterogeneous) populations and integrating the results could provide more generalizable heritability estimates and build the upper and lower bounds of heritability with using both unrelated and related individuals. However, in general this is a more challenging task, and particularly, the population heterogeneity needs to be carefully addressed when we seek for similar patterns across studies. For example, the UK biobank are primarily middle/elderly ages (mean age 64), whereas the PNC and PING cohorts are primarily adolescents (mean age 21 and 12 years old, respectively). Very different processes may play during these different age periods, and thus adjusting age separately in each dataset may be insufficient for accounting for such heterogeneity.
Funding
National Institutes of Health (MH086633 and MH092335), the National Science Foundation (SES-1357666 and DMS-1407655), a grant from the Cancer Prevention Research Institute of Texas, and the endowed Bao-Shan Jing Professorship in Diagnostic Imaging.
Notes
We would like to thank Shelli R. Kesler for helpful discussion. We thank the UK Biobank, ADNI, PING, and PNC participants for their participation and the research teams for their work in collecting, processing and disseminating these datasets for analysis. This research has been conducted using the UK Biobank Resource (application number 22783), subject to a data transfer agreement. Part of data collection and sharing for this project was funded by the Alzheimer’s Disease Neuroimaging initiative (ADNI) (National Institutes of Health Grant U01 AG024904) and DOD ADNI (Department of Defense award number W81XWH-12-2-0012). ADNI is funded by the National Institute on Aging, the National Institute of Biomedical Imaging and Bioengineering and through generous contributions from the following: Alzheimer’s Association; Alzheimer’s Drug Discovery Foundation; Araclon Biotech; BioClinica, Inc.; Biogen Idec Inc.; Bristol-Myers Squibb Company; Eisai Inc.; Elan Pharmaceuticals, Inc.; Eli Lilly and Company; EuroImmun; F. Hoffmann-La Roche Ltd and its affiliated company Genentech, Inc.; Fujirebio; GE Healthcare; IXICO Ltd; Janssen Alzheimer Immunotherapy Research & Development, LLC; Johnson & Johnson Pharmaceutical Research & Development LLC; Medpace, Inc.; Merck & Co., Inc.; Meso Scale Diagnostics, LLC; NeuroRx Research; Neurotrack Technologies; Novartis Pharmaceuticals Corporation; Pfizer Inc.; Piramal Imaging; Servier; Synarc Inc.; and Takeda Pharmaceutical Company. The Canadian Institutes of Health Research is providing funds to support ADNI clinical sites in Canada. Private sector contributions are facilitated by the Foundation for the National Institutes of Health (www.fnih.org). The grantee organization is the Northern California Institute for Research and Education, and the study is coordinated by the Alzheimer’s Disease Cooperative Study at the University of California, San Diego. ADNI data are disseminated by the Laboratory for NeuroImaging at the University of Southern California. Part of data collection and sharing for this project was funded by the Pediatric Imaging, Neurocognition and Genetics Study (PING) (National Institutes of Health Grant RC2DA029475). PING is funded by the National Institute on Drug Abuse and the Eunice Kennedy Shriver National Institute of Child Health & Human Development. PING data are disseminated by the PING Coordinating Center at the Center for Human Development, University of California, San Diego. Support for the collection of the PNC datasets was provided by grant RC2MH089983 awarded to Raquel Gur and RC2MH089924 awarded to Hakon Hakonarson. All PNC subjects were recruited through the Center for Applied Genomics at The Children’s Hospital in Philadelphia. List of Alzheimer’s Disease Neuroimaging Initiative (ADNI) and Pediatric Imaging, Neurocognition and Genetics (PING) authors provided in the Supplemental Materials. Conflict of Interest: The authors declare no competing financial interests.