


Abstract
This study aims at understanding complex interactions between cortical neurons, glia and blood supply developing during the transition from slow-wave sleep to wakefulness. In spite of essential advances from in vitro and culture preparations, the basic mechanisms of glial interactions with their cellular and ionic environment had remained uninvestigated in vivo. Here we approach this issue by performing simultaneous intracellular recordings of cortical neurons and glia, together with measurements of cerebral blood flow (CBF), extracellular K+ concentrations and local field potentials in both anesthetized (ketamine–xylazine) and naturally behaving cats. Under anesthesia, cortical activation was elicited with electric stimulation of cholinergic nuclei (pedunculopontine tegmental in the brainstem and/or nucleus basalis in the basal forebrain). Iontophoretic application of acetylcholine on the recorded cells was also used. In the vast majority of cases (>80%) glial cells were hyperpolarized during electric stimulation or spontaneous activation. This result was also obtained in all cases where iontophoresis was used or when glutamatergic kainate/quisqualate receptors were blocked with 6-cyano-7-nitroquinoxaline-2,3-dione. The glial hyperpolarization was associated with steady neuronal depolarization, increased CBF, lower extracellular K+ concentration, increased membrane resistance, decreased membrane capacitance and persistent positive DC field potentials. In some cases of cortical activation (<20%), glial cells displayed sustained depolarizing potentials, in parallel with neuronal depolarization, decreased CBF and more negative DC field potentials. The above-mentioned effects of cholinergic activation were blocked by the muscarinic antagonist scopolamine. We propose that the glial response to cholinergic activation results from the balance between the direct hyperpolarizing action of acetylcholine and the depolarizing modulation of glutamate from the neighboring neurons, in addition to the modulation of the interglial communication pathway and/or the ionic traffic across blood vessels.
Introduction
By showing the effects of stimulating the reticular formation of the brainstem on the electroencephalogram (EEG), Moruzzi and Magoun (1949) have demonstrated that this structure is critically involved in the modulation of vigilance. Previous studies (reviewed in Steriade and McCarley, 1990; Wainer and Mesulam, 1990) suggest that cholinergic modulatory systems play an essential role during the transition from slow-wave sleep (SWS) to wakefulness (W). During SWS and under anesthesia, the EEG is characterized by large amplitude slow waves. These oscillations coincide with alternating periods of depolarization and hyperpolarization of both neurons (Steriade et al., 1993b) and glia (Amzica and Neckelmann, 1999), in parallel with increases and decreases in the extracellular K+ concentration ([K+]o) (Amzica et al., 2002). Upon awakening, the slow EEG and neuronal activities are abolished and neurons display fast oscillations around a depolarized membrane potential (Vm) (Steriade et al., 1993a). Previous studies have emphasized the role of glial cells in regulating [K+]o (Orkand et al., 1966; Somjen, 1979; see also Newman, 1995). However, no information is available concerning the behavior of glial cells, [K+]o and its regulation during the transition from SWS to W.
This study becomes even more necessary as the exclusive focus on neuronal discharges in understanding conscious phenomena and principles of information processing is not sufficient. Recent reports brought into attention reciprocal neurotransmitter-based exchanges between neurons and glia (Bezzi and Volterra, 2001). This adds to the already known functions of glial cells in regulating extracellular environment, removal of neurotransmitters, as well as development and regeneration. It has been known for some time that glial cells possess receptors for acetylcholine (ACh) (Van Der Zee et al., 1993). In addition, gap junctions within glial networks enable the propagation of molecules and ions between cells (see Ransom, 1995).
The effect of ACh on cortical neurons has been studied extensively. ACh depolarizes neurons and increases their membrane resistance (Krnjević et al., 1971; Krnjević and Reinhardt, 1979). Glial cells were studied mostly in slices and cultures. It was shown that addition of ACh on astrocytes from explant cultures of rat brainstem and spinal cord elicited membrane hyperpolarization (Hösli et al., 1988; Hösli and Hösli, 1993). In hippocampal slices, glial cells responded to cholinergic stimulation with an intracellular Ca2+ elevation mobilized from the internal stores (Araque et al., 2002). As intraglial Ca2+ changes may further cause neurotransmitters release (Parpura et al., 1994; Pasti et al., 1997; Bezzi et al., 1998; Araque et al., 2000), it is essential to disclose the behavior of cortical glial cells during behavioral activation.
Although studies performed in slices or cultures have been essential in unveiling glial functions, they cannot recreate the vast network of an intact brain in which glia and neurons interact spontaneously during various vigilance states. To overcome these limitations, our experiments were performed in vivo. The activation of the cortex was achieved by electric stimulation of cholinergic nuclei located either in the basal forebrain (BF) or in the brainstem [pedunculopontine tegmental (PPT) nucleus], but also by spontaneous transitions between SWS and W in chronically implanted animals. We aimed at a farther-reaching view by investigating the behavior of glia, blood supply and extracellular space composition during the activated states and in relation with the already known pattern of sleep.
Materials and Methods
Animal Preparation
Experiments were performed on both acute and chronic animals. Acute experiments were carried out on 36 adult cats of both sexes, deeply anesthetized with ketamine and xylazine (10–15 and 2–3 mg/kg i.m., respectively). The depth of anesthesia was continuously monitored by the electroencephalogram (EEG) and heart rate, and end-tidal CO2 concentration was kept between 3.5 and 3.7%. Additional doses of anesthetic were given at the slightest tendency toward an activated EEG pattern or accelerated pulse (>110 beats/min). Body temperature was maintained between 37 and 39°C with a heating pad. In a series of experiments (n = 4), isoflurane 1% was applied additionally to the existing anesthesia in order to block gap junction communication (Mantz et al., 1993). Animal preparation consisted of cephalic vein canulation for systemic liquid delivery, lidocaine infiltration of all pressure points or incision lines, muscle paralysis with gallamine triethiodide and tracheal cannulation. Cats were artificially ventilated throughout all experiments. Craniotomy exposed the cerebral cortex (suprasylvian gyrus) for insertion of intracellular, extracellular and K+-sensitive micropipettes, and of cerebral blood flow (CBF) probes. In this preparation, the stability of intracellular recordings was enhanced by cisternal drainage, hip suspension, pneumothorax and filling of the hole in the calvarium with a 4% agar solution. Glucose (5% solution, 10 ml i.v.) was given every 3–4 h during experiments.
Chronically implanted cats (n = 2) were used to validate the data from anesthetized preparations. Surgical procedures are detailed elsewhere (Steriade and Amzica, 1996). Briefly, the implantation of electrodes for cardinal signs distinguishing natural wake and sleep states [EEG, electromyogram (EMG) and electrooculogram (EOG)] was performed under ketamine (15 mg/kg i.m.) followed by barbiturate anesthesia (25 mg/kg i.p.). Atropine sulphate (0.05 mg/kg i.m.) was injected to prevent parasympathetic reactions. A craniotomy with incision of the dura mater was equally performed and covered with a plastic cap. Buprenorphine (0.03 mg/kg i.m.) was given every 12 h for 24 h, to prevent pain after surgery. An antibiotic (bicillin) was administered i.m. for 3 days following surgery. Intracellular and EEG recordings began seven days after surgery. During sessions, the plastic cap above the craniotomy was removed, intracellular pipettes were lowered into the cortex and the agar pressure foot was renewed. Animals were not deprived of sleep. The method used to keep the head rigid without pain or pressure during the recording sessions was similar to that previously described (Glenn and Steriade, 1982). During recording, the animal could move its limbs and make postural adjustments.
At the end of the experiments, the animals received a lethal i.v. dose of sodium pentobarbital (50 mg/kg). All experimental procedures were performed in accordance with the NIH guiding principles and were also approved by the committee for animal care of Laval University.
Electrodes and Recording
Intracellular Recordings
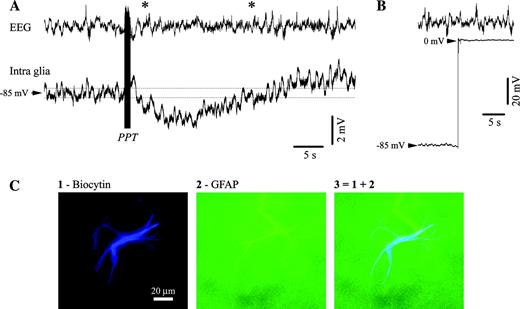
Intracellular recordings from neurons and glia in the cerebral cortex (suprasylvian areas 5 and 7) were obtained with glass micropipettes (tip diameter <0.5 μm) filled with potassium acetate (3 M, in situ resistance 35–50 MΩ). In the case of neuronal impalements, only stable recordings with resting membrane potentials (Vm) more negative than −60 mV, overshooting action potentials and input resistances >20 MΩ were accepted for analysis. Intraglial recordings were considered only if displaying a Vm more negative than −70 mV upon impalement, stable and without current compensation during the whole recording. No action potentials were fired at impalement, exit or by imposing intracellular depolarizing currents that would bring the Vm close to −55 mV. Both upon impalement of (not shown) and leaving (Fig. 1B) the glia, a brisk voltage shift, with no action potential discharge, was recorded.
Hyperpolarizing responses in astrocytes after PPT activation. (A) Intraglial (microelectrode filled with biocytin) and EEG recording from a cat under ketamine–xylazine anesthesia. The intracellular recording was performed in area 5 and the EEG electrode (screw in the bone) was placed just anterior to the intracellular pipette. The stimulation of the PPT nucleus (100 stimuli at 100 Hz) elicited a prolonged hyperpolarization. (B) At the end of the recording, the intracellular electrode was withdrawn from the glia for verification of the real Vm. (C) Anatomical verification of the glia recorded in (A) and (B). Panel 1 displays the shape of an astrocyte, panel 2 the same cell verified for reactivity to GFAP and panel 3 contains the superimposition of the previous two panels. In this and all subsequent figures potentials are presented with positivity upwards.
The membrane resistance and capacitance were tested in both neurons and glia during the activation of the EEG by means of intracellularly delivered hyperpolarizing current pulses (50–80 ms duration, 0.5–1 nA intensity). The resistance (R) was calculated as the ratio between the voltage deflection (average of at least 10 ms during the plateau response) and the injected current eliciting that voltage response. The membrane capacitance (C) was obtained from the time constant (τ) of the active response to the current pulses (τ = RC). The time constant was estimated with a double exponential fit (for details, see Amzica and Neckelmann, 1999) and was in agreement with previous reports (Trachtenberg and Pollen, 1970).
Neuroanatomy
On some occasions, in order to visualize the impaled cells, intraglial recordings were performed with pipettes containing 2% biocytin in the 3 M potassium acetate solution (in situ resistance 60–100 MΩ). The cell was filled with biocytin by injecting positive current pulses (200 ms, 50% duty cycle) of 0.5–1 nA for at least 10 min. At the end of these experiments, animals were perfused with phosphate-buffered saline (PBS) followed by a fixative containing 4% paraformaldehyde and 1% glutaraldehyde in PBS (0.1 M, pH 7.4). Brains were cryoprotected with 30% sucrose in paraformaldehyde 4%. Then, 50 μm coronal sections were cut and processed for fluorescent microscopy. The brain slices were washed in PB 0.1 M and in tris-buffer saline (TBS) 0.05 M, treated with Triton X-100 and incubated with the probes. Finally, cells filled with biocytin were probed with Streptavidin Marina Blue® conjugate (Molecular Probes; absorption, 365 nm; emission, 460 nm) and observed under a fluorescent microscope with blue filter. The cells were also probed with primary antibodies to neurofilament and glial fibrillary acid protein (GFAP; Molecular Probes) and subsequently visualized with green fluorescent Alexa Fluor 488 goat anti-mouse IgG (Molecular Probes; absorption, 495 nm; emission, 495 nm). An example of impaled, filled and double-labeled astrocyte is given in Figure 1C.
Stimulation Procedures
Stimulation for EEG activation was achieved with bipolar electrodes placed either in the PPT (stereotaxical coordinates A0, L2–4, H-2.5) or in the BF (A15, L3–5, H-2). Usually, 1–3 trains of 70 stimuli at 100 Hz were sufficient to elicit a short-lasting (a few seconds) EEG activation. Direct stimulation of cholinergic receptors was also obtained through iontophoretic microinjections of ACh (current pulses of 0.1 mA). For that, composed multibarrel electrodes of the type depicted in Figure 5A were built. One barrel was used for the intracellular recording, another one contained ACh (1 M, pH 4) (Krnjević and Schwartz, 1967; Godfraind et al., 1971) and the third barrel was filled with NaCl (3 M, pH 4). The latter served as a blank electrode during current injection in the ACh barrel, as a source of control (vehicle) injection to discard the eventuality of an acidic reaction during the iontophoresis of ACh (Metherate et al., 1988) and as a DC field potential electrode close to the impaled cell.
Extracellular Recordings
Extracellular K+ concentrations ([K]o) were measured with K+-sensitive electrodes built as described previously (Amzica et al., 2002). Briefly, we used double-barrel pipettes in which the K+-sensitive barrel was pretreated with dimethylchlorosilane and dried at 120°C for 2 h, and the tip filled with the K+ ionophore I-cocktail A (Fluka). The rest of the K+-sensitive barrel was filled with KCl (0.2 M), while the other barrel was filled with NaCl (2 M). The K+ electrode was calibrated in artificial CSF solutions containing: 126 mM NaCl, 2.3 mM KCl, 26 mM NaHCO3, 1.3 mM MgSO4, 2.4 mM CaCl2, 1.2 mM KH2PO4, 15 mM glucose, 5 mM HEPES, 0.4 mM thiourea and 3% dextran 70.000, pH 7.3. The K+ concentration of the solution was adjusted between 1 and 25 mM by substituting the NaCl with KCl. The relationship between concentration and voltage was derived in accordance with the Nicolsky–Eisenmann equation (Ammann, 1986). We used only K+-sensitive electrodes with sensitivity within the prevailing range (1–6 mM) better than 10 mV/mM.
Additional EEG electrodes (silver screws) fixed in the bone and low resistance (5–10 MΩ) glass pipettes placed in the cortex were used for monitoring of the EEG (AC recordings) and intracortical field potentials (DC recordings), respectively. All intracortical electrodes were kept as much as possible very close one to another and at the same cortical depth with at least one of the impaled cells. The reference electrode (Ag/AgCl) was placed in the temporal muscles of the paralyzed animal. The intracellular signals were passed through a high-impedance amplifier with an active bridge circuitry (bandwidth DC to 9 kHz; Neurodata) and, together with the rest of the signals, were digitized (20 kHz sampling rate) and stored for off-line analysis.
Glutamatergic AMPA/kainite receptors were blocked with a superfusion of 6-cyano-7-nitroquinoxaline-2,3-dione (CNQX, 1 mM). The solution was delivered on a round filter paper placed over the cortical recording site (see Fig. 9A). Muscarinic receptors were blocked with scopolamine (0.5 mg/kg), while nicotinic receptors were blocked with mecamylamine (30 μg/kg), both injected i.v. Unless specifically mentioned, all chemicals were acquired from Sigma.
The CBF was measured by use of a laser Doppler flowmeter (Moor Instruments, USA). The probe was kept at the cortical surface close (1–2 mm) to the intracellular electrodes. A pulsatile signal indicated that the probe was sampling tissue flow. Because the device provides a relative, not absolute, measure of flow, CBF values were calculated as a percentage of the average values during a baseline period of at least 2 min.
Results
Database
A total of 131 neurons and 360 glial cells were retained for the present study. Of these, 81 were simultaneously recorded couples (52 neuron–glia couples, 10 neuron couples and 19 glia couples). All impaled neurons were tested with depolarizing pulses in order to elicit patterns of action potential discharges. No neurons with short action potentials and high frequency firing were recorded. Most of the neurons (83%) displayed regular, slow or fast adapting discharges. The rest of the neurons discharged in bursts. Based on this electrophysiological criterion (Connors et al., 1982; Nuñez et al., 1993), we assumed that all of them were excitatory neurons.
Activation Patterns in Glia
At the EEG level, electric stimulation of the PPT nucleus abolished the slow (<1 Hz) and ample oscillations that were typical for the anesthesia used here, and replaced them with an activated EEG pattern (between asterisks in Fig. 1A) characterized by faster and smaller waves. This behavior was in agreement with previous reports (Moruzzi and Magoun, 1949; Steriade et al., 1993a). The stimulation of the upper brainstem reticular core is expected to produce, among other effects, an increase in the cortical ACh release (Celesia and Jasper, 1966; Szerb, 1967). The vast majority of glial cells under PPT stimulation (158 out of 183, i.e. 86%) displayed a sustained hyperpolarization in parallel with the associated EEG activation (Fig. 1A). In all these cases, the glial Vm reached a level either more hyperpolarized than the inferior limit of control levels (average Vm minus the SD, both calculated over a period equal to the duration of the subsequent activation; lower dotted line in Fig. 1A), or within the limits of the hyperpolarizing state of the slow oscillation. In average, the hyperpolarization reached 3.6 ± 0.9 mV (average ± SD; n = 158). This persistent hyperpolarization could be occasionally preceded by a transient depolarization during and immediately after the stimulation. In the remaining 14% cases, a sustained depolarization of the glial cells was noticed (see examples in Figs 4 and 10B).
The stimulation of the BF led to similar results: 84% of the glial cells (112 out of 133) hyperpolarized, while 16% depolarized. The average hyperpolarization was 3.2 ± 0.7 mV, but no significant difference was noted with respect to the one elicited by PPT stimulation (paired t-test, P < 0.05). This suggests that similar effects were induced by PPT and BF stimulation. No voltage dependence of the activating response could be established. In individual glial cells, the hyperpolarizing deflection after the activating stimulation was not necessarily larger in cells displaying a more depolarizing resting Vm. The lack of voltage dependency indicates that the glial hyperpolarization might be due, besides the modulation of a transmembrane conductance, to other extraglial mechanisms (see Discussion).
Among glial cells responding to EEG activation with a sustained hyperpolarization, all cells that were filled with biocytin (n = 12) proved to be astrocytes (Fig. 1C). The cortical depth distribution of the activation pattern of impaled glia did not show any particular preference for a given cortical layer.
The prevalent hyperpolarization of glial cells by EEG activation under anesthesia was confirmed by intraglial recordings in naturally behaving animals with spontaneous sleep-waking cycles (Fig. 2A–C). Glial cells recorded during the transition from slow-wave sleep (SWS) to wakefulness (W) (n = 5) displayed a transient short-lasting depolarization, followed by a persistent hyperpolarization. When tested (n = 3), the input resistance of glia displayed increased (by ∼30%) values during wakefulness (W trace in Fig. 2C2) with respect to slow-wave sleep values (SWS trace).
![Glial hyperpolarization in chronically implanted animals during natural transitions between slow-wave sleep (SWS) and wakefulness (W). (A) Intraglial, AC field potential, electrooculogram (EOG) and electromyogram (EMG) during spontaneous activation. Awakening is marked by suppression of ample slow waves, eye opening (two deflections) and increased EMG amplitude. In parallel, the intracellular recording displays a sustained hyperpolarization. (B) Average Vms before (black) and after (gray) EEG activation. Separate analyses for chronic and acute preparations. Results from acute preparations are separated according to whether activation produced glial hyperpolarization (H) or depolarization (D). (C) Another intraglial recording during transition from sleep to wakefulness (1) and average resistance test (2, n = 10). (D1) Simultaneous recording of a glia and of the extracellular K+ concentration ([K+]o) during a brief period of spontaneous activation (between asterisks). The glial Vm is shown referenced to the muscle electrode (black trace) and rereferenced to the extracellular field potential electrode (gray trace). Note simultaneous glial hyperpolarization and [K+]o decrease. At the same time, the DC field potential measured at close distance evolves toward a positive value. (D2) Cross-correlations between intraglial potentials and [K+]o performed over two 30 s periods during SWS (continuous line) and W (broken line).](https://oup.silverchair-cdn.com/oup/backfile/Content_public/Journal/cercor/16/5/10.1093/cercor/bhj011/2/m_cercorbhj011f02_ht.jpeg?Expires=1716459584&Signature=0a91wLG6fqfOlfZXZS4fDEdSxSAbITEPT6RCl8UCLhfj593jtWmRn9LjMYWZhQZbnH5FMOIzjC3tRA9Axz8GPJfKxFoZr4aXof7lMnG-QGuQAchvbexxSXmQkNfKOwbEp4ge1eiRF8lku0X~l0-Tp3MT5IYkK05vBXmE5CZWjvr2nV7l6tA3t-R2bJex94QC2e5SAKo3UTw4xd7LveUTqWkJGIi1J5eibfooSSK~KfFSA-d8lDOG~9EN7vq46V0Wcv~6OHqkJFJtg6-9Szie~PsnjWhjgCH4f2YYPSFbsycfkcj7YcBOSwMxwbaCjAgdx6ZA6VlFuN7fLheOeozYjw__&Key-Pair-Id=APKAIE5G5CRDK6RD3PGA)
Glial hyperpolarization in chronically implanted animals during natural transitions between slow-wave sleep (SWS) and wakefulness (W). (A) Intraglial, AC field potential, electrooculogram (EOG) and electromyogram (EMG) during spontaneous activation. Awakening is marked by suppression of ample slow waves, eye opening (two deflections) and increased EMG amplitude. In parallel, the intracellular recording displays a sustained hyperpolarization. (B) Average Vms before (black) and after (gray) EEG activation. Separate analyses for chronic and acute preparations. Results from acute preparations are separated according to whether activation produced glial hyperpolarization (H) or depolarization (D). (C) Another intraglial recording during transition from sleep to wakefulness (1) and average resistance test (2, n = 10). (D1) Simultaneous recording of a glia and of the extracellular K+ concentration ([K+]o) during a brief period of spontaneous activation (between asterisks). The glial Vm is shown referenced to the muscle electrode (black trace) and rereferenced to the extracellular field potential electrode (gray trace). Note simultaneous glial hyperpolarization and [K+]o decrease. At the same time, the DC field potential measured at close distance evolves toward a positive value. (D2) Cross-correlations between intraglial potentials and [K+]o performed over two 30 s periods during SWS (continuous line) and W (broken line).
In both chronic and acute preparations the glial hyperpolarization was paralleled by a simultaneous drop in the overall [K+]o (Fig. 2D). The sleep-like pattern, dominated by a slow (<1 Hz) oscillation, produced coherent and in-phase oscillations of the [K+]o and glial Vm (cross-correlation in Fig. 2D2, continuous line) with an amplitude of ∼0.5–1 mM, as previously reported (Amzica et al., 2002). The activation produced an equivalent drop of the [K+]o: if the glial hyperpolarization attained the potentials reached during the ‘down’ phase of the slow oscillation, then the K+ values fell to the lower levels recorded during the slow oscillation. The cross-correlation between K+ and glial Vm (broken line in Fig. 2D2) failed to show in the short term consistent patterns of synchrony, probably due to the diminished coherence of cortical activities during activated states.
At the same time, in all cases associated with glial hyperpolarization during the activated period, the non-filtered (DC) intracortical field potentials maintained a positive potential. Thus, during the slow sleep oscillations, the extreme values of the glial Vm and [K+]o were in-phase, and both were in phase opposition with the polarity of the DC field potential (see also fig. 3 in Amzica et al., 2002). Moreover, this relationship was kept during activation, raising the issue of the neuronal contribution to the genesis of the local field potential.
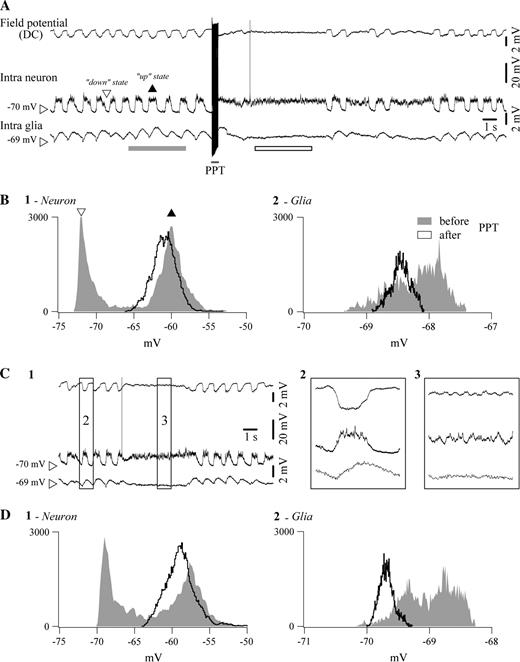
Comparison between electrically elicited and spontaneously occurring activation in a pair of simultaneously impaled neuron and glia in a cat under ketamine–xylazine anesthesia. (A) Sequence of slow (<1 Hz) oscillation, PPT activation and return to slow oscillation. Depolarizing phases of the slow oscillation are indicated with a black arrowhead (up state), while hyperpolarizing phases are marked with an empty arrowhead (down state). After activation, the sustained neuronal depolarization is accompanied by glial hyperpolarization and the DC field potential assumes rather positive values. (B) Histograms of neuronal (panel 1) and glial (panel 2) Vm during the slow oscillation (in gray) and during activation (black trace). Histograms were calculated over the respective underlined epochs in (A). They illustrate the incidence of different values of Vm, sampled at 20 kHz, over periods indicated by the bar below the traces. Note the bimodal histograms during sleep (up states correspond to the black arrowhead, down states to the empty arrowhead) and the unimodal histogram after activation, as well as the opposite evolution of glial and neuronal Vm (glia hyperpolarizes, neuron depolarizes). C1, Similar pattern of activity in the same double intracellular recording during a period of spontaneous activation of the EEG. Periods within squares are expanded at right (panels 2 and 3). D, Histograms from equivalent time periods before and after activation.
Glia–Neuron Relationship during EEG Activation
Neuron–glia couples provided a consistent pattern during both activation elicited by PPT stimulation (Fig. 3A) and spontaneous short-lasting activation (Fig. 3C): the neuronal Vm depolarized to the level of the sleep ‘up state’ (Fig. 3, panels B1 and D1, respectively), while the glial Vm hyperpolarized to the level of its sleep ‘down state’ (Fig. 3, panels B2 and D2, respectively). This evolution was consistently associated with a DC field potential that, during activation, kept with its previous sleep ‘down state’ level (see Fig. 3A for stimulation; Fig. 3B for spontaneous activation).
The statistical analysis of this behavior relied on the peaks of Vm histograms (e.g. Fig. 3B1 and 2). No significant difference was observed between the ‘up state’ Vm and the peak of the activated Vm in neurons (average difference −0.8 ± 0.1 mV, paired t-test P < 0.05). The same comparison indicated a statistically significant hyperpolarization of glia by −0.3 ± 0.1 mV (P < 0.05; n = 27) with respect to its control ‘up state’. The statistical analyses emphasize two different points: first, the comparison between neuronal Vm during up states of the slow oscillation and the steady depolarization during activation yields to comparable results, probably due to the fact that during the latter state neurons are sometimes slightly more depolarized and sometimes slightly more hyperpolarized than during the former state (thus lack of significance). The second set of analyses compares the peak of glial depolarization during slow sleep oscillations with the steady hyperpolarized level reached during EEG activation, this time with statistical significance due to the fact that this hyperpolarization was present during the vast majority (>80%) of cases.
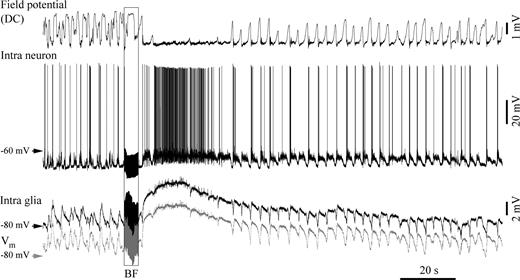
In those cases where glial depolarization was elicited (25 glia with PPT stimulation and 21 glia with BF stimulation), the accompanying neuron displayed an overt depolarization with increased firing rate (Fig. 4). This behavior was consistently accompanied by a DC field potential reaching its previous sleep ‘up state’, which corresponds to a negative field deflection. Thus, when both neurons and glia were depolarized by activating stimuli, negative intracortical DC field potentials reflected an excited network, while when glial cells were hyperpolarized by the same stimuli (Fig. 3), the associated positive DC field potentials displayed the pattern of a ‘silent’ network although neurons were in a depolarized state.
Double intracellular recording (neuron–glia pair) in the suprasylvian gyrus displaying glial depolarization during BF-elicited activation. The gray trace represents the glial membrane potential after subtraction of the DC field potential. In this case, the glial depolarization is associated with a neuronal depolarization, as reflected by the increased discharge of action potentials. During such activations, DC field potentials assumed sustained negative values.
At this stage, it is difficult to decide whether the effects observed in glial cells are due to direct actions of ACh on them or whether they reflect indirect actions through neurons. Indeed, our electrical stimulation activates a heterogeneous population of axons, some of them certainly containing ACh, others projecting to cholinergic structures and further releasing ACh in the cortex. ACh may thus activate neurons that could release glutamate or GABA on neighboring glia, raising the critical issue of the cholinergic influence on each category of cells (neurons and glia), but even more so on the reciprocal actions, non-cholinergic this time, between neurons and glia. Although this issue is extremely difficult to be dealt with in vivo, we attempted at intervening with locally delivered agents.
Iontophoretic Application of ACh on Glia
A first step in establishing the direct action of ACh on glial cells relied on iontophoretic application of ACh on glial cells. In all recorded glial cells (n = 12) this maneuver induced a persistent hyperpolarization (Fig. 5). The average hyperpolarization attained 9.6 ± 2.4 mV. Given the proximity between the tip of the electrode that impaled the glia and the iontophoretic barrel (<10 μm, Fig. 5A) it can be assumed that most of the ejected ACh was effectively poured over the recorded glia. However, we cannot completely rule out the surrounding excitation from neurons directly stimulated by ACh, which is expected to depolarize glial cells through glutamate release and/or K+ release by the excited neurons. In such a case, the measured hyperpolarization should represent an underestimate of the actual induced hyperpolarization.
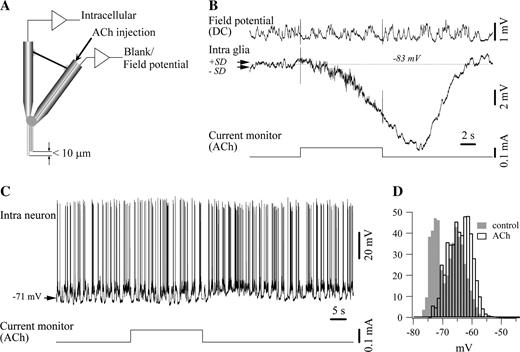
Iontophoretic application of ACh induced glial hyperpolarization. (A) Scheme of the iontophoretic electrodes used in this study. They resulted from attaching together two microelectrodes: the vertical one, serving for intracellular impalements, and the bent one, a double barrel pipette containing ACh in one barrel and NaCl in the other one. The tip of the iontophoretic barrels of the compound electrode, assembled under a microscope, was ∼10 μm above the intracellular recording tip. (B) Effect of iontophoretic application of ACh on glia. The current monitor below the traces indicates the intensity (0.1 mA) and duration of ACh ejection. The dotted lines indicate the average control Vm, and the two arrows the limits of the SD. The field potential was not affected by the iontophoretic injection, suggesting that the cholinergic effect did not activate many cells. (C) Similar iontophoretic application of ACh (0.1 mA injection current) on neurons induced depolarization. (D) Vm histogram calculated over equal periods of time before (in gray) and after (white bars) the application of ACh. Note the clear depolarization as well as the suppression of the bimodal, oscillatory pattern after ACh iontophoresis.
Indeed, similar iontophoretic applications of ACh on neurons (n = 7) disclosed a modest depolarization accompanied by a discrete resistance increase (Fig. 5C,D), in agreement with previous reports (Krnjević et al., 1971). In our preparations the average neuronal depolarization, calculated between the Vm histograms peaks of the depolarizing phase of the slow oscillation, was 2.4 ± 0.7 mV (range 1–5 mV). The resistance increase was of 0.76 ± 0.2 MΩ.
Input Resistance and Membrane Capacitance of Glia during EEG Activation
Among glial cells responding to activation with a Vm hyperpolarization, 87 were tested with hyperpolarizing pulses (intensity 0.5–1 nA) in order to investigate the input resistance and capacitance of the glial membrane before and during the EEG activation. In all cases, a consistent pattern of increased resistance and diminished membrane capacitance was recorded (Fig. 6). The control average membrane resistance of glial cells was 9.7 ± 1.2 MΩ (range 8–12 MΩ), while their control average membrane capacitance was 12.6 ± 2.3 pF (range 7–16 pF). These capacitance values are consistent with previously reported ones (Amzica and Neckelmann, 1999) and are slightly smaller than those originally published by Trachtenberg and Pollen (1970). This difference might be attributable to the use of different anesthetics (ketamine–xylazine versus pentobarbital).
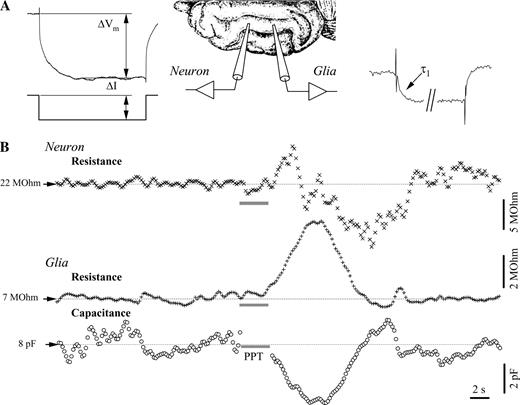
Membrane resistance and capacitance during PPT activation in a simultaneously impaled neuron–glia pair. (A) Measurement principle: hyperpolarizing pulses of fixed intensity (ΔI) were delivered at high rate (5 Hz) in both cells. The voltage deflection after the reaching of the plateau (ΔVm) served to the calculation of both resistances. Additionally, the charging curve of the glial response produced the time constant of the glia membrane (τ1) and, further, the glial membrane capacitance. (B) Dynamic evolution of the neuronal membrane resistance and of the glial membrane resistance and capacitance. The point of stimulation of the PPT is shown by the horizontal gray bar. Note the increase–decrease sequence in the neuronal resistance recording and the increased membrane resistance in glia, in parallel with decreased capacitance.
Stimulation of either PPT or BF nuclei induced in these glial cells, in parallel with the Vm hyperpolarization, an increased membrane resistance of 44 ± 8.3% (range 32–60%) and a simultaneous drop in membrane capacitance of 39 ± 10.2% (range 22–56%). These variation values were calculated as post-stimulus peak versus control average.
The neuronal membrane consistently showed an average increased membrane resistance of 21 ± 2.7%, as compared with a control resistance of 26 ± 3.4 MΩ. Occasionally, superimposed over this response, a delayed drop in membrane resistance could be measured (see neuronal membrane resistance in Fig. 6B). The latter could be attributable to the activation of neighboring neurons that would activate their glutamatergic and/or GABAergic synapses toward the recorded neuron. The estimation of the neuronal capacitance did not produce reliable results: generally, the variations measured after activation were in the range of control variations (not shown), and control variations were often subject to ample voltage shifts that are common during the slow cortical oscillation (see similar results in Amzica and Neckelmann, 1999).
The capacitance variations recorded in glial cells consecutive to cholinergic activation might reflect volume changes due to osmotic gradients and/or modifications of the gap junction permeability within the glial syncytium. Blockage of gap junctions by means of isoflurane led to no change in the activating response of glial cells (Fig. 7). Both types of responses, hyperpolarizing (Fig. 7A1, n = 15) and depolarizing (Fig. 7B, n = 9) were preserved after 1% isoflurane application. The effect of this agent on the membrane properties was associated with an average 18% increase in resistance and an average 23% decreased capacitance (Fig. 7C). The latter modification matches a closure of gap junctions. The phasic decrease of capacitance after PPT activation under isoflurane did not reach significant differences (paired t-test, P < 0.05) with respect to control responses (Fig. 7A2), suggesting that most of the effect was due to cellular shrinkage consecutive to osmotic phenomena (see Discussion).
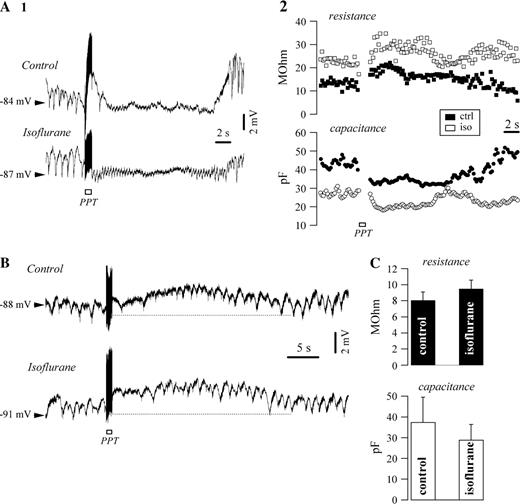
Effect of gap junction closure on glial response following PPT activation. Intracellular recording of glia before and after application of 1% isoflurane. (A) Hyperpolarizing responses was not affected by isoflurane application (panel 1), nor were the variations of membrane resistance and capacitance (panel 2). Note the overall increased membrane resistance and decreased capacitance as effects of isoflurane. (B) Case of a depolarizing activation in another intracellularly recorded glial cell that was not sensitive to isoflurane. (C) Overall effect of isoflurane on the glial membrane resistance and capacitance.
Muscarinic and Glutamatergic Components
All above-mentioned responses of glial cells to EEG activation were abolished by the muscarinic antagonist scopolamine given systemically (Fig. 8), but not by the nicotinic antagonist mecamylamine (30 μg/kg, not shown). Shortly (<5 min) after i.v. administration of scopolamine (0.5 mg/kg), the stimulation of cholinergic nuclei (28 cells tested with PPT stimulation and 31 cells tested with BF stimulation) failed to elicit any EEG activation, and the glial depolarization/hyperpolarization was absent (compare left and right panels in Fig. 8A). Similarly, the increased membrane resistance prior to scopolamine application was abolished by scopolamine (Fig. 8B). The same behavior in the case of neurons was reported in a previous study (Steriade et al., 1993a). It is therefore highly probable that the glial behavior described in the present paper is induced by the release of ACh. However, it is still not settled whether the recorded effect (hyperpolarization/depolarization) is exerted directly on glial cells or through the bias of neurons.
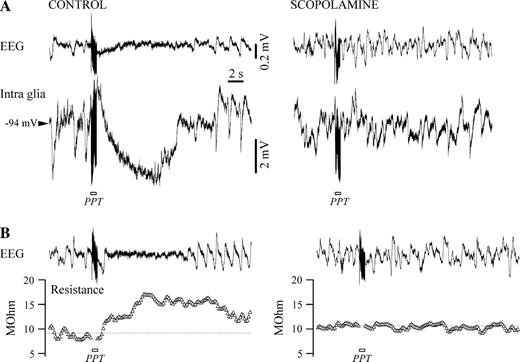
Muscarinic antagonist scopolamine abolishes Vm hyperpolarization and input resistance increase in glia. (A) Control recording in a glia before (left) and after (right) systemic application of scopolamine (0.5 mg/kg). The hyperpolarization elicited with PPT stimulation under control conditions disappears after blockage of muscarinic receptors. (B) Input resistance modification in the same glia in control conditions (left) is canceled after scopolamine application (right).
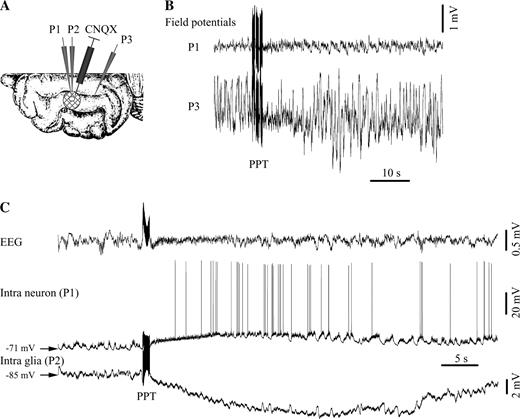
In order to further discriminate this issue, we performed intracellular recordings in neurons and glia of which glutamate receptors were blocked with CNQX (Fig. 9). This was achieved by superfusing a limited area of the suprasylvian gyrus covered with filter paper with a concentrated 1 mM solution containing CNQX (see scheme in Fig. 9A). Intra- and extracellular recordings were obtained both from beneath and outside the soaked area. Field potentials from the cortex with blocked glutamatergic receptors (P1 electrode in Fig. 9B) displayed activities of much lesser amplitude (at least 10 times) than the ones recorded at control sites (P3 electrode). This was taken as a sign that glutamatergic transmission was impaired beneath the filter paper soaked with CNQX. A similar test was performed in the depth of the cortex. As a rule, field potentials were almost flat at the surface of the cortex and had very low amplitudes up to a depth of 1–1.2 mm, regaining control amplitude at deeper locations.
Cholinergic effect after blockage of kainate/quisqualate glutamatergic receptors with CNQX. (A) Location of the recording electrodes in the suprasylvian gyrus. A round (∼4 mm diameter) filter paper patch was placed over the cortex and continuously perfused with CNQX from a Hamilton syringe. A hole in the patch allowed the insertion of two intracellular pipettes (P1 and P2). An extra DC field potential pipette (P3) was inserted at some distance (>10 mm) from the filter paper. (B) Reduced amplitude of the field potentials measured below the CNQX-soaked area (P1) with respect to the control microelectrode (P3). (C) PPT activation of a neuron–glia pair recorded in the CNQX-inactivated area. Note the depolarizing response in the neuron and the exclusive hyperpolarizing response in the glial cell.
EEG activation was still seen in the CNQX area (Fig. 9B). Before activation, the membrane potential of neurons recorded within the perfused cortical block (n = 15) still displayed synaptic activities reminiscent of the slow sleep oscillation, however, with diminished amplitude (Fig. 9C). Under normal conditions, the amplitude of the slow oscillation in cortical neurons ranged from 10 to 20 mV (average 14.3 ± 2.4 mV), while under CNQX it dropped to an average of 3.2 ± 0.6 mV. This partial survival might reflect a partial inactivation of glutamatergic receptors, due either to the fact that CNQX perfusion had only an incomplete effect, or to the activation of other than quisqualate/kainate receptors. Similarly, the slow oscillation in glial cells (n = 23) recorded under CNQX displayed depressed amplitude (in average from 1.3 to 0.2 mV).
The activation maneuvers produced in all neuron–glia paired recordings (n = 15) depolarization of the neurons and clear glial hyperpolarization (Fig. 9C). No depolarizing components could be detected in any of the glial recordings. Thus, in situations where glutamatergic transmission was impaired, the cholinergic effect was exclusively hyperpolarizing in all glial recordings.
Blood Flow Behavior during Activation
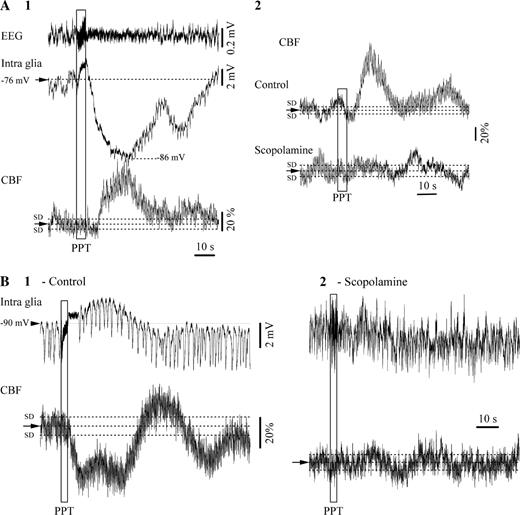
During all situations of glial cells being hyperpolarized during EEG activation, the simultaneously recorded CBF displayed an overall increase (Fig. 10A1). This increase reached in average a peak of 34 ± 7.2%, regardless whether it was elicited by BF or PPT stimulation. The effect of cholinergic activation on CBF was abolished by scopolamine (0.5 mg/kg i.v., Fig. 10A2). Interestingly, during recordings where glial cells were depolarized by the stimulation of cholinergic nuclei, the CBF was always decreased (Fig. 10B1). The average decrease was of 47 ± 6% at the peak of the CBF response. Again, this effect was canceled by the muscarinic antagonist scopolamine (Fig. 10B2). These results indicate an inverse relationship between the polarization of the glial membrane and the CBF during EEG activation.
Cerebral blood flow (CBF) in association with glial responses to PPT cerebral activation. (A1) Hyperpolarizing responses were always associated with transient increases of the CBF. (A2) These responses were abolished by the muscarinic antagonist scopolamine. (B1) Glial depolarization after PPT stimulation was always associated with decreased CBF, and this effect was antagonized by scopolamine (B2).
Discussion
In this study we have established the following experimental facts:Altogether, these findings suggest that the behavior of cortical structures during active states is the outcome of a complex interaction between networks of neurons, glia and blood vessels. The common link might well be of an ionic nature, with K+ playing a central role, but may also rely on neurotransmitters such as glutamate and/or GABA. The study of such interactions becomes strenuous even in more simple preparations, such as in vitro slices, because there are no clean methods to control the behavior of two of the three elements that form the functional structure of the nervous tissue. This is even truer for our in vivo preparation.
The majority of impaled cortical glial cells were hyperpolarized during states that are associated with a cholinergic activation.
The hyperpolarization of glial cells after cholinergic activation was associated with neuronal depolarization and increased CBF. Under these circumstances, the local depth field potential adopted a positive polarity.
Occasionally, glial cells were also depolarized during the cholinergic activation, in parallel with an overwhelming neuronal depolarization and decreased CBF. This was further reflected as sustained negative field potentials.
A large body of data suggests that the transition from slow-wave sleep to wakefulness depends, among others, on cholinergic modulatory systems (reviewed in Steriade and McCarley, 1990). Neurons releasing ACh and giving rise to ascending projections are located in two cellular aggregates PPT and laterodorsal tegmental (LDT) nuclei at the mesopontine junction and in the nucleus basalis (NB) of the BF. Whereas PPT/LDT ascending axons are overwhelmingly relayed by thalamocortical glutamatergic cells, NB provides the direct cholinergic innervation of the cerebral cortex (Steriade and McCarley, 1990). There is also a link between mesopontine tegmental neurons and a subpopulation of cholinergic cells in the NB and surrounding areas (Jones and Cuello, 1989; Semba, 1991). Neurons of the midbrain reticular formation increase their firing rate ∼15 s before the end of sleep epochs that develop into awakening and keep a higher discharge rate during wakefulness than during slow-wave sleep (Steriade et al., 1982). Increased amounts of ACh were found in the cortex during activation (Celesia and Jasper, 1966; Szerb, 1967).
These anatomo-physiological evidences set the base for the delivery of ACh in the cortex during activated states. There, ACh may influence directly the activity of neurons, glia and capillaries.
The net effect of ACh on neocortical neurons is a depolarization (Krnjević et al., 1971; Krnjević and Reinhardt, 1979) and a change in their Vm oscillations from slow (1–5 Hz) to fast (20–40 Hz) rhythms (Metherate et al., 1992). Stimulation of the PPT/LDT nuclei, as well as spontaneous short-lasting EEG activations under anesthesia, blocks the slow sleep oscillation (Steriade et al., 1993a). This effect is mainly achieved through the suppression of the periodic long-lasting hyperpolarizations. Thus, the neuronal Vm during the activated periods remained at least at the same level as the one recorded during the phasic steady depolarizations of the slow oscillation (Steriade et al., 1993a).
Glial cells possess receptors for a variety of transmitters (Murphy and Pearce, 1987; Porter and McCarthy, 1997) and they release neurotransmitters (Levi and Gallo, 1995). Among receptors, those for glutamate (non-NMDA) (Sontheimer et al., 1988; Monyer et al., 1991; Steinhäuser and Gallo, 1996), GABAA (Bormann and Kettenmann, 1988; MacVicar et al., 1989; Rosier et al., 1993) and ACh (muscarinic) in at least one-fifth of cortical astrocytes (Van Der Zee et al., 1993) are of particular interest in the present study. Glutamate, a ubiquitous transmitter in the central nervous system, depolarizes glia through receptors similar to the ones of the neurons (Bowman and Kimelberg, 1984; Kettenmann and Schachner, 1985), and direct chemical synapses between neurons and glia have been found (Bergles et al., 2000). In particular, the activation of metabotropic glutamate receptors has been shown to increase intraglial Ca2+ concentration and trigger propagating Ca2+ waves (Kim et al., 1994; Porter and McCarthy, 1995). The action of GABA on glia may open GABAA channels and induce membrane depolarization through exit of Cl− ions (Bowman and Kimelberg, 1984; Kettenmann and Schachner, 1985; Bormann and Kettenmann, 1988), or might act on GABAB receptors and further elevate intraglial Ca2+ (Kang et al., 1998). Both cases might account for the recorded glial depolarization, although they seem to be opposed by the increased membrane resistance observed during cholinergic activation.
Our study, especially when using iontophoretic application of ACh and blockage of glutamatergic receptors, emphasizes the hyperpolarizing response of glia during activation. This was in line with a previous in vitro study in which the application of ACh on astrocytes usually produced a long lasting hyperpolarization (Hösli et al., 1988; Hösli and Hösli, 1993). The direct effect of ACh on cortical glia is achieved on both protoplasmic and fibrous astrocytes mainly through muscarinic receptors (Van Der Zee et al., 1989). Scopolamine was indeed effective in blocking the cholinergic response in our glial cells (Fig. 8). Nicotinic receptors on astrocytes were also found in autoradiographic studies on explant cultures, although with lesser incidence than muscarinic receptors (Hösli et al., 1988), and are thus expected to play a negligible role (Walz, 1995). This was also the case of our recorded glial cells that did not show any sensitivity to the nicotinic antagonist mecamylamine.
We can therefore conclude that the cholinergic activation of the cortex has a twofold effect on glia: one direct and hyperpolarizing, through muscarinic receptors situated on the glial membrane, and the other indirect and depolarizing, through the activation of neurons that further release glutamate (in the case of excitatory neurons) on neighboring glia.
The excitation of surrounding neurons might also provoke release of K+ by these neurons that should equally have a depolarizing effect on glia. This would be in agreement with the behavior of putative glial cells in the hippocampus (Casullo and Krnjević, 1987). The global effect seems to lean, in most of the cases, towards a resulting hyperpolarization of the glia. In those cases where a net depolarization of glia was recorded, we suggest that the combined glutamatergic/K+ action of neighboring neurons overwhelmed the direct cholinergic action.
At first sight this behavior might be difficult to explain, especially because, in glia, it is associated with increased membrane resistance and decreased membrane capacitance (Fig. 6). Membrane resistance and capacitance measurements reflect different phenomena: resistance usually betrays the permeability of the cellular membrane, while capacitance is associated with membrane surface. The membrane resistance diminution might result from the muscarinic reduction of a resting K+ conductance of cortical glia and should diminish the transfer of cations across the glial membrane. At the same time, the Na/K ATPase ion pump may actually be stimulated in neurons due to inflow of Na+ through depolarization-activated neuronal Na+ channels.
The decreased capacitance during activation might reflect either glial shrinkage consecutive to osmotic changes or closure of gap junctions (Amzica and Neckelmann, 1999). In the latter case, one would expect impaired spatial buffering across the glial syncytium during the activating process. It has been proposed that synchronous sleep activities (e.g. the slow, <1 Hz sleep oscillation) and hypersynchronous epileptic discharges are supported by the presence of a functional glial syncytium (Amzica et al., 2002). Therefore, the relative locally restricted synchronization of fast activities during activated states (Steriade et al., 1996; Steriade and Amzica, 1996) might be explained by a relatively disconnected glial network.
However, the lack of effect of the gap junction blocker isoflurane on the activating response of glial cells indicates a predominant volume-related mechanism. The glial shrinkage should be accompanied by expansion of the extracellular space and result in a decrease of the overall [K+]o (see analogous reasoning in Dietzel et al., 1989), which would further clamp the glial membrane at a more hyperpolarized level.
An alternative explanation might rely on the consistent associations between CBF and polarization of the glial membrane potential: increased CBF with hyperpolarized glia on the one hand, and decreased CBF with depolarized glia on the other hand. Cortical activation increases glucose metabolism (Maquet, 1997) and blood flow (Madsen and Vorstrup, 1991; Braun et al., 1997; Elhusseiny and Hamel, 2000; Tong and Hamel, 2000), thus possibly accounting for a washout of extracellular K+. This hypothesis corroborates with the increased [K+]o after reduction of the blood flow (Harris and Symon, 1984) and, in the present study, during those activations that depolarized glia. In other terms, the glial hyperpolarization might also reflect a depleted [K+]o. The link between CBF and glial polarization might be based on the tight relationship between K+ ions and water flow (reviewed in Simard and Nedergaard, 2004). Two possibilities could be envisaged: either K+ leaves the extracellular space directly toward blood vessels or K+ is siphonated directly from glial cells into capillaries through the endfoot, known to possess high densities of K+ and aquaporin-4 water channels (Nedergaard et al., 2003). In this case, the intraglial compartment might become a K+ sink for the extracellular space.
A third alternative could rely on an ATP-dependent mechanism as follows: increased metabolic demands during EEG activation might hyperpolarize glial cells through ATP-sensitive K+ channels (Brockhaus and Deitmer, 2000), which also would contribute to the inhibition of gap junction communication (Velasco et al., 2000), in line with the decreased glial capacitance reported in our study. This hypothesis needs, however, further testing because the existence of ATP-sensitive K+ channels have not yet been described in cat cortical glia, and they seem to undergo developmental downregulation (Brockhaus and Deitmer, 2000).
The combination of the two non-exclusive mechanisms of action (neurotransmitter- and blood flow-mediated), in addition to impaired space clamp of the glial Vm, could further explain the lack of voltage-dependency of the glial hyperpolarization.
Functional Consequences of the Glial/Vascular Behavior during Cholinergic Activation
The unfiltered (DC) recording of local depth field potentials produced an interesting finding: their polarity is related not only with the neuronal activity, but also with the steady polarization of the glial membranes, which in turn depends on the K+ siphoning through capillaries. This opens new perspectives for understanding the genesis of steady potentials in the EEG.
Thus, the understanding of mechanisms that rule conscious behavior must rely on a more complex approach taking into consideration tripartite interactions between neurons, glial cells and blood supply because none of these three elements can modulate its activity without influencing and undergoing the reciprocal influence of the other two.
This work was supported by grants from the Canadian Institute of Health Research (MT-15681). F.A. is a scholar of the Canadian Institute of Health Research, J.S. is an MS student, D.K. and D.A.N. are PhD students. We are thankful to Dr Attila Sik for skillful advices, Pierre Giguère and Denis Drolet for technical assistance.
References
Amzica F, Neckelmann D (
Amzica F, Massimini M, Manfridi A (
Araque A, Li N, Doyle RT, Haydon PG (
Araque A, Martin ED, Perea G, Arellano JI, Buño W (
Bergles DE, Roberts JD, Somogyi P, Jahr CE (
Bezzi P, Volterra A (
Bezzi P, Carmignoto G, Pasti L, Vesce S, Rossi D, Rizzini BL, Pozzan T, Volterra A (
Bormann J, Kettenmann H (
Bowman CL, Kimelberg HK (
Braun AR, Balkin TJ, Wesenten NJ, Carson RE, Varga M, Baldwin P, Selbie S, Belenky G, Herscovitch P (
Brockhaus J, Deitmer JW (
Celesia GG, Jasper HH (
Connors BW, Gutnick MJ, Prince DA (
Dietzel I, Heinemann U, Lux HD (
Elhusseiny A, Hamel E (
Glenn LL, Steriade M (
Godfraind JM, Kawamura H, Krnjević K, Pumain R (
Harris RJ, Symon L (
Hösli E, Hösli L (
Hösli L, Hösli E, Della BG, Quadri L, Heuss L (
Jones BE, Cuello AC (
Kang J, Jiang L, Goldman SA, Nedergaard M (
Kettenmann H, Schachner M (
Kim WT, Rioult MG, Cornell-Bell AH (
Krnjević K, Schwartz S (
Krnjević K, Pumain R, Renaud L (
Levi G, Gallo V (
MacVicar BA, Tse FW, Crichton SA, Kettenmann H (
Madsen PL, Vorstrup S (
Mantz J, Cordier J, Giaume C (
Maquet P (
Metherate R, Tremblay N, Dykes RW (
Metherate R, Cox CL, Ashe JH (
Monyer H, Seeburg PH, Wisden W (
Moruzzi G, Magoun HW (
Murphy S, Pearce B (
Nedergaard M, Ransom B, Goldman SA (
Newman EA (
Nuñez A, Amzica F, Steriade M (
Orkand RK, Nicholls JG, Kuffler SW (
Parpura V, Basarsky TA, Liu F, Jeftinija K, Jeftinija S, Haydon PG (
Pasti L, Volterra A, Pozzan T, Carmignoto G (
Porter JT, McCarthy KD (
Porter JT, McCarthy KD (
Ransom BR (
Rosier A, Arckens L, Orban GA, Vandesande F (
Semba K (
Simard M, Nedergaard M (
Somjen GG (
Sontheimer H, Kettenmann H, Backus KH, Schachner M (
Steinhäuser C, Gallo V (
Steriade M, Amzica F (
Steriade M, Oakson G, Ropert N (
Steriade M, Amzica F, Nuñez A (
Steriade M, Nuñez A, Amzica F (
Steriade M, Amzica F, Contreras D (
Szerb JC (
Tong XK, Hamel E (
Trachtenberg MC, Pollen DA (
Van Der Zee EA, Matsuyama T, Strosberg AD, Traber J, Luiten PG (
Van Der Zee EA, De Jong GI, Strosberg AD, Luiten PG (
Velasco A, Tabernero A, Granda B, Medina JM (
Wainer BH, Mesulam MM (