


Abstract
The dorsomedial visual area (DM), a subdivision of extrastriate cortex located near the dorsal midline, is characterized by heavy myelination and a relative emphasis on peripheral vision. To date, DM remains the least understood of the three primary targets of projections from the striate cortex (V1) in New World monkeys. Here, we characterize the responses of DM neurons in anaesthetized marmosets to drifting sine wave gratings. Most (82.4%) cells showed bidirectional sensitivity, with only 6.9% being strongly direction selective. The distribution of orientation sensitivity was bimodal, with a distinct population (corresponding to over half of the sample) formed by neurons with very narrow selectivity. When compared with a sample of V1 units representing a comparable range of eccentricities, DM cells revealed a preference for much lower spatial frequencies, and higher speeds. End inhibition was extremely rare, and the responses of many cells summated over distances as large as 30°. Our results suggest clear differences between DM and the two other main targets of V1 projections, the second (V2) and middle temporal (MT) areas, with cells in DM emphasizing aspects of visual information that are likely to be relevant for motor control.
Introduction
The dorsomedial area (DM) is a subdivision of the New World monkey extrastriate cortex, located rostral to the second visual area (V2) near the dorsal midline. DM forms a representation of the entire contralateral hemifield, and can be distinguished from adjacent areas on the basis of its relatively heavy myelination (Allman and Kaas, 1975; Rosa and Schmid, 1995). Anatomical studies have revealed that DM receives strong corticocortical projections from the striate cortex (V1), V2, the middle temporal area (MT) and the posterior parietal cortex, as well as weaker projections from various other areas (Krubitzer and Kaas, 1993; Beck and Kaas, 1998; Gamberini et al., 2003). This pattern indicates that DM is a node in the occipitoparietal, or dorsal ‘stream’ of visual areas, which is involved in functions such as the processing of motion and spatial relationships in the visual environment, and the visual guidance of movement (Ungerleider and Mishkin, 1982). While DM has been defined primarily in New World monkeys, a likely homologue, area V6, has been identified in Old World monkeys (Galletti et al., 1999, 2001). This area, located deep within the lunate and parietooccipital sulci of the macaque, is similar to DM in terms of its visuotopy, connections and histological features (Rosa and Tweedale, 2001, 2005; Rosa et al., 2005). DM and V6 also seem to include the territory of the ‘parietooccipital area’ (PO) described by other studies of New World and Old World monkeys (e.g. Colby et al., 1988; Neuenschwander et al., 1994), but extend further laterally to include representations of the central (<10°) visual field.
Of the three main targets of V1 projections in New World monkeys (V2, MT and DM; Krubitzer and Kaas, 1993), DM remains the least understood from the physiological point of view. To date, quantitative information regarding the response properties of DM neurons is limited to two previous studies in the nocturnal owl monkey (Aotus). Comparing the responses of cells in various visual areas in this species, Baker et al. (1981) reported that DM neurons have highly orientation-selective responses when stimulated with single bar-shaped stimuli, but respond weakly to moving random-dot patterns. In a later study, Petersen et al. (1988) described the response latency and adaptation characteristics of owl monkey DM cells to flashed bars, and suggested that these neurons receive indirect inputs from both the magnocellular and parvocellular retinogeniculate pathways (see also Krubitzer and Kaas, 1990). However, no studies to date have either considered the response properties of DM cells in diurnal New World monkeys, or characterized the spatiotemporal tuning of these cells in any detail. Here, we address these issues by examining the single unit responses of neurons in DM of marmoset monkeys, using drifting gratings as stimuli. As a reflection of the relatively small representation of the fovea in DM (Rosa et al., 2005), our sample comprised neurons with paracentral and near-peripheral receptive fields. Thus, in order to place our observations in context, they are compared with the results of V1 recordings at comparable eccentricities.
Materials and Methods
Animals
Single-unit recordings were obtained from 13 adult New World monkeys (Callithrix jacchus, the common marmoset). Experiments were conducted in accordance with the Australian Code of Practice for the Care and Use of Animals for Scientific Purposes, and all procedures were approved by the Monash University Animal Ethics Experimentation Committee. In seven animals, recordings were obtained primarily from DM, while in the other six cases V1 was targeted. Some of these animals were also part of parallel anatomical investigations of the visual and auditory cortices, and had received tracer injections at sites in the opposite hemisphere.
Surgical Preparation
The methods for preparation and procedures for recording and visual stimulation have been described in detail elsewhere (Bourne and Rosa, 2003), and only the main points will be summarized here. Anaesthesia was induced with ketamine (50 mg/kg; Parnell, Sydney, Australia) and xylazine (3 mg/kg; Ilium, Sydney, Australia), allowing a tracheotomy, cannulation of the saphenous vein and a craniotomy to be performed. The dura mater overlying the dorsal cortical surface was covered with a thin layer of silicone oil in order to prevent desiccation. After all surgical procedures were completed, the animal was administered an intravenous infusion of pancuronium bromide (0.1 mg/kg/h; Organon, Sydney, Australia), combined with sufentanil (6 μg/kg/h; Janssen-Cilag, Sydney, Australia) and dexamethasone (0.4 mg/kg/h; David Bull, Melbourne, Australia), in a saline/glucose solution, which induced muscular paralysis while maintaining anaesthesia. The animal was artificially ventilated with a gaseous mixture of nitrous oxide and oxygen (7:3). The level of anaesthesia was monitored using electrocardiographic criteria and the level of cortical spontaneous activity. Administration of atropine (1%) and phenylephrine hydrochloride (10%) eye drops (Sigma Pharmaceuticals, Melbourne, Australia) resulted in mydriasis and cycloplegia. Application of contact lenses focused the eyes on the screen of a computer monitor located 40 cm in front of the animal. Binocular interactions were not investigated in the present study. Similar to neurons in all layers of adult marmoset V1 (Sengpiel et al., 1996), single units in DM yield balanced responses to stimulation of either eye. Thus, in order to standardize the data collection, only the eye contralateral to the cerebral hemisphere under study was stimulated, while the ipsilateral eye was covered with an opaque shield.
Electrophysiological Recordings
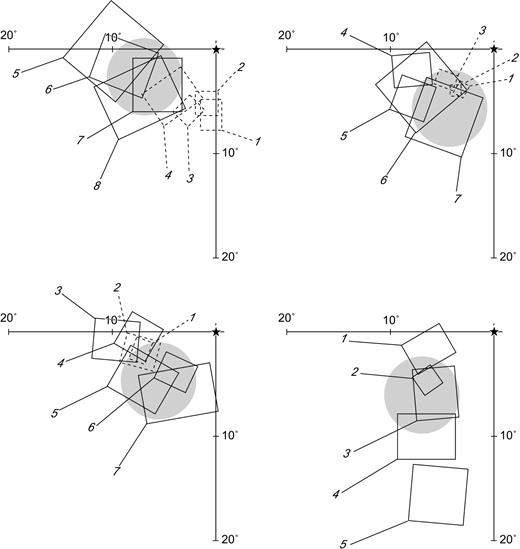
Parylene-coated tungsten microelectrodes were directed to DM and V1 using stereotaxic coordinates based on the studies of Rosa and Schmid (1995) and Fritsches and Rosa (1996). The attribution of recording sites to DM was initially determined by mapping of multiunit receptive fields, conducted at the beginning of the experimental sessions. As described in detail elsewhere (e.g. Allman and Kaas, 1975; Rosa et al., 2005), anteroposterior sequences of recording sites starting in dorsal V2 reveal receptive fields that move gradually from the lower quadrant to the horizontal meridian of the visual field, as progressively more anterior sites are sampled. At the V2/DM border, hand-mapped multiunit receptive fields become much larger (approximately twice as long), and may either revert towards the lower vertical meridian (in the medial part of DM) or invade the upper quadrant, moving towards the upper vertical meridian (in the lateral part of DM). The location of the recording sites was later confirmed by histological examination of the electrode tracks. The present recordings were concentrated on the part of DM located on the dorsal surface near the midline, resulting in receptive fields in the lower visual field between 5° and 12° eccentricity (Fig. 1). A sample of V1 units was obtained from recordings involving the caudal part of the calcarine sulcus, which yielded receptive fields covering a similar range of eccentricities (Fritsches and Rosa, 1996).
Sequences of receptive fields recorded in areas V2 (dashed lines) and DM (continuous lines), illustrating the topographic criterion used to identify DM during the recording sessions in four animals. The diagrams illustrate a sector of the lower visual quadrant (fovea on the top right) and receptive fields recorded along a parasagittal row of electrode penetrations. In each sequence, the receptive fields are numbered consecutively from the most caudal recording site (field 1) to the most rostral site. The receptive fields of DM cells move gradually from the horizontal meridian, towards the vertical meridian as the electrode is moved rostrally. The grey circles in each diagram represent estimates of the region of the visual field encompassed by the centres of the receptive fields of cells used for the quantitative analyses described in the present paper, based on a larger number of receptive fields mapped at the beginning of the experiments.
The initial exploration of the receptive field boundaries was conducted using dark, elongated hand-held stimuli (such as rulers of various lengths and widths) moved at various speeds and orientations across the backlit screen of a 20-inch monitor (refresh rate 75 Hz, resolution 1024 × 768 pixels). This resulted in an approximate map of the receptive field boundaries, as revealed by stimuli of near-optimal orientation. The estimates of receptive field borders were then refined by presenting computer-generated, mouse-controlled moving and flashing bars of near-optimal orientation, while listening to the cell's activity. The receptive fields mapped in this way were similar in size to those reported by previous studies in marmoset DM (Fig. 1; see also Rosa and Schmid, 1995; Rosa et al., 2005). Finally, in order to ensure that the stimuli used for quantitative tests were appropriately centred on the receptive fields, we employed small stimuli (such as a 1° crosshair or square) flashed in different points of the receptive field, in order to determine the point of the visual field that elicited the maximal response. While, as it will become clear from the Results below, the majority of DM cells prefers larger stimuli, these small probes resulted in reliable responses if presented near the receptive field centre. It was typically found that the point of maximal response coincided well with the estimated geometrical centre of the receptive field, although in some cases small corrections (up to 2°) were necessary.
Following the determination of the receptive field centre, the neuronal response properties were studied quantitatively using computer-controlled stimuli. The paradigm for quantitative tests consisted of rectangular patches of drifting sinewave luminance grating presented against a uniform grey (2.6 cd/m2) background. Each trial started with a 1 s presentation of the grey screen, during which measurements of spontaneous activity were obtained. The stimulus contrast was gradually increased to 66% over a period of 500 ms, held constant for 1.5 s, then gradually decreased over a further 500 ms. An inter-trial interval of 3 s, during which the grey screen was presented, separated trials. Different tests addressed the neuronal selectivity to drift direction, spatial frequency, temporal frequency, and length and width of the grating patches. Typically, only one parameter was varied between trials, while the others were held constant at a value near the cell's optimum. Six to 10 randomized trials involving the presentation of each stimulus condition were used.
The testing of each unit followed a standard protocol, which started with a qualitative assessment of response selectivity, conducted with the objective of finding a stimulus configuration that was capable of eliciting robust responses. Using these estimated parameters, the cell was tested for direction of motion selectivity, using gratings that drifted in directions 20° apart. Subsequent tests of spatial frequency selectivity (at a constant temporal frequency of 3.6 Hz), temporal frequency selectivity and length/ width selectivity were conducted. Given that the results were immediately available to the experimenter, the stimulus was gradually refined during the test sequence. The protocol was concluded with a retest of selectivity to direction of motion, using quantitatively determined optimal parameters.
All electrode penetrations were made according to the vertical stereotaxic plane, resulting in an acute angle between the electrode trajectory and radial fascicles of neurons observed in Nissl-stained sections (e.g. Rosa et al., 2005). The depth of recording sites along such tracks varied between 100 and 1400 μm, corresponding to the typical thickness of the DM cortex measured in histological sections, corrected to compensate for the angle between the electrode tracks and the columns of cells. Small electrolytic lesions (4 μA, 10 s) were placed at various sites, to allow the histological identification of the recording sites.
Histology
At the end of the experiment, the animal was administered an overdose of sodium pentobarbitone (Rhone-Merieux, Brisbane, Australia) and perfused transcardially with 0.9% saline, followed by 4% paraformaldehyde in 0.1 M phosphate buffer (pH 7.4). After cryoprotection and sectioning, alternate slides (40 μm) were stained for Nissl substance and myelin, allowing for reconstruction of electrode tracks relative to histological borders. All cells included in the present report were confirmed as belonging to either DM or V1, on the basis of histological analysis (for criteria, see Rosa et al., 2005).
Data Analysis
The responses of each cell were converted into peri-stimulus time histograms with a 10 ms bin width, which formed the basis of all subsequent analysis. Given that most, if not all, receptive fields in DM are complex (Baker et al., 1981), neuronal firing rates are reported as the DC component of the response over the first 2 s of stimulus presentation.
Selectivity to Direction of Motion
Indices of direction and axis of motion bias were calculated using vector summation, following a procedure used in previous studies from our laboratory (Bourne et al., 2002, 2004; Lui et al., 2005). Two sets of calculations were performed, corresponding to the vector sum across 360° and 180° ranges (in the latter case, the neuronal responses to movement in two opposing directions were averaged). The responses obtained in response to gratings drifting in different directions (i.e. firing rate minus the mean of the spontaneous activity estimates during the test) were normalized with respect to the peak. Thus, the vector representing the response to the direction/orientation yielding the highest spike count was assigned a module of 1, while vectors representing the responses to directions/orientations yielding spontaneous levels of activity were assigned a module of 0, and those representing inhibitory responses were assigned negative values. A standard vector sum was then performed, and the values obtained from the calculations of the vector module over the 360° and 180° ranges were used as estimates of the cell's direction index (DI) and orientation index (OI) respectively. By virtue of this method of calculation, indices above 1 are possible, corresponding to cells with extremely narrow bandwidth, and inhibition by stimuli of non-optimal orientations or directions of motion.
Based on the DI and OI, the stimulus selectivity of each neuron was classified as unidirectional, bidirectional or weakly biased. Neurons with either OI or DI ≥ 0.2 were classified as motion selective, whereas neurons that did not satisfy this criterion were classified as weakly biased. Motion-selective neurons were further subdivided into uni- or bidirectional categories. Cells with a DI > 0.33 were classified as unidirectional, while cells with a DI between 0.20 and 0.33 were classified either as uni- or bidirectional, depending on whether the DI or the OI was greater. Cells with an OI ≥ 0.20 and DI < 0.20 were also classified as bidirectional. These cut-off values were chosen empirically, in order to provide a satisfactory description of polar plots showing response as a function of direction of motion. Typically, a cell with an OI of 0.2 would fire approximately twice as many action potentials in response to the best orientation, as opposed to its orthogonal. Estimates of optimal direction of motion took into consideration the vector sum over either 180° or 360°, depending on whether the neuron was uni- or bidirectional.
Spatial and Temporal Frequency
Estimates of optimal spatial and temporal frequencies, as well as low and high cut-off values (defined at 50% of the peak) were based on analysis of curves describing the variation in neuronal response as a function of these parameters, fitted with Table Curve 2D (Systat, USA). For each cell, the peak function yielding the highest coefficient of correlation was chosen, provided that the plot realistically fitted the data points (e.g. without artificial troughs or peaks). No assumptions have been made regarding the nature of the relationships between cellular responses and these parameters, and the fits are purely descriptive. Cells in which the best-fitting curves yielded r2 values <0.85 were excluded from further analysis.
Spatial Summation
We used Table Curve 3D (Systat) to fit surfaces describing the variation of neuronal response as a function of both length and width of the grating patch. The fitting was constrained by the requirement that the plot crossed the origin (i.e. the level of spontaneous activity) at length/width zero. The function yielding the highest coefficient of correlation was chosen, provided that the resulting surface visually fitted the data; again, cells in which the best-fitting surfaces yielded r2 values <0.85 were excluded from further analysis. End-inhibited cells were defined as those in which the stimulus activity in response to the greatest patch length in our set of stimuli (30°) was more than two standard errors lower than the activity evoked by a shorter (near optimal) patch. This analysis was conducted using a cross-section of the fitted surface corresponding to a near-optimal width. Conversely, side-inhibited cells were those in which the response to the widest patch was more than two standard errors lower than a narrower patch, at near-optimal length. Estimates of optimal length and width were defined independently, either as values corresponding to the peaks of the fitted surfaces (for end- and side-inhibited cells), or values beyond which no further significant change in activity was observed.
Statistical analyses were conducted using SPSS for Windows. Both parametric and non-parametric tests were used, depending on the normality of distribution and the uniformity of variance.
Results
This study is based on the analysis of the responses of 131 neurons in area DM, located in the representation of paracentral and near-peripheral vision (5–12° eccentricity), away from both the vertical and the horizontal meridians. For comparison, we also analysed the direction of motion, spatial frequency and temporal frequency selectivity of 50 V1 neurons with receptive fields covering a comparable region of the visual field. In both areas, the majority of our sample corresponds to neurons in the supragranular layers (the numbers of cells recorded in each layer of DM are indicated in Table 1).
Frequency of cells with different types of motion selectivity in different layers of DM
| Layer | n | Unidirectional | Bidirectional | Weakly biased | Type 1 | Type 2 |
|---|---|---|---|---|---|---|
| 1 | 4 | 1 | 3 | 0 | 2 | 2 |
| 2 | 8 | 0 | 6 | 2 | 5 | 3 |
| 3 | 79 | 4 | 69 | 6 | 34 | 45 |
| 4 | 11 | 0 | 9 | 2 | 6 | 5 |
| 5 | 21 | 3 | 15 | 3 | 8 | 13 |
| 6 | 8 | 1 | 6 | 1 | 5 | 3 |
| Total | 131 | 9 | 108 | 14 | 60 | 71 |
Selectivity for Direction of Motion
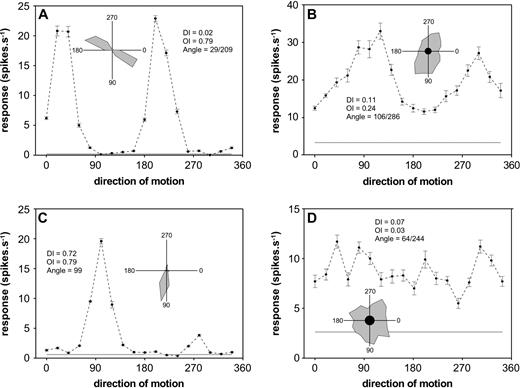
Figure 2 illustrates the dependence of the responses of four DM cells on direction of motion of the grating elements. When tested with stimuli of near-optimal spatial frequency, temporal frequency and size, the vast majority of DM cells (82.4%, 108/131) demonstrated bidirectional selectivity (e.g. Fig. 2A,B). Cells with strong direction selectivity (Fig. 2C) and those showing weak or no direction bias (Fig. 2D) were relatively rare, comprising only 6.9% (9 units) and 10.7% (14 units) of the population, respectively. As shown in Table 1, there was no clear relationship between the distributions of unidirectional, bidirectional and weakly biased cells and laminar position. Our observations in the topographically corresponding region of V1 revealed different proportions of cells in these categories [χ2(2) = 18.163, P < 0.001; Table 2]. In particular, V1 had much larger numbers of unidirectional cells (28%).
Responses of four DM neurons as a function of the direction of motion. (A) Narrowly tuned (type 2) bidirectional neuron recorded at a depth of 1100 μm. (B) Broadly tuned (type 1) bidirectional neuron, recorded at a depth of 700 μm. (C) Narrowly tuned (type 2) cell with strong direction selectivity, recorded at a depth of 400 μm. (D) Weakly biased neuron, recorded at a depth of 400 μm. Data points correspond to the means and SEMs of the responses over eight trials. The grey horizontal line corresponds to the level of spontaneous activity, recorded over 500 ms prior to the stimulus presentation. The inserts summarize the same data in polar plot format. Direction 0 corresponds to rightward motion, 90 is downward, 180 is leftward, and 270 is upward. Abbreviations: DI, direction index; OI, orientation index.
Proportions of cells with different types of direction selectivity in two visual areas
| Area | Bidirectional (%) | Unidirectional (%) | Weakly biased (%) |
|---|---|---|---|
| DM (n = 131) | 82.4 | 6.9 | 10.7 |
| V1 (n = 50) | 54.0 | 28.0 | 18.0 |
| Area | Bidirectional (%) | Unidirectional (%) | Weakly biased (%) |
|---|---|---|---|
| DM (n = 131) | 82.4 | 6.9 | 10.7 |
| V1 (n = 50) | 54.0 | 28.0 | 18.0 |
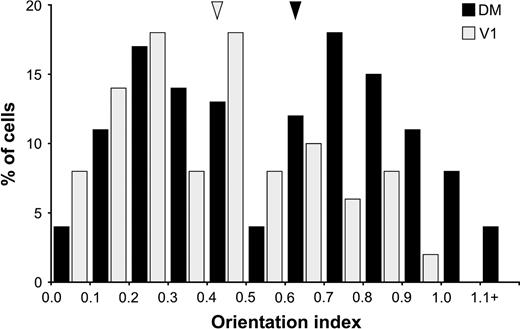
In order to compare the strength of tuning of cells in V1 and DM, we examined the distributions of the OI in these areas (Fig. 3). Typically, DM cells were more narrowly tuned to axis of motion (median OI = 0.63) than neurons in V1 (median OI = 0.43; Mann–Whitney test, U = 2267.5, z = −3.197, P < 0.001). However, the distribution of orientation indices in DM was markedly bimodal (Fig. 3), suggesting the existence of two distinct functional populations of neurons. In an attempt to test this hypothesis, we have adopted a cut-off value of OI = 0.55 to distinguish two groups of units: type 1 (or broadly tuned) DM units, corresponding to the first mode of the distribution (n = 60, OI = 0.28 ± 0.13), and type 2 (narrowly tuned) DM units, corresponding to the second mode (n = 71, OI = 0.84 ± 0.17). The distribution of orientation index values in V1 is biased towards the range corresponding to type 1 DM units (see also Fig. 4). Similar to the unit illustrated in Figure 2C, seven of the nine neurons showing strong direction selectivity were classified as type 2, by virtue of also showing narrow axis of motion selectivity. Type 1 and type 2 cells were found in each of the animals studied, and occurred in approximately similar proportions in all cortical layers (Table 1). As described below, cells in these categories were also found to differ in terms of other response properties.
Distributions of orientation index (OI) in our sample of DM and V1 neurons. The arrow heads point to the median values of the two distributions. Note the bimodal distribution of OI values in DM.
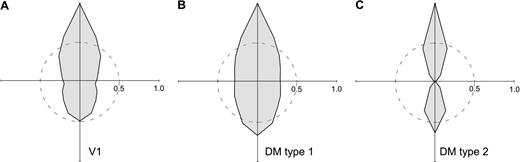
Average direction tuning of neurons in V1 (A) and DM (B, C). In preparing these polar plots, the responses of each cell were normalized with respect to the maximum. Clockwise and counterclockwise deviations from the optimal were pooled, so the polar plots are symmetrical about the norm. The dashed line indicates the level corresponding to half of the maximal response.
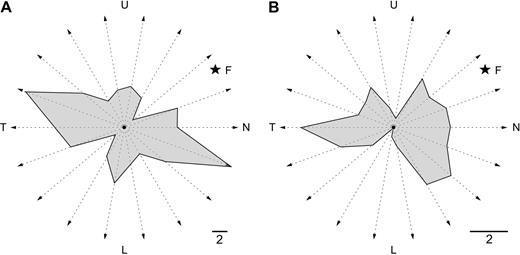
Graphical representation of the number of neurons with preference for motion along different axes in DM (A) and V1 (B). The grey polygons were defined on the basis of the number of neurons with preferred axes of motion pointing in different directions (within 20° bins). For bidirectional cells, one half of a ‘unit’ was attributed to each of two diametrically opposed directions. L represents movement towards the lower visual field. N is movement towards the nasal visual field, T is movement towards the temporal visual field, and U is movement towards the upper visual field. Scale bars = 2 cells. The star indicates the approximate relationship of the location of the fovea (F) to the represented axes of motion, taking into consideration the average location of the receptive fields in the sample. Weakly biased neurons (OI and DI < 0.2) were excluded from this analysis.
Selectivity for Spatial Frequency
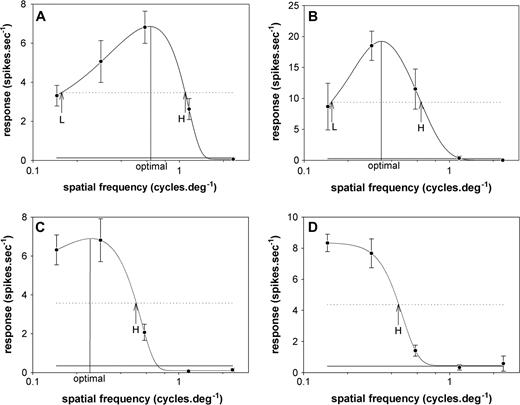
The selectivity for spatial frequency was established for 117 DM neurons and 48 V1 neurons. Typical stimulus–response curves (Fig. 6A–D) and the average population response (Fig. 7A) converged to demonstrate that the vast majority of DM neurons respond optimally to low spatial frequencies. Indeed, 112 of the studied neurons (95.7% of the characterized sample) responded maximally to spatial frequencies below 1 cycle/deg. Moreover, in 37 cells (32% of the sample) the best responses were obtained upon the presentation of the coarsest grating in our stimulus set (0.15 cycles/deg). In these cases, the cells were simply classified as low-pass, as no peak or low50 cut-off spatial frequency could be determined (e.g. Fig. 6D). Only two DM cells (1.7%) had high50 cut-off spatial frequencies above 2 cycles/deg.
Examples of spatial frequency selectivity of DM cells. (A, B) Neurons with bandpass selectivity. A was a unidirectional type 2 cell, recorded at a depth of 400 μm, and B was a bidirectional type 2 cell, recorded at a depth of 350 μm. (C) Bidirectional type 2 cell, recorded at a depth 700 μm, for which a low cut-off spatial frequency could not be determined. (D) Bidirectional type 2 neuron (depth 400 μm) with low-pass characteristics. Data points correspond to the means and SEMs of the evoked activity, the continuous grey line corresponds to the level of spontaneous activity, and the dashed line to the half-peak activity. H, high50 cut-off spatial frequency; L, low50 cut-off spatial frequency.
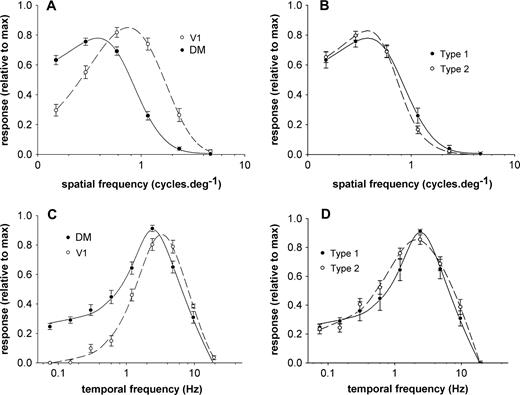
Average spatial and temporal frequency selectivity curves of the sampled neuronal populations. (A) Comparison of the selectivity to spatial frequency in DM (continuous line) and V1 (dashed line). Data points are means and SEMs of the normalized responses of individual units to the various spatial frequencies tested. (B) Comparison of the spatial frequency selectivity of type 1 and type 2 DM neurons. (C) Comparison of the average responses of DM and V1 cells to various temporal frequencies. (D) Comparison of the temporal frequency selectivity of type 1 and type 2 DM neurons.
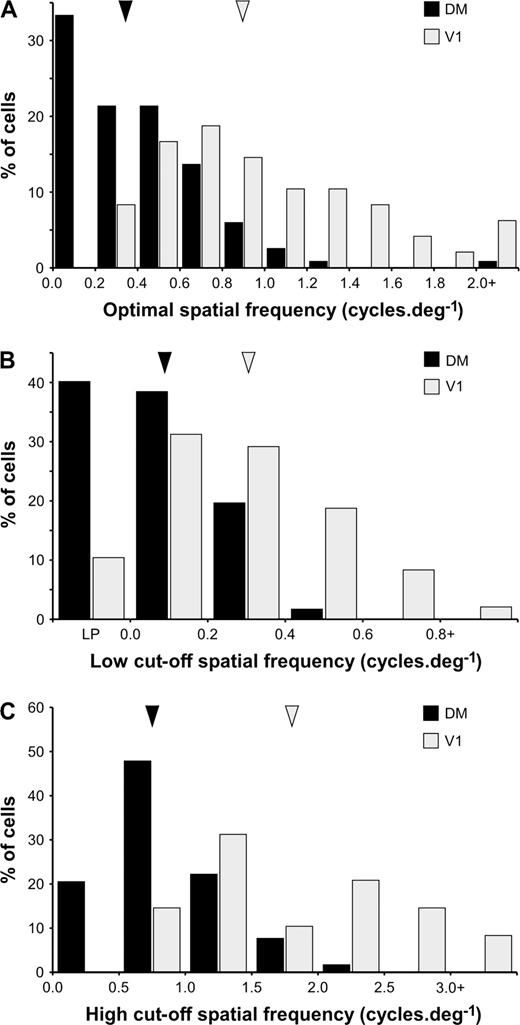
In comparison, V1 neurons at a comparable eccentricity responded to higher spatial frequencies. As suggested by a comparison of the average population responses (Fig. 7A), the distribution of optimal spatial frequencies of DM cells was significantly different from that of V1 cells (Fig. 8A; medianDM = 0.37 cycles/deg; medianV1 = 0.89 cycles/deg; Mann–Whitney test, U = 805.0, z = −7.228, P < 0.001). Likewise, significant differences in the distributions of low50 cut-off spatial frequencies (Fig. 8B; medianDM = 0.09 cycles/deg, medianV1 = 0.28 cycles/deg; Mann–Whitney test, U = 1276.5, z = 5.584, P < 0.001) and high50 cut-off spatial frequencies (Fig. 8C; medianDM = 0.75 cycles/deg, medianV1 = 1.79 cycles/deg; Mann–Whitney test, U = 712.5, z = −7.519, P < 0.001) converged in support of the conclusion that DM cells are less responsive to fine patterns, in comparison with V1 cells. The selectivity for spatial frequency was indistinguishable for type 1 and type 2 DM cells, both in terms of preferred frequencies and cut-off values (Fig. 7B). Comparisons between the spatial frequency selectivity of cells in different layers of DM revealed no significant differences with the exception of the fact that cells in layer 4 tended to prefer slightly higher frequencies (median optimal frequency = 0.53 cycles/deg) in comparison with those in the extragranular layers (median optimal frequency = 0.34 cycles/deg; Mann–Whitney test, U = 250.0, z = −2.824, P < 0.01).
Distributions of optimal spatial frequency (A), low50 cut-off spatial frequency (B) and high50 cut-off spatial frequency (C) in DM (black bars) and V1 (light grey bars). The arrow heads point to the median values of the distributions.
Selectivity for Temporal Frequency
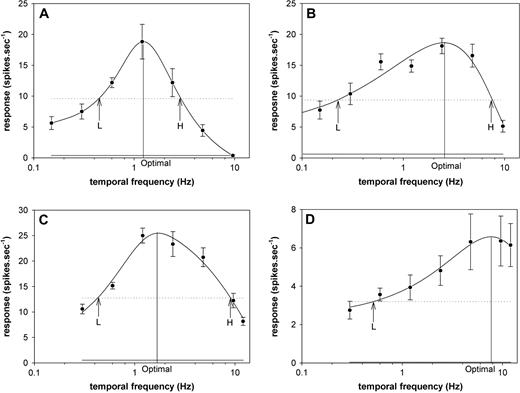
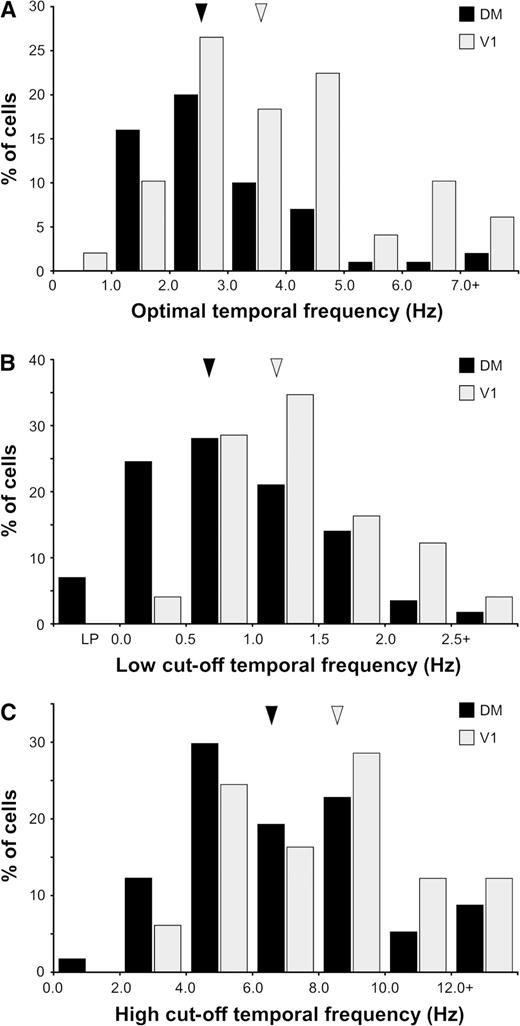
We were able to characterize the temporal frequency selectivity of 56 DM neurons and 49 V1 neurons. The smaller sample of DM neurons used in this analysis was due to the fact that the range of stimuli used in our initial experiments proved insufficient to fully define the neuronal responses to the highest temporal frequencies. The average response curves for the DM and V1 samples and the temporal frequency selectivity of four representative DM neurons are illustrated in Figures 7C and 9, respectively. In general, DM neurons preferred lower temporal frequencies in comparison with V1 neurons at corresponding eccentricities. As demonstrated in Figure 10A, although the distributions of optimal temporal frequency in DM and V1 overlapped considerably, the median optimal temporal frequency for DM cells was lower (2.53 Hz) than that for V1 cells (3.60 Hz), and this difference was significant (Mann–Whitney test, U = 889.0, z = −3.103, P = 0.002). In addition, V1 and DM also differed in terms of the distributions of low50 cut-off temporal frequency (Fig. 10B; medianDM = 0.71 Hz, medianV1 = 1.18 Hz; Mann–Whitney test, U = 758.0, z = −3.944, P < 0.001) and high50 cut-off temporal frequency (Fig. 10C; medianDM = 6.55 Hz, medianV1 = 8.52 Hz; Mann–Whitney test, U = 1009.0, z = −2.332, P = 0.02). By taking into consideration the neuronal selectivities to both spatial and temporal frequency, it can be concluded that, in comparison with those of V1 cells, the maximal responses of DM cells require faster moving (albeit coarser) patterns (median optimal speedDM = 6.19°/s; median optimal speedV1 = 4.83°/s; Mann–Whitney test, U = 1095, z = −2.16, P = 0.031)
Examples of temporal frequency selectivity of DM cells. (A) Bidirectional type 2 neuron recorded at a depth of 1100 μm, which showed narrow bandpass selectivity to temporal frequency. (B, C) Neurons with wider bandpass selectivity. B was a bidirectional type 2 cell recorded at a depth of 650 μm, while C was a bidirectional type 1 cell recorded at a depth of 550 μm. (D) Unidirectional type 1 neuron recorded at a depth of 400 μm, for which a high cut-off temporal frequency could not be determined. Data points correspond to the means and SEMs of the evoked activity, the continuous grey line corresponds to the level of spontaneous activity, and the dashed line to the half-peak activity. H, high50 cut-off temporal frequency; L, low50 cut-off temporal frequency.
Distributions of optimal temporal frequency (A), low50 cut-off temporal frequency (B) and high50 cut-off spatial frequency (C) in DM (black bars) and V1 (light grey bars). The arrow heads point to the median values of the distributions.
Type 2 (narrowly tuned) DM cells tended to respond more strongly to low temporal frequencies than did type 1 (broadly tuned) cells (Fig. 7D). The low50 cut-off temporal frequency for type 2 cells (median = 0.58 Hz) was significantly different from that for type 1 cells (median = 1.28 Hz; Mann–Whitney test, U = 163.0, z = −3.607, P < 0.001). Comparisons between the temporal frequency selectivity of cells in different layers of DM revealed no significant differences.
Spatial Summation
We characterized the selectivity of 99 DM neurons to variations in the length and width of gratings of optimal orientation, spatial frequency and temporal frequency. It was clear from the first experiments that DM cells were striking in terms of showing extensive length summation, and relatively weak inhibition by stimuli that extended beyond what we considered the ‘classical’ receptive field boundaries. Whereas typical excitatory receptive fields of cells in the investigated part of DM (mapped using hand-moved and flashed light and dark bars) have lengths in the range from 3° to 11° (mean = 6.0°, at a mean eccentricity of 7.5°; see also Allman and Kaas, 1975; Rosa et al., 2005), it was often observed that the responses were maximized by the presentation of long, uninterrupted contours that included, but extended significantly beyond, the boundaries of the hand-mapped receptive field. These qualitative observations were reflected in the results of our quantitative tests, as detailed below.
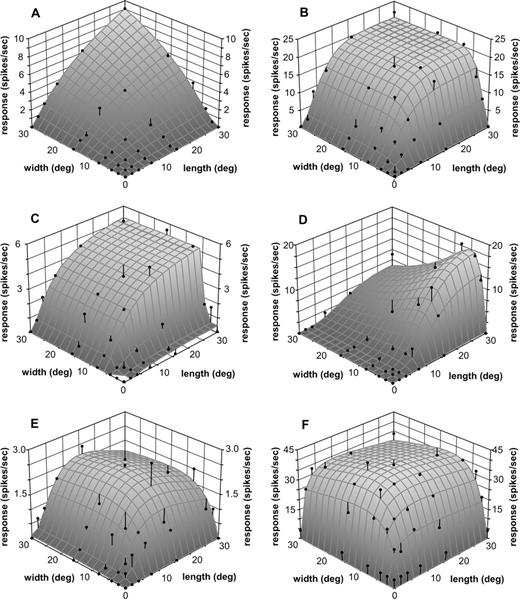
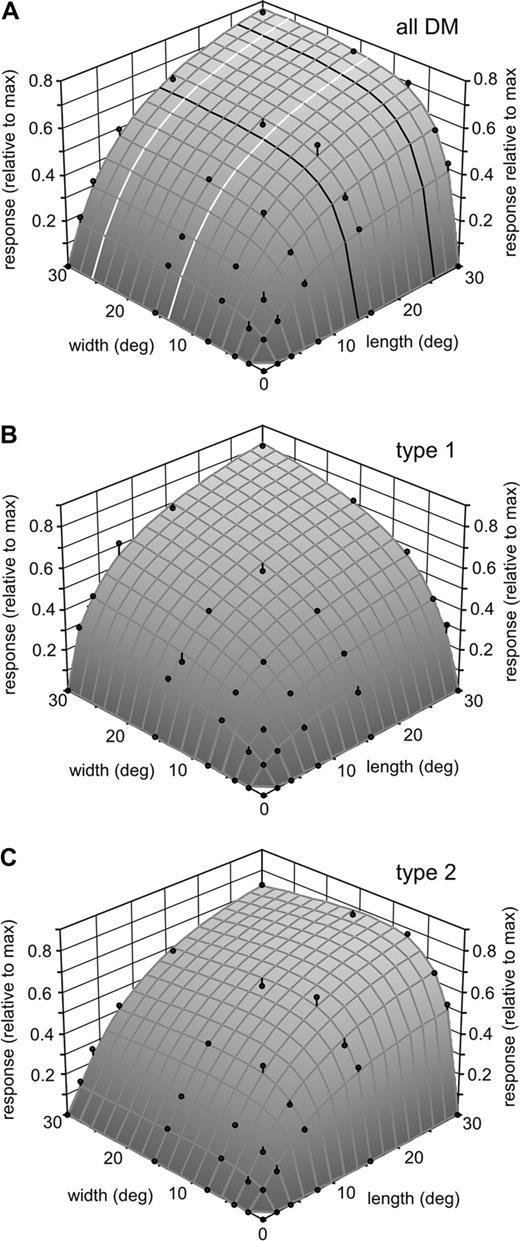
Figure 11 illustrates examples of the selectivity of different DM neurons to the length and width of a grating patch centred on the receptive field. The majority of the neurons in DM (61.6%) showed no sign of end- or side-inhibition upon the presentation of gratings as large as 30° × 30° (Fig. 11A–C). Indeed, in many cases (33% of the population), the maximal response was obtained in response to the presentation of the 30° × 30× grating (Fig. 11A,B). The second largest population (28.3%) was formed by neurons showing significant side-inhibition, but no end-inhibition (Fig. 11D). Cells showing a weak, but statistically significant degree of end-inhibition formed 10.1% of the sample; this property occurred either in isolation (Fig. 11E; 4.0% of the sample) or in combination with side-inhibition (Fig. 11F; 6.1% of the sample). The average stimulus–response profile of DM cells reflects these trends (Fig. 12A). For any particular grating length, the normalized response increases with increasing grating width until the approximate dimension of the classical receptive fields in this part of DM is reached. Further increases in grating width result in no additional modulation of the normalized response (e.g. black curves in Fig. 12A). In contrast, the normalized length tuning curves at any fixed grating width (e.g. white curves in Fig. 12A) reveal increases in neuronal responses up to the longest (30°) stimulus used. Cells in the infragranular layers of DM showed a particularly marked preference for long gratings (Table 3).
Examples of neuronal selectivity to length and width of a grating patch. (A) Bidirectional type 1 cell recorded at a depth of 130 μm, which showed extensive summation along both the length and width dimensions. (B, C) Bidirectional type 2 cells, recorded at depths of 650 and 800 μm, respectively, which demonstrated summation up to certain values of length and width, but no inhibition by stimuli that extended beyond these values. (D) Bidirectional type 2 cell recorded at a depth of 350 μm, which showed extensive length summation associated with side-inhibition. (E) Bidirectional type 2 cell recorded at a depth of 500 μm, which showed end-inhibition but no side-inhibition. (F) Bidirectional type 1 cell recorded at a depth of 700 μm, with weak end- and side-inhibition.
(A) Three-dimensional plot illustrating the average spatial summation properties of a sample of 99 DM neurons. The strength of the response to all length/width combinations of every neuron was normalized with respect to the peak response, after subtraction of the spontaneous activity. The black curves are examples of width tuning at a constant stimulus length, while the white curves are examples of length tuning at a constant stimulus width. (B, C) Similar analyses including only type 1 (B) and type 2 (C) cells. On average, type 2 cells tended to show peak responses to narrower grating patches.
Frequency of end- and side-inhibited cells and optimal stimulus dimensions in different layers of DM
| Layer | n | End-inhibited | Side-inhibited | Optimal length (median, deg) | Optimal width (median, deg) |
|---|---|---|---|---|---|
| 1 | 2 | 0 | 1 | 16.5 | 3.5 |
| 2 | 7 | 1 | 0 | 19 | 26 |
| 3 | 61 | 8 | 24 | 21 | 10 |
| 4 | 8 | 0 | 2 | 17 | 10.5 |
| 5 | 15 | 1 | 4 | 27 | 15 |
| 6 | 6 | 0 | 3 | 30 | 15.5 |
| Total | 99 | 10 | 34 |
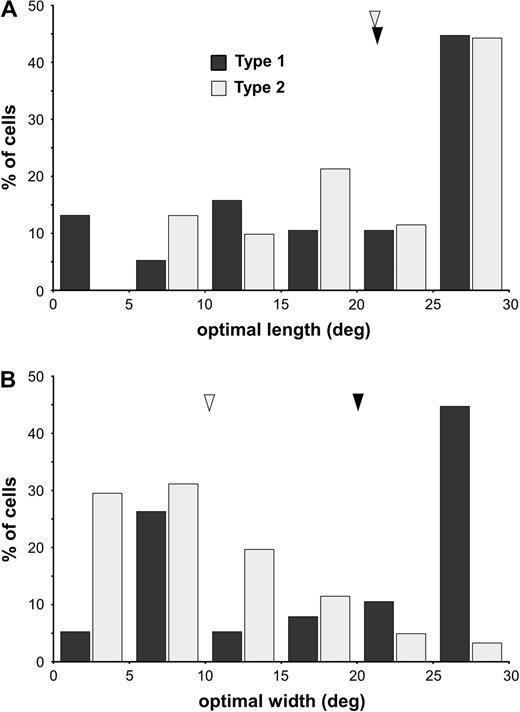
The spatial summation characteristics of type 1 and type 2 DM neurons were different, as shown in Figure 12B,C and in Figure 13. Typically, type 2 cells required relatively narrow grating patches in order to achieve maximal responses, while type 1 cells included a large proportion of cells which summated up to the maximum grating width tested (Fig. 13). This difference was statistically significant (optimal widthtype2 = 10.1 ± 6.7°; optimal widthtype1 = 20.2 ± 9.5°; U = 495.0, z = −4.795; P < 0.001). Moreover, the prevalence of side-inhibition was also significantly greater among type 2 cells (46%), as compared with type 1 cells [16%; χ2(1) = 9.415, P = 0.02].
Distributions of optimal lengths (A) and widths (B) among type 1 (black) and type 2 (grey) DM cells. The arrow heads point to the median values of the distributions.
Previous studies in our laboratory have estimated that receptive fields of neurons in the studied part of DM are nearly four times as large (linearly) as those of V1 cells at a corresponding eccentricity, on the basis of qualitative minimum response field mapping (Rosa and Schmid, 1995; Rosa et al., 1997). The present quantitative results reflect this relationship to some extent, with V1 cells showing a median optimal length of only 4.7° (n = 45) at 66% contrast. However, in comparison with DM, a much larger proportion (71.1%) of the V1 cells were significantly inhibited by stimuli that extended beyond the optimal length.
“Classical” versus Modulatory Parts of the Receptive Fields
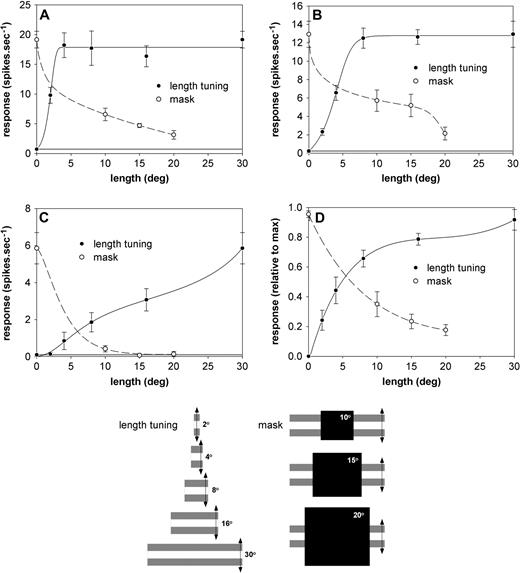
The extensive spatial summation we found in many DM cells, particularly along the length dimension, contrasts with the moderate (typically <10°) size of the excitatory receptive fields mapped through the presentation of single moving and flashed bars. This raises the question of what constitutes a ‘classical’ receptive field in DM. One hypothesis that could account for the observed discrepancy is that the excitatory receptive fields revealed by stimulation with single bars simply represent the most responsive part of what is actually a longer ‘classical’ receptive field. On the other hand, it could be that the receptive fields of DM neurons are bordered by subthreshold, ‘silent’ facilitatory peripheries, which add to the level of response elicited by the classical receptive field, if stimulated at the same time. In a subset of 12 neurons, we attempted to clarify this issue as illustrated in Figure 14. Length summation curves were obtained with stimuli of a constant width (8°) and optimal spatiotemporal characteristics. The hand-mapped receptive field was then covered by opaque square masks of various dimensions (10°, 15° and 20°), while the visual field was stimulated with long (30° × 8°) grating patches centred on the receptive field. Both the gratings and the square masks were oriented so that they were aligned with the optimal orientation of the neuron under study, as determined quantitatively. The results of this analysis suggest a complex interplay between the central and peripheral zones of DM receptive fields.
Results of experiments in which the receptive fields of DM neurons were masked. (A) Type 1 neuron, recorded at a depth of 550 μm. (B) Type 2 neuron, recorded at a depth of 900 μm. (C) Type 2 neuron, recorded at a depth of 500 μm. (D) Average normalized responses of 12 neurons. In each of the panels two curves are illustrated, one indicating the responses of DM neurons to gratings of increasing length (continuous line), and the other indicating the responses in the presence of marks of increasing size (dashed line). The bottom diagram displays schematic representations of the experimental stimuli used. Both the gratings and the square masks were oriented so that they were aligned with the optimal orientation of the neuron under study. Data points are means and SEMs; horizontal lines indicate the level of spontaneous activity (in D, only responses above the spontaneous activity are illustrated).
The most common pattern of response (7/12 cells), illustrated in Figure 14A,B, was one in which neurons responded to stimulation of the ‘fringe’ zones alone, at a level corresponding to at least 2 SDs above the mean spontaneous activity. Although this indicates the existence of weaker excitatory zones aligned with the main axis of the receptive field, as suggested by the first hypothesis above, our results argue against a simple linear summation of inputs along the receptive field axis. For example, while the results illustrated in Figure 14A suggest the existence of excitatory zones as far as 10° from the receptive field centre (20° mask), the responses of the same neuron saturate at a relatively short stimulus length (∼4°). Thus, the peripheral excitatory zones seem to contribute little to the level of response in situations in which the central zone of the receptive field is also stimulated. Less commonly (five neurons), the responses were more consistent with the second hypothesis (Fig. 14C): while stimulation with progressively longer gratings revealed extensive spatial summation, no responses could be detected when masks were used to block stimulation of the classical receptive field. In these cases, the peripheral zones could add to the response elicited by stimulation of the receptive field centre, but were unable to drive the neuron if stimulated alone.
Discussion
In this paper we describe the physiological response properties of neurons in extrastriate area DM of the marmoset, a species of diurnal New World monkey. Given that DM was first described 30 years ago (Allman and Kaas, 1975) and that this area is likely to have a prominent role in visual processing (as it is one of the main targets of projections of striate cortex), there have been surprisingly few reports of the physiological characteristics of the neurons therein. We will argue here that the present study provides a substantially clearer picture of the stimulus selectivity of DM neurons. Moreover, while recognizing that the issue of the homologies between DM and visual areas described in Old World monkeys will require further study, we feel that comparison of the present results with those obtained in various dorsal areas of the macaque helps considerably in limiting the number of possible interpretations of the comparative data. Finally, a specific role of DM in visual processing has not been elucidated by previous studies of New World monkey cortex (Baker et al., 1981). As detailed below, we suggest that the present results, in light of the earlier work, are compatible with a role for DM in monitoring visual patterns of activity evoked by self-motion (Rosa and Tweedale, 2001). These may include both wide-field patterns resulting from locomotion, postural adjustments, and eye movements, as well as more restricted patterns created by movement of body parts in the close extrapersonal space.
Primary Characteristics of the Responses of DM Cells
From the earliest experiments of this series, we noticed three obvious characteristics of recordings obtained in area DM: the preferences of most cells for large-field stimuli, the predominance of bidirectional responses, and the relatively common incidence of neurons with sharp selectivity for orientation and axis of motion. These characteristics make DM stand out both in comparison with our observations in other areas of the marmoset brain (studies in progress) and with the existing literature on the response properties of visual areas in other species (discussed separately below). In particular, it is notable that this triad of response properties represents the antithesis of the response characteristics observed in area MT, which is the other major ‘dorsal stream’ target of V1 projections. MT cells often respond poorly to moving patterns that encompass both the receptive field centre and the immediate surround (Allman et al., 1985), while being strongly direction selective but relatively broadly tuned for axis of motion and orientation (Baker et al., 1981; Maunsell and Van Essen, 1983). Thus, despite receiving most of their ‘feedforward’ inputs from cells located in the same V1 layer (layer 3C, or 4B of Brodmann's nomenclature), DM and MT seem to serve very distinct functions in visual processing. This functional specificity is also reflected in the fact that no double-labelled neurons are observed in layer 3C of V1 after injections of distinct fluorescent tracers in topographically corresponding regions of DM and MT (Vogt Weisenhorn et al., 1995). Finally, in contrast with MT, DM receives projections from other levels of layer 3, including both ‘blob’ and ‘interblob’ compartments (Vogt Weisenhorn et al., 1995; Beck and Kaas, 1998; Rosa et al., 2005), which relay inputs from both the magno- and parvocellular geniculocortical pathways (Petersen et al. 1988; Krubitzer and Kaas, 1990).
The simplest hypothesis to explain the preferential responses of DM neurons to long contours would be to postulate the convergence of many orientation-selective V1 cells, located along collinear regions of the V1 retinotopic map, onto single DM contours. Bidirectional cells with relatively narrow orientation selectivity and non-end-stopped receptive fields have been observed in our previous studies of areas V1 and V2 in the marmoset (Bourne et al., 2004; Lui et al., 2005), and these could correspond to the basic ‘building blocks’ of DM receptive fields. However, the results of our masking experiments (Fig. 14) argue against a model whereby DM cells perform a simple summation of inputs to an elongated receptive field. In many cells, the excitation induced by stimulation of the peripheral end-zones of the receptive fields was most evident when the central, most responsive part of the receptive field was masked. It is tempting to speculate that this type of response (Fig. 14A,B) could help signal the continuity of long contours and coarse textures in the background, in situations in which these are interrupted by foreground objects. Such a response property would require an ‘OR’-gate logic operation, likely to involve intrinsic connections within DM. Moreover, the responses of other cells (Fig. 14C) seem to imply that some form of isolinear facilitation may be created by horizontal intrinsic connections within DM, similar to phenomena observed in V1 (Kapadia et al., 2000), but on a larger scale. Feedback connections from DM could, on the other hand, help explain some response properties observed in V1, including the ability to interpolate over gaps in the visual field such as the blind spot (Fiorani et al., 1992) and long-range contextual modulation (Angelucci and Bullier, 2003). Finally, local inhibitory connections appear to be the most likely substrate for the generation of a population of sharply orientation-selective cells in DM, given the demonstrated role of similar mechanisms in V1 (Allison and Bonds, 1994; Crook et al., 1998).
Possible Roles of DM
The strength of surround inhibition (particularly, end-stopping) seems to be much lower in DM than in other visual areas involved in the early processing of visual inputs, such as V1, V2, V4 and MT (Petersen et al., 1980; Desimone and Schein, 1987; Hubel and Livingstone, 1987; Born and Tootell, 1991, 1992; Cavanaugh et al., 2002). This preference of DM neurons for large moving patterns, coupled to their sensitivity to relatively low spatial frequencies, seems to argue against a role in the fine analysis of shape. However, these same characteristics, in combination with sharp tuning for axis of motion/orientation, could make DM cells suited to monitor the positions of background contours and textures embedded in wide-field patterns elicited by body and eye movements, providing valuable signals for motor control. This information could be used in ‘ambient vision’ roles such as navigation, postural adjustments, avoidance of obstacles during locomotion and ‘online’ visual control of goal-directed motor acts. Thus, the present observations are compatible with the view of DM as a node in a subsystem of the ‘dorsal stream’ involved in monitoring the consequences of self-motion in relation to the environment, as proposed earlier on the basis of human neuroimaging and lesion studies (Rosa and Tweedale, 2001).
The lack of strong surround inhibition could also render DM neurons capable of responding strongly to optic flow patterns experienced during locomotion, a possibility that would be supported by the relative emphasis on peripheral representation in this area (Rosa and Schmid, 1995). Note, however, that unlike cells in the medial superior temporal area (MST), DM neurons tend not to respond well to random-dot field patterns (Baker et al., 1981), and that this area lacks a centrifugal direction bias, such as the one described in MST (Tanaka et al., 1986; Duffy and Wurtz, 1991). Thus, DM does not have some of the expected characteristics of an area involved primarily in the processing of heading during forward motion. It is still possible that DM contributes to the processing of optic flow patterns within a network of cortical areas, through its connections with MST and other motion-selective regions (Beck and Kaas, 1998). For example, for primates raised in man-made environments, signals provided by DM neurons could be involved in detecting patterns of retinal displacement elicited by self-motion relative to low spatial frequency components of the scene, such as wall corners, large stationary objects and caging. The clear bias observed in DM (where most cells favour near-vertical contours moving in horizontal or slightly oblique directions) may be linked to the prevalence of such contours in artificial environments. Functional imaging studies in humans reveal activation in the expected location of DM during simulations of wide-field roll and frontoparallel motion (Previc et al., 2000; Beer et al., 2002; Deutschlander et al., 2004; Tikhonov et al., 2004).
Finally, the response properties of DM neurons are also compatible with the idea that these cells can signal visual patterns created by movement of body parts in the close extrapersonal space. Regular forelimb reaching movements made by marmosets would fall well within the range of spatial frequencies and speeds that DM cells are able to code for with accuracy. In this context, the sharp motion tuning of DM cells could provide an accurate visual monitoring of limb position and motion. Whereas recordings in behaving marmosets are not yet available, an area in the corresponding location (V6) in macaques appears to be involved in providing visual signals for the control of limb movement, through its projections to areas in the caudal medial parietal lobe (Galletti et al., 2003).
Comparison with the Owl Monkey
Whenever comparisons are possible, our results proved to be in good agreement with earlier descriptions of functional response properties of DM cells in the owl monkey, despite the differences in species (including the potentially important issue of nocturnal versus diurnal habits), sample characteristics (our receptive fields did not extend as far peripherally as those studied by Baker et al., 1981), stimuli (gratings versus single bars and random-dot fields) and methods of analysis. In particular, both our results and those of Baker and colleagues indicate that DM cells have, on average, narrower orientation bandwidths in comparison with cells in other visual areas. However, our results add a twist to this picture by demonstrating a bimodal distribution of selectivity to orientation (and axis of motion), as revealed by the vector sum method. Thus, while many (type 1) DM units are similar to V1 units in terms of bandwidth, there is also a substantial population of cells (over half of the present sample) that shows narrower orientation selectivity. The average population tuning of DM type 1 cells (Fig. 3B) is also reminiscent of the results of similar analyses conducted in areas V2, V3 and MT of the macaque cortex (Maunsell and Van Essen, 1983; Burkhalter and Van Essen, 1986; Felleman and Van Essen, 1987), reflecting a common pattern among visual areas. These results indicate that the existence of a large population of narrowly tuned (type 2) neurons is one of the landmark functional characteristics of area DM. Also similar to Baker et al. (1981), we observed few strongly direction-selective cells in DM. Finally, our finding regarding the selectivity of DM neurons to very low spatial frequencies can be related to previous observations in the owl monkey, where DM neurons were found to require relatively large spots of light for consistent responses. The only obvious point of disagreement between our results and those of Baker and collaborators relates to the distribution of preferred stimulus velocities. While in the owl monkey the best stimulus velocities of DM neurons were reported to be around 50°/s, in the present sample responses to the maximum speeds tested (66°/s) were only observed at very low spatial frequencies. Typically, the best response was obtained at drift speeds below 20°/s. While it is possible that differences do exist between measurements obtained with single bars and gratings, measurements obtained with these two types of stimulus in visual areas of the macaque cortex tend to be in close agreement (e.g. V3; Felleman and Van Essen, 1987; Gegenfurtner et al., 1997). The possibility remains that the preference for higher velocities reported by Baker and colleagues is related to the more eccentric position of the receptive fields in their sample (average eccentricity = 18°, compared to 7.5° in the present sample). We note that their recordings in the medial area (M), which encompassed receptive fields that were on average even more eccentric (average 36°), revealed many cells with preferences for extremely high velocities (75–100°/s).
Comparison with Dorsal Extrastriate Areas of Old World Monkeys
The issue of the possible correspondence between DM and areas of the macaque monkey brain has been mainly discussed on the basis of visual topography and anatomical features such as location, myelination and connections with V1 (Rosa and Tweedale, 2001; Rosa et al., 2005). Given that several previous studies have addressed the response properties of neurons located in the dorsal extrastriate cortex anterior to V2 in the macaque monkey, the present observations allow us to add knowledge of functional response characteristics to the debate surrounding this issue. Earlier proposals (Krubitzer and Kaas, 1993; Beck and Kaas, 1999) suggested that the cortex corresponding to DM would encompass two of the subdivisions normally recognized in the dorsal extrastriate cortex of the macaque, namely ‘dorsal V3’ (V3d) and V3A. This hypothesis carried within it the corollary that V3d and V3A were both parts of the same area, rather than separate areas. More recently, Lyon and Kaas (2002a,b) have proposed that only V3A corresponds to DM. However, our current knowledge of the response properties of cells in DM in New World monkeys argues against both of these hypotheses.
First, there are marked differences in response properties between DM and V3A. For example, cells in V3A are reported to be similar to V1 cells in terms of their optimal spatial and temporal frequencies, and in showing predominantly low-pass temporal frequency selectivity (Gaska et al., 1988). In contrast, our results indicate that DM cells prefer significantly coarser spatial patterns, and that most cells have band-pass temporal response characteristics. Moreover, in a behaviour that is diametrically opposite to what we found in DM, the responses of the majority of V3A cells are strongly inhibited by gratings that extend beyond the boundaries of the classical receptive field. Indeed, most cells respond optimally to gratings that are much smaller than the receptive field defined on the basis of single moving bars (Gaska et al., 1987). Finally, while strong direction selectivity was found in only 6.9% of the DM cells, this response property is apparent in nearly one-quarter of V3A neurons (Gaska et al., 1988).
Comparisons of the functional characteristics of DM cells with those revealed by recent studies of the response properties of neurons in V3 reveal significant differences, as well as some similarities. The proportion of direction-selective neurons in the macaque V3, when assessed with quantitative methods, appears to be much higher than the one we observed in DM (25–40%; Felleman and Van Essen, 1987; Gegenfurtner et al., 1997; Adams and Zeki, 2001). Moreover, unlike in DM, neurons with strong end-stopping characteristics form a substantial proportion (20–25%) of the V3 population. Finally, orientation tuning curves of V3 cells reveal average half-bandwidths (at half height) of ∼30° (Felleman and Van Essen, 1987; Gegenfurtner et al., 1997), thus matching the characteristics of our V1 and DM type 1 populations. Cells with very narrow tuning, similar to the type 2 population we report, seem to be relatively rare. On the other hand, the spatial frequency selectivity of V3 cells tends to resemble our observations in DM, with most cells preferring low spatial frequencies (Gegenfurtner et al., 1997). In summary, given our current knowledge of the response properties of DM, it is very unlikely that a simple correspondence exists between this area and V3d, V3A, or both of these together.
More recently, it has been proposed that DM corresponds to area V6 of the macaque cortex (an area that partially overlaps with area PO of earlier studies; Rosa and Tweedale, 2001). Despite the similarities in pattern of afferent connections, location, architecture and visual topography, there is still a limited basis for comparing response properties in DM and V6. We note, however, that cells with unusually sharp orientation tuning were observed in the anterior bank of the macaque parietooccipital sulcus, a region which is now known to include V6 as well as a functionally related area, V6A (Galletti et al., 1991, 2003). However, qualitative estimates by the same investigators suggested a larger proportion of direction-selective cells in V6. A better grasp on the extent of similarities between New World and Old World monkeys would require more quantitative studies of the basic response properties of V6 cells, as well as of the activity of DM cells under conditions of visuomotor activity (Galletti et al., 1991, 1995).
Conclusions
The unique constellation of response properties of DM neurons validate the idea that different visual areas emphasize different aspects of an image, and hence the concept of functional specialization in extrastriate cortex. Although more research is clearly needed, our results are compatible with the notion of DM being part of a subsystem of the ‘dorsal stream’ involved in aspects of visual perception that are relevant for the ‘online’ control of eye and body movements (Gattass et al., 1990; Galletti et al., 2003; Rizollatti and Matelli, 2003). Finally, consideration of the response properties in the context of what is known about the visual areas of other species of monkey helps considerably to clarify the homologies in the primate cortex.
Funded by project grants received from the National Health and Medical Research Council and the Australian Research Council. Equipment support from the Clive and Vera Ramaciotti Foundation and the ANZ Charitable Trust is gratefully acknowledged.
References
Adams DL, Zeki S (
Allison JD, Bonds AB (
Allman JM, Kaas JH (
Allman J, Miezin F, McGuinness E (
Angelucci A, Bullier J (
Baker JF, Petersen SE, Newsome WT, Allman JM (
Beck PD, Kaas JH (
Beck PD, Kaas JH (
Beer J, Blakemore C, Previc FH, Liotti M (
Born RT, Tootell RB (
Born RT, Tootell RB (
Bourne JA, Rosa MGP (
Bourne JA, Tweedale R, Rosa MGP (
Bourne JA, Lui L, Tweedale R, Rosa MG (
Burkhalter A, Van Essen DC (
Cavanaugh JR, Bair W, Movshon JA (
Colby CL, Gattass R, Olson CR, Gross CG (
Crook JM, Kisvarday ZF, Eysel UT (
Desimone R, Schein SJ (
Deutschlander A, Bense S, Stephan T, Schwaiger M, Dieterich M, Brandt T (
Duffy CJ, Wurtz RH (
Felleman DJ, Van Essen DC (
Fiorani M Jr, Rosa MGP, Gattass R, Rocha-Miranda CE (
Fritsches KA, Rosa MGP (
Gattass R, Rosa MGP, Sousa APB, Piñon MC, Fiorani Junior M, Neuenschwander S (
Galletti C, Battaglini PP, Fattori P (
Galletti C, Battaglini PP, Fattori P (
Galletti C, Fattori P, Gamberini M, Kutz DF (
Galletti C, Gamberini M, Kutz DF, Fattori P, Luppino G, Matelli M (
Galletti C, Kutz DF, Gamberini M, Breveglieri R, Fattori P (
Gamberini M, Palmer SM, Bourne JA, Rajan R, Galletti C, Rosa MGP (
Gaska JP, Jacobson LD, Pollen DA (
Gaska JP, Jacobson LD, Pollen DA (
Gegenfurtner KR, Kiper DC, Levitt JB (
Hubel DH, Livingstone MS (
Kapadia MK, Westheimer G, Gilbert CD (
Krubitzer L, Kaas J (
Krubitzer LA, Kaas JH (
Leventhal AG (
Lui LL, Bourne JA, Rosa MGP (
Lyon DC, Kaas JH (
Lyon DC, Kaas JH (
Maunsell JH, Van Essen DC (
Neuenschwander S, Gattass R, Sousa APB, Piñon MC (
Petersen SE, Baker JF, Allman JM (
Petersen SE, Miezin FM, Allman JM (
Previc FH, Liotti M, Blakemore C, Beer J, Fox P (
Rizzolatti G, Matelli M (
Rosa MGP, Fritsches KA, Elston GN (
Rosa MGP, Palmer SM, Gamberini M, Tweedale R, Piñon MC, Bourne JA (
Rosa MGP, Schmid LM (
Rosa MGP, Tweedale R (
Rosa MGP, Tweedale R (
Sengpiel F, Troilo D, Kind PC, Graham B, Blakemore C (
Tanaka K, Hikosaka K, Saito H, Yukie M, Fukada Y, Iwai E (
Tikhonov A, Haarmeier T, Thier P, Braun C, Lutzenberger W (
Ungerleider LG, Mishkin M. (
Author notes
1Department of Physiology, Monash University, Clayton, VIC 3800, Australia and 2Monash University Centre for Brain and Behaviour, Monash University, Clayton, VIC 3800, Australia