


Abstract
Mice lacking dopamine D2 and D3 receptors and wildtype littermates were tested in a two-choice perceptual discrimination test that is dependent upon optimal functioning of the prefrontal cortex. Both mutants showed no deficits in attending to the perceptual stimuli or in shifting attention between stimulus dimensions. However, the performance of both mutants differed from the wildtype in different test phases. D2 mutants exhibited significant impairment in the first compound discrimination, indicating deficits in the initial acquisition of the task-governing rules. In contrast, D3 mutants performed significantly better in a set-shifting phase that required reversal learning. The higher response accuracy of D3 mutants was also accompanied by significantly increased response latency. A stereological assessment of test-induced expression of the c-fos gene in neurons of the anterior cingulate and prelimbic/infralimbic cortices revealed highest activation in D3 mutants, intermediate activation in wildtype and lowest activation in D2 mutants, indicating that response accuracy in the cognitive test correlates with the magnitude of prefrontal cortical activation regardless of which test phases revealed different performances. The study illustrates that dopamine differentially modulates prefrontal cortical activity during tasks requiring attention depending upon the type of D2-like receptor that is activated.
Introduction
The prefrontal cortex (PFC) plays an important role in cognitive control. It receives wide-ranging input and has elaborate intrinsic connections to process the information necessary to effectively guide performance in complex tasks. The PFC has the ability to actively maintain patterns of activity, and thus it can function not only as an attentional template, but also represent rules and goals that guide behavior (Miller and Cohen, 2001). The activity of the PFC is influenced by neuromodulatory systems that originate in the midbrain and hindbrain. Among them, midbrain dopaminergic (DA) input into the PFC plays an important role in maintaining and updating PFC representations (Miller and Cohen, 2001). These effects of DA are mediated by D1- and D2-like receptors, which are expressed either on the principal projection neurons that use glutamate as an excitatory neurotransmitter or on GABAergic interneurons (Goldman-Rakic, 1996). Hence, mesocortical DA input targets both pyramidal and local circuit neurons. Because different DA receptor subtypes are expressed in different populations of pyramidal and interneurons, DA can influence a vast repertoire of cortical circuits. For example, D1 and D2 receptors are expressed in different efferent populations of pyramidal neurons: Whereas the expression of D2 receptors is restricted to layer V corticocortical and corticostriatal neurons, the more abundant D1 receptor is found in corticocortical, corticostriatal and corticothalamic neurons of both superficial (II) and deep layers (V/VI) (Gaspar et al., 1995). Moreover, parvalbumin-expressing interneurons contain both D1 and D2 mRNA, but D2 mRNA is absent from calbindin-expressing interneurons (Le Moine and Gaspar, 1998). Since the majority of D2 receptors are found on GABAergic interneurons (Khan et al., 1998), these receptors may play a major role in modulating the activity of local inhibitory circuits. A specific role of D2 receptors as well as other D2-like receptors in cognitive function, however, remains to be established. For example, the anatomic distribution of D3 receptors suggests that this receptor subtype is preferentially linked to associative and limbic function (Morissette et al., 1998). Moreover, we have recently demonstrated that mice lacking both D2 and D3 receptors have spatial working memory deficits that are due to their decreased agonist-stimulated D1 receptor activity in the medial PFC (mPFC; Glickstein et al., 2002). The extent to which D3 receptors are involved in other cognitive functions involving the PFC, however, is still unknown.
In the present study, we sought to determine whether D2 and D3 receptor inactivation similarly or differentially affect the performance in tasks requiring sustained attention and hence, optimum functioning of the mPFC. Birrell and Brown (2000) described a two-choice discrimination attention-set-shifting task for rodents that enables investigations on the ability of the animal to acquire, maintain and shift attentional sets as well as the ability to alter behavior under reversal conditions. Bilateral lesions of the mPFC or the posterior parietal cortex of rats have been shown to selectively impair the performance of the animal in the extradimensional shift phase of the test (Birrell and Brown, 2000; Fox et al., 2003), and a recent study suggests that mPFC DA plays an important role modulating the ability to shift attention between different stimulus dimensions (Turnbridge et al., 2004). In the present study, we tested the performance of wildtype and D2 and D3 mutant mice in the attention-set-shifting test developed by Birrell and Brown (2000) and performed a quantitative immunocytochemical study to compare the test-induced c-fos responses of neurons in the mPFC. In contrast to the similar consequences of D2 and D3 receptor inactivation for spatial working memory, results of the present studies revealed differential effects of D2 and D3 receptor inactivation on both the performance in the cognitive task that requires sustained attention and the extent of task-induced neuronal activation in the mPFC.
Materials and Methods
Animals
All procedures involving the animals adhered to guidelines laid out in the Principles of Laboratory Animal Care of the National Institutes of Health and were approved by the Institutional Animal Care and Use Committees of Columbia University and the New York State Psychiatric Institute. Adult male congenic C57BL/6 mice lacking D2 and D3 receptors (Jung et al., 1999) and their wildtype littermates were used in this study. Wildtype and homozygous mutants were derived from cross-breeding of heterozygous mutants. After weaning the animals between postnatal day (P) 21 and P28, male animals of the same genotype, but derived from different litters, were group-housed (2 or 3 animals per cage) with unlimited access to food and water. Prior to testing at P60–P90, their food consumption was restricted so that their body weights were gradually reduced (over a period of 7–10 days) to 85% of their starting weight. The animals remained group-housed during the period of food restriction. Daily recordings of body weights during this period revealed that all animals housed in the same cage lost weight to the same (gradual) extent and fights over food were not observed. Thus, single housing of animals was not required during food restriction. Behavioral testing was conducted during the light phase of a 12 h light/dark cycle (lights on at 6.00 a.m.).
Attention Set-shifting Paradigm
These experiments were conducted using a test apparatus made of Plexiglas that resembled the housing cage (dimensions: 32 × 27 × 15 cm). One-third of the apparatus was separated from the remaining two-thirds by a sliding door and served as a holding box. Terracotta pots were used as digging bowls and their rims were scented with perfumed oil to produce a lasting odor. The bowls contained a small food pellet (Prolab Isopro RMH 3000; PMI Nutrition, Brendwood, MO) buried underneath different digging media. In each trial, two pots were placed adjacent to each other in the larger section of the test box.
Mice were first trained to dig in the (unscented) small bowls filled with woodchip cage bedding to retrieve a food reward deeply buried underneath the bedding. After this habituation period (which lasted 5 to 10 min), mice were subjected to an attention-set-shifting paradigm originally described by Birrell and Brown (2000). In this study, we used a modification of this test described by Fox et al. (2003). In this modification, the number of reversal phases is reduced from three to one. This ensured that all animals completed the entire five phases of the test, a situation not given when the test was extended to seven phases. Briefly, mice were first trained on two simple discriminations (SD) of either odor (patchouli/jasmine, mango/vanilla, tea rose/dewberry, fuzzy peach/woody sandlewood) or digging media of different textures (wood chips/alpha dry bedding, glass beads/Eppendorf tube lids, ribbon/yarn, shredded paper/shredded rubber) to a criterion of six consecutive correct trials. The order of the two SDs and relevant stimulus dimensions (odor or digging medium) were randomized across each genotype such that 50% of animals per genotype started the experiments with odor guiding the location of the food pellet and the remaining 50% of the animals started with digging medium as the relevant stimulus. No differences in stimulus dimension preference or the ability to ignore a particular stimulus dimension was observed between the three genotypes. After successful completion of the SD, mice performed the series of discriminations described by Birrell and Brown (2000) and Fox et al. (2003). Hence, after an SD between two odors or two digging media was presented, a compound discrimination (CD) followed in which a new dimension was added to the stimuli presented in the initial SD. This new dimension, however, is not a reliable indicator of the food location. The next test required an intradimensional shift of attention (IDS). The IDS is another CD in which both relevant and irrelevant stimuli are changed, but the previously relevant stimulus dimension (odor or digging medium) remains the same. This IDS was then subjected to reversal rules, i.e. the previously negative stimulus became a positive one but the irrelevant stimulus dimension was still not predicting the reward location. Finally, in a task requiring an extradimensional shift of attention (EDS), the formerly irrelevant dimension became relevant and the originally guiding dimension lost its predictive value. In all tasks, animals had to reach a criterion of six consecutive correct trials. During the course of the experiments, each sensory stimulus was used only once. All animals performed the entire series of tasks (including the habituation) in a single test session. The number of trials to criterion and the average time between stimulus presentation and response selection was computed, and the performance of the three different genotypes was first compared by an overall one-way analysis of variance (ANOVA; threshold of significance, α = 0.05) and significant differences were resolved post hoc using the Tukey–Kramer multiple comparisons test.
Immunocytochemistry and Stereological Analysis
One hour following completion of either the CD or the final EDS component of the attention set-shifting task, mice were deeply anesthetized with an intraperitoneal injection of ketamine (100 mg/kg) and xylazine (15 mg/kg) and perfused transcardially with 100 ml of 4% paraformaldehyde in 0.1 M phosphate buffer (PB; pH 7.4) at room temperature. Brains were postfixed for 1 h (in the same fixative) and cryoprotected overnight (30% sucrose in 0.1 M PB).
The expression of Fos immunoreactivity was analyzed in a series of adjacent, coronal, 40-μm-thick Microtome sections that were collected every 200 μm from 6.5 to 1.5 mm rostral to bregma. One section of each pair was mounted directly onto gelatin-coated microscope slides, dehydrated, and counterstained with 0.25% thionin. The remaining free-floating sections were processed to detect Fos-immunoreactivity. Non-specific staining was reduced by first incubating sections for 30 min in 0.1 M PB containing 0.5% bovine serum albumin (BSA). Sections were then incubated overnight at 4°C with a rabbit polyclonal antibody directed against the Fos protein (Ab-5; 1:10 000; Oncogene Sciences, Boston, MA) dissolved in PB containing 0.1% BSA and 0.25% Triton X-100. After incubation with primary antibody, sections were incubated for 30 min with biotinylated goat anti-rabbit IgG (1:400 in PB containing 0.1% BSA; Vector Laboratories, Burlingame, CA), followed by a 30-min incubation in avidin-biotin-peroxidase complex (Vectastain Elite Kit; 1:100 in PB; Vector Laboratories). To visualize bound immunoperoxidase, sections were incubated for 6 min in 0.022% 3,3′-diaminobenzidine (DAB; Aldrich, Milwaukee, WI) and 0.003% hydrogen peroxide in PB. All sections were rinsed in PB and mounted onto gelatin-coated slides.
All tissues were processed within 3 days of perfusion. In some experiments, tissues of all three genotypes subjected to the same behavioral test paradigm (CD or EDS) were processed in parallel and in other experiments, tissues of a single genotype subjected to both testing paradigms were processed in parallel, and consistent results were obtained for sections processed at different times. The intensity of the DAB immunoreaction product ranged from a paler brown to a deep brown color in all genotypes and treatment groups.
To obtain a quantitative estimate of the numbers of mPFC neurons expressing Fos immunoreactivity in wildtype and D2 and D3 single mutants, a stereologic counting method was used. For this analysis, a Zeiss Axioplan 2 photomicroscope (Oberkochen, Germany) equipped with a Dage-MTI (Michigan City, IN) DC-330 CCD camera and Ludl motorized stage, interfaced with a Gateway Athlon computer and StereoInvestigator (MicroBrightField, Wiliston, VT) was used.
The stereologic analysis was conducted on brain sections obtained from 4–6 mice per genotype. For each case, the thionin-labeled series of sections was used to identify the boundaries between layers II/III and V/VI. Total numbers of Fos-immunolabeled neurons were determined in three subregions of the mPFC, the infralimbic (IL), prelimbic (PL) and the anterior cingulate (AC) cortices (Hof et al., 2000). In addition, Fos-positive nuclei were counted in one subregion of the somatosensory cortex (barrel fields, SSbf) to establish a reference for general brain activation so that the magnitude of solely task-induced neuronal activation in the mPFC could be determined.
Stereological measures were taken from three (IL) or six (PL, AC and SSbf) sections from the series, using an unbiased stereologic method, the optical fractionator (West et al., 1991). Optical disector frame and counting grid sizes of 45 and 75 μm2, respectively, were chosen to permit systematic-random sampling of >3 neurons within an 8 μm focusing range for each sampling field. All sampling parameters were set such that at least 200 neurons per region were sampled in the cases with lowest Fos expression. This yielded an average of 498 for superficial or deep layers of mPFC regions and 1171 for SSbf, and resulted in an intrasample coefficients of error (CE), calculated as described previously (Schmitz and Hof, 2000), that were always <0.05. There were no significant differences in CE values across genotypes and testing conditions. All regions were sampled at high magnification in Koehler illumination conditions using a Zeiss 63× Plan-Apochromat objective. The volume of the different laminar domains of interest in each of three mPFC regions and the entire SSbf was estimated using the Cavalieri principle. Because there were no differences in regional volumes as well as the number of neurons and glia between the three genotypes studied here (Glickstein et al., 2002), the extent of Fos-labeling was expressed as the number of Fos-immunoreactive neurons per 0.1 mm3 so that the net activation per region could be compared across genotypes and test conditions. Hence, we report here densities of Fos-labeled neurons that were calculated by dividing the mean number of Fos-labeled neurons of each group by the average volume of the corresponding region. The estimated total numbers of Fos-labeled neurons ranged from: 1.07 × 10⁴ to 3.84 × 10⁴ (AC II/III), 1.19 × 10⁴ to 4.63 × 10⁴ (AC V/VI), 4.6 × 10³ to 1.64 × 10⁴ (PL/IL II/III), 7.01 × 10³ to 2.60 × 10⁴ (PL/IL V/VI), and 3.16 × 10⁴ to 5.13 × 10⁴ (SSbf).
For statistical analysis of the stereological data, a one-way ANOVA (threshold of significance, α = 0.05) was performed, and significance of differences was analyzed post hoc using the Student–Newman–Keuls multiple comparisons test.
For fluorescence microscopy, additional sections were incubated in 0.5% BSA in PB, followed by immersion in primary antibody solutions as described except that the antibody directed against the Fos protein was used at a higher dilution (1:15 000). Sections were washed in PB containing 0.25% Triton X-100 and incubated with a fluorescein isothiocyanate-conjugated goat anti-rabbit IgG secondary antibody (dilution 1:200; Vector Laboratories) for 1 h at room temperature, washed in PB containing 0.25% Triton X-100, mounted onto gelatin-coated slides, air-dried and processed for light-microscopic viewing. Portions of the mPFC at 1.7 mm rostral to bregma were photographed at 10× magnification using the Zeiss Axiocam camera attached to a Zeiss Axiophot 2 microscope. Images were processed using Open Lab (Improvision, Lexington, MA) and Adobe Photoshop (version 6.0) software. Adjustments to image brightness and contrast were made for clarity of publication, but the resultant images reflect the experimental data.
Results
Performance of Wildtype and D2 and D3 Mutants in an Attention-set-shifting Test
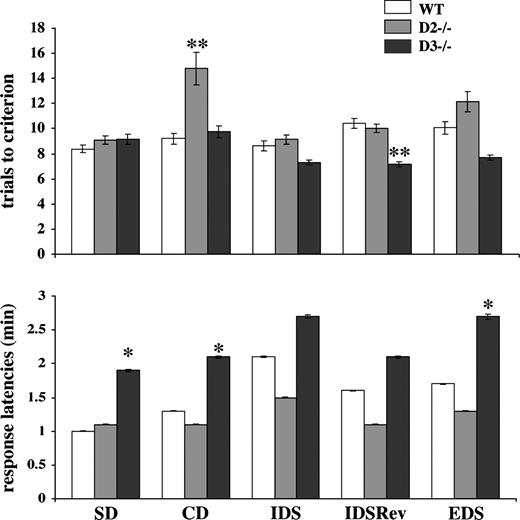
To examine the ability of D2 and D3 mutants and their wildtype littermates to acquire, maintain, and shift attentional sets as well as to test their ability to alter behavior under reversal conditions, we employed the attention-set-shifting test originally developed by Birrell and Brown (2000) and later modified by Fox et al. (2003) (see Materials and Methods). Figure 1 (top) summarizes the number of trials to the criterion of six consecutive correct trials for SD, CD, IDS, IDSRev, and EDS components of this test. In the SD, wildtype animals reached this criterion after a mean of 8 trials and completed the CD and IDS with a mean of nine trials. The more demanding tasks, IDSRev and EDS, were completed after a mean of 10 trials.
Number of trials to criterion (top) and average response latencies per trial (bottom) of wildtype (WT) and homozygous D2 and D3 mutants performing the attention-set-shifting task. The individual phases of the attention-set-shifting task are indicated on the bottom of the graph. Data represent means ± SEM of determinations made from a total of 20 (SD, CD) or 14 animals (IDS, IDSRev, EDS) per genotype. *P < 0.05 compared with wildtype. **P < 0.03 compared with wildtype and D2 mutants.
An overall statistical analysis of variance (ANOVA) of the number of trials to criterion indicated significant differences [F(14,125) = 2.2, P < 0.01]. For D2 mutants, post hoc Tukey–Kramer multiple comparisons test revealed a significant impairment (P < 0.03) in the CD portion of the task for which nearly twice as many trials were needed to reach the criterion compared with wildtype. However, once D2 mutants completed the CD, they proceeded through IDS, IDSRev and EDS in a manner indistinguishable from wildtype (Fig. 1, top).
Different results were obtained with D3 mutants. Whereas their number of trials to criterion in the SD and CD did not differ from wildtype, they exhibited a slightly better performance in the more difficult IDS, IDSRev and EDS, and a post hoc Tukey–Kramer multiple comparisons test revealed that their performance in the IDSRev was significantly better compared with wildtype (P < 0.03).
Figure 1 (bottom) compares the average response latencies of wildtype and mutants in all five components of the task. This response latency reflects the time between releasing the animal from the holding box and the initiation of digging for the food pellet, and an overall analysis of variance (ANOVA) indicated significant differences between them [F(14,125) = 8.7, P < 0.0001]. Post hoc Tukey–Kramer multiple comparisons revealed that, although the response latencies of D2 mutants are shorter for the IDS, IDSRev and EDS phases of the test compared with wildtype and D3 mutants, none of these differences reach statistical significance. In contrast, the response latencies of D3 mutants are longer in all five phases of the test, and their response latencies measured for the SD, CD and EDS phases of the test are significantly longer (P < 0.05) compared with wildtype and D2 mutants (Fig. 1, bottom).
We have previously shown that D2 mutants have spatial working memory deficits that are due to decreased prefrontal cortical D1 receptor activity, and that a single dose of methamphetamine (METH) rescued both the decreased agonist-promoted D1 receptor function as well as the working memory deficits of these mutants in a long-term manner (Glickstein et al., 2002). As shown in Table 1, however, an identical pharmacological manipulation with METH did neither affect the (impaired) performance of D2 mutants in the CD phase of the test nor did it alter the performance of wildtype and D3 mutants. In fact, when mice were treated with a single dose of METH (5 mg/kg) 1 week prior to testing, their number of trials to criterion were either similar (D3 mutants) or non-significantly higher (wildtype and D2 mutants) compared with the corresponding non-treated genotypes [wildtype: F(1,25) = 1.52, P = 0.23; D2 mutants: F(1,25) = 0.56, P = 0.5; D3 mutants: F(1,26) = 0.15; P = 0.7]. Moreover, pretreatment with methamphetamine did not significantly affect the response latencies of either genotype [wildtype: F(1,16) = 0.39, P = 0.5; D2 mutants: F(1,24) = 0.42, P = 0.5; D3 mutants: F(1,20) = 0.74; P = 0.4; Table 1].
Performance of drug-naive and methamphetamine-pretreated wildtype and D2 and D3 mutants in the first compound discriminationa
| Trials to criterion | Response latencies (min) | |
|---|---|---|
| Wildtype (drug naive) | 9.21 ± 1.05 | 1.27 ± 0.14 |
| Wildtype (METHb) | 11.5 ± 1.4 | 1.15 ± 0.13 |
| D2–/– (drug naive) | 14.8 ± 2.4 | 1.06 ± 0.09 |
| D2–/– (METH) | 17.3 ± 2.4 | 1.0 ± 0.10 |
| D3–/– (drug naive) | 9.8 ± 1.1 | 2.1 ± 0.20 |
| D3–/– (METH) | 9.1 ± 1.2 | 1.9 ± 0.10 |
Data represent means ± SEM of determinations made in 13 to 19 drug-naive and 11 to 14 methamphetamine-treated animals per genotype.
Methamphetamine (5 mg/kg) was administered 1 week prior to testing.
To further test whether the longer response latencies of D3 mutants are specific to the test and not due to generally decreased locomotor activity, motivation, or increased anxiety, we conducted a series of experiments that compared the response latency of wildtype and D3 mutants in three different tests that do not require discriminating between the two different stimulus dimensions (odor and digging medium). As summarized in Table 2, the response latencies between wildtype and D3 mutants did not differ in a simple reaction time task, i.e. a task that measured the latency between releasing the animal from the holding box and beginning of the digging response in a non-scented bowl containing a food pellet covered under familiar bedding medium. In another task, the ‘high effort task’, one of two non-scented bowls was not baited with food and placed on the bottom of the test chamber (and hence, it was easy to reach) whereas the other bowl was baited, but placed on top of a 10-cm-high wooden block. Its access was thus more difficult and also more anxiety provoking due to its elevated, free-standing position. In this test, the time between holding-box release and digging for food in the elevated bowl also did not differ between the two genotypes (Table 2). Finally, the ‘high effort task’ was further modified by introducing a distractor, namely non-consumable dust of food pellets added to the bedding medium of the floor bowl, but only the elevated bowl contained eatable food (forced choice task). Again, no significant differences in response latencies of the two genotypes were found (Table 2).
Response latencies of wildtype and D3 mutants in the simple reaction time task, a task with high-effort demanding correct choice, and a task with high-effort demanding correct choice in the presence of a distractor (forced choice)a
| Task | Response latency (s) Wildtype | D3–/– |
|---|---|---|
| Simple reaction time | 15.5 ± 1.6 | 14.7 ± 1.6 |
| High effort task | 39.3 ± 3.1 | 36.7 ± 2.6 |
| Forced choice task | 84.9 ± 9 | 96.6 ± 8.4 |
| Task | Response latency (s) Wildtype | D3–/– |
|---|---|---|
| Simple reaction time | 15.5 ± 1.6 | 14.7 ± 1.6 |
| High effort task | 39.3 ± 3.1 | 36.7 ± 2.6 |
| Forced choice task | 84.9 ± 9 | 96.6 ± 8.4 |
For each task, data represent means ± SEM of determinations made in 5–6 animals per genotype. The number of trials per mouse were 5 (simple reaction time), 10 (high effort task) and 10 (forced choice task). In the high effort task, mice of both genotypes made 100% correct choices. In the forced choice task, wildtype made 60% correct choices and D3 mutants made 84% correct choices (of a total of 60 trials).
Altogether, these data indicate that the prolonged response latencies of D3 mutants are not due to a generally decreased task-related locomotor activity, decreased reward expectancy (motivation), or increased anxiety (see the ‘high effort task’). In fact, their prolonged response latencies are only evident in tests that require discriminating between different stimulus properties and dimensions.
Additional experiments also revealed that the response selection of both wildtype and D3 mutants is equally and strongly guided by the relevant stimulus (odor or medium), and hence not by a sense of smell derived from the food pellet: after successful completion of the CD, the food pellet was removed from the bowl that contained the relevant stimulus and animals were allowed to approach the bowls one more time. Despite the absence of the food pellet, 80% of the animals chose the correct (but non-baited) bowl [n = 10 (wildtype) and n = 13 (D3 mutants) (not shown)]. Finally, in the SD, 60 and 63% of wildtype and D3 mutants, respectively, corrected a bowl-selection error in the subsequent trial after a 2 min delay period (one-trial learning) and maintained correct responses in the following trials.
In summary, mice lacking D2 receptors exhibit specific deficits in the acquisition of rules that govern the task when two stimulus dimensions and four stimulus properties are presented together (CD). The performance of D3 mutants, however, is significantly increased in the task that requires flexibility to reversal conditions (IDSRev). Moreover, the increased response accuracy of D3 mutants occurs together with increased response latencies when compared with wildtype and D2 mutants.
Basal and Test-induced Expression of Fos Immunoreactivity in the PFC
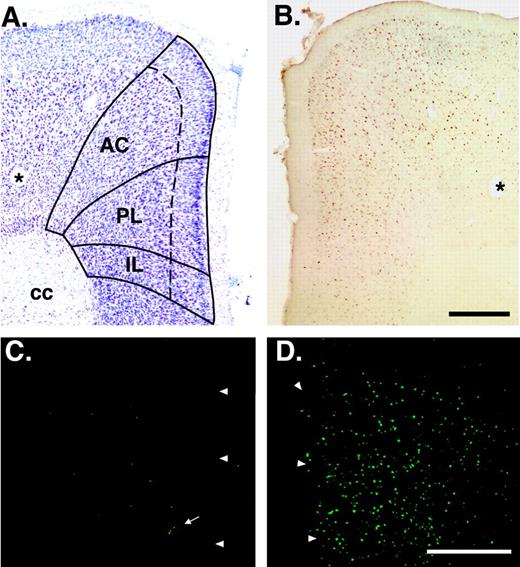
The following experiments used immunocytochemistry to examine task-induced expression of neuronal Fos immunoreactivity. Under basal conditions, the expression of Fos-immunoreactivity of non-tested wildtype and D2 and D3 mutant mice fed ad libitum is extremely low. There are typically fewer than five Fos-immunolabeled nuclei in the cortex in a field of view of 10× magnification (Fig. 2). After completion of the attention-set-shifting test, however, robust expression of Fos immunoreactivity was detected in both superficial and deep layers of the mPFC, and in several other brain regions, including orbital, motor and somatosensory cortices, hippocampus, dorsal striatum, nucleus accumbens, thalamus, hypothalamus and cholinergic nuclei.
Basal expression of Fos immunoreactivity in the mPFC of wildtype with and without food-restriction. (A) The cytoarchitecture of the PFC visualized in a photomicrograph of a thionin-labeled cross-section taken at 5.5 mm rostral to the interaural line (Hof et al., 2000). Solid lines demarcate three subregions of the mPFC and the dashed line indicates the boundary between layers II/III and V/VI. (B) Adjacent section processed to detect Fos immunoreactivity with the DAB reaction product. The asterisk indicates a blood vessel detected in adjacent sections. (C) Expression of Fos immunoreactivity in the mPFC of wildtype fed ad libitum. Arrowheads indicate the outer border of the section. (D) Expression of Fos immunoreactivity in food-restricted wildtype 1.5 h after the scheduled feeding. There are significantly more Fos-immunoreactive neurons in food-restricted mice compared with mice fed ad libitum. AC, anterior cingulate cortex; PL, prelimbic cortex, IL; infralimbic cortex; cc, corpus callosum. Scale bars, 0.5 mm.
Our behavioral paradigm required food restriction, and hence altered the behavior of the animal in the home cage. Compared with mice fed ad libitum, food-restricted mice exhibit a pronounced increase in horizontal and vertical locomotor activity, and they show species-specific signs of active foraging which peak around the scheduled feeding time (1 pm). Thus, to distinguish between task-induced c-fos induction and a general increase in Fos expression elicited by foraging, we first evaluated basal c-fos expression in food-restricted mice that were not subjected to the behavioral test. The brains of these mice were removed 1.5 h after the usual feeding, i.e. at a time when the attention-set-shifting paradigm would normally be completed.
Our analysis focused on the mPFC. The top panel of Figure 2 illustrates the anatomic topography and cytoarchitecture of the mouse mPFC revealed by thionin-counterstaining of a coronal section taken 5.5 mm rostral to the interaural line (Fig. 2A), and a corresponding DAB-stained section illustrating the expression of Fos immunoractivity in wildtype (Fig. 2B). The bottom panels of Figure 2 show the expression of Fos immunofluorescence at the same rostrocaudal level in coronal sections of wildtype. Compared with mice fed ad libitum (Fig. 2C), the numbers of neurons expressing Fos-immunofluorescence and the intensity of labeling is substantially enhanced in food-restricted mice (Fig. 2D). Therefore, in order to determine the true magnitude of task-specific induction of expression of the c-fos gene, we conducted a detailed analysis of the numbers of Fos-immunoreactive nuclei in food-restricted mice with and without behavioral testing.
We used the optical fractionator to obtain a quantitative estimate of the numbers of mPFC neurons expressing Fos-immunoreactivity, calculated the densities of Fos-labeled neurons for each region (see Materials and Methods), and subtracted the regional densities calculated for food-restricted, but non-tested animals from corresponding densities obtained from animals subjected to the behavioral test. The measures for PL and IL were combined to allow for the sampling of at least 200 Fos-positive neurons within all genotypes so that the sampling parameters used for the AC, SSbf and PL/IL were identical.
There were no significant differences between genotypes in the volumes of any of the regions measured. Microscopic inspection of thionin-stained sections revealed no differences in the cytoarchitecture of the regions analyzed. Moreover, as previously reported for the same lines of mice used in this study, there are no differences between wildtype and mutants in the numbers of neurons or glia in the mPFC (Glickstein et al., 2002).
The mean densities of Fos-immunoreactive neurons in food restricted, non-tested mice determined for two laminar territories of each of two regions of the mPFC and the SSbf are summarized in Table 3. It is evident that food-restriction alone elevates Fos immunoreactivity substantially. A statistical analysis of variance (ANOVA) between genotypes revealed that, although there is a significantly greater density of Fos-positive neurons in the superficial AC of food-restricted D3 mutants relative to wildtype [F(2,12) = 5.6; P < 0.05], both D2 and D3 mutant mice had significantly reduced densities of Fos-immunolabeled neurons in the SSbf compared with food-restricted wildtype [F(2,12) = 5.95; P < 0.05].
Stereological assessment of the densities of Fos-immunoreactive neurons in the mPFC and somatosensory barrel fields of food-restricted, non-tested, CD- and EDS-tested wildtype (WT), and D2 (D2–/–) and D3 (D3–/–) mutantsa
| AC II/III | AC V/VI | PL/IL II/III | PL/IL V/VI | Somatosensory barrel fields II–VI | |
|---|---|---|---|---|---|
| Baseline | |||||
| WT | 35.4 ± 2.7 | 25.7 ± 1.0 | 33.8 ± 2.6 | 26.9 ± 1.7 | 33.1 ± 1.7 |
| D3–/– | 50.8 ± 5.4* | 33.2 ± 4.6 | 34.9 ± 1.4 | 24.7 ± 1.1 | 27.8 ± 1.3** |
| D2–/– | 42.2 ± 2.5 | 28.7 ± 1.7 | 29.7 ± 3.0 | 25.0 ± 2.0 | 26.5 ± 1.1** |
| CDb | |||||
| WT | 55.3 ± 5.2 | 31.6 ± 3.6 | 50.6 ± 6.5 | 32.2 ± 4.2 | 29.5 ± 2.1 |
| D3–/– | 62.8 ± 5.8 | 33.6 ± 2.3 | 50.5 ± 3.8 | 32.2 ± 2.7 | 33.3 ± 2.5 |
| D2–/– | 32.4 ± 3.6 | 22.1 ± 1.4 | 29.3 ± 3.0 | 23.1 ± 2.1 | 31.3 ± 2.9 |
| EDSb | |||||
| WT | 52.3 ± 8.8 | 37.2 ± 6.9 | 62.4 ± 6.6 | 41.9 ± 4.7 | 38.3 ± 3.9 |
| D3–/– | 96.8 ± 8.4 | 78.3 ± 9.1 | 117.4 ± 8.8 | 82.7 ± 8.7 | 40.0 ± 6.5 |
| D2–/– | 31.4 ± 3.1 | 27.1 ± 2.3 | 41.9 ± 4.3 | 23.5 ± 1.8 | 40.3 ± 4.3 |
Mean densities (number of Fos-labeled neurons/ 0.1 mm3) ± SEM of neurons expressing Fos immunoreactivity in the superficial (II/III) or deep (V/VI) layers in AC, PL and IL or in the barrel fields are shown.
Statistical comparisons of densities of Fos-labeling detected after CD and EDS testing are shown in Figure 4.
F(2,12) = 5.60; P < 0.05;
F(2,12) = 5.95; P < 0.05.
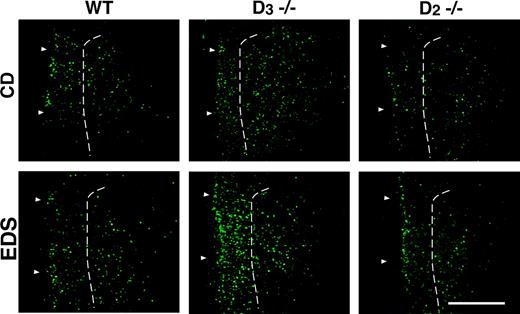
Expression of Fos Immunoreactivity in the PFC CD- and EDS-tested Mice
In order to determine the extent to which sustained attention required during the entire attention-set-shifting task elicits region-specific neuronal activation, the expression of Fos immunoreactivity in the mPFC and the SSbfs of wildtype and mutants was examined 1h after completion of the last phase of the test, the EDS. Moreover, because of the specific deficits of D2 mutants during the CD-phase of the test, additional experiments compared the expression Fos-immunoreactivity 1 h after completion of the CD.
Figure 3 illustrates Fos-immunofluorescence detected in the mPFC of mice after CD (top panel) or EDS testing (bottom panel). Compared with non-tested (food-restricted) mice (Fig. 2D), the number of Fos-labeled neurons is increased in CD-tested wildtype (Fig. 3, top left) and D3 mutants (Fig. 3, top center), especially in superficial mPFC layers. In CD-tested D2 mutants, however, no apparent increase was detected (Fig. 3, top right). Similar results were obtained for EDS-tested mice (Fig. 3, bottom).
Expression of Fos immunoreactivity in the mPFC of wildtype (WT) and D2 and D3 mutants 1 h following the completion of either CD or EDS phases of the test. Top, In CD-tested wildtype and D3 mutants, the number of Fos-expressing neurons is higher compared with D2 mutants. Bottom, Fos-labeling in mice 1 h after completion of the EDS phase of the test. Like in CD-tested mice, the expression of Fos immunoreactivity is higher in wildtype and D3 mutants when compared with D2 mutants. In both cases, Fos-labeling is highest in D3 mutants, intermediate in wildtype, and lowest in D2 mutants. Arrowheads mark the outer edge of the tissue sections and the dashed line indicates the boundary between layers II/III and V/VI. Scale bar, 0.5 mm.
The densities of Fos-positive neurons in the PFC of CD- and EDS-tested mice were determined using the optical fractionator as described above, and the mean densities calculated for CD- and EDS- tested animals are summarized in Table 3. To obtain an estimate of the extent of task-induced neuronal activation, the baseline values of food-restricted, non-tested animals (Table 3) were subtracted from corresponding values obtained from tested animals. A comparison of these results is shown in Figure 4. Figure 4A summarizes the mean regional densities of Fos-positive nuclei in CD-tested animals. In wildtype, CD-testing resulted in increased expression of Fos immunoreactivity in the mPFC, but not in the SSbfs. This increase was greater in superficial than deeper layers of the entire mPFC [F(2,13) = 24.75; P < 0.001]. In D3 mutants, CD-testing resulted in elevated c-fos expression in the superficial layers of AC, and in both superficial and deep layers of PL/IL, and the magnitude of this increase is similar to that measured in wildtype. However, in contrast to wildtype, c-fos was not induced in the deeper layers of AC. Moreover, in the SSbf, D3 mutants exhibited a 1.4-fold greater increase in Fos expression compared with CD-tested wildtype. This difference, however, does not reach statistical significance.
![Stereological comparison of the densities of Fos-immunoreactive neurons in the mPFC and in the barrel fields of the somatosensory cortex (SSbf) of wildtype (WT) and D2 (D2–/–) and D3 (D3–/–) single mutants 1 h after CD and EDS testing. To compare solely the proportions of neurons activated by the test paradigm, the average baseline density of Fos-immunoreactive neurons of food-restricted mice, but non-tested animals (see Table 3) has been subtracted from corresponding densities determined for tested animals. The graphs show these adjusted mean densities (number of Fos-labeled neurons/ 0.1 mm3) ± SEM of neurons expressing Fos immunoreactivity in the superficial (II/III) or deep (V/VI) layers of the IL, PL and AC cortices and the SSbf. (A) Comparison of the densities of Fos-immunoreactive neurons calculated for CD-tested wildtype and D2 and D3 mutants. Although CD-tested D2 and D3 single mutants have increased densities of Fos-labeling in the SSbf compared with wildtype. D2 mutants express significantly less mPFC Fos immunoreactivity compared with either D3 mutants or wildtype. Data were compared using a one-way analysis of variance [AC II/III: F(2,12) = 9.6; AC V/VI: F(2,12) = 5.8; PL/IL II/III: F(2,12) = 4.2; PL/IL V/VI: F(2,12) = 2.5; SSbf: F(2,12) = 4.0] and significant differences compared with wildtype were resolved post hoc using the Student–Neuman–Keuls multiple comparisons test (*P < 0.05; **P < 0.01). (B) Comparison of the densities of Fos-immunoreactive neurons calculated for EDS-tested wildtype and D2 and D3 mutants. Compared with non-tested or CD-tested mice, Fos-immunolabeling in EDS-tested mice is increased in wildtype and D3 mutants, but not in D2 mutants. Moreover, compared with wildtype, the number of neurons expressing Fos immunoreactivity is significantly higher in D3 mutants. Data were compared as described in (A) (AC II/III: F(2,15) = 23.9; AC V/VI: F(2,15) = 22.6; PL/IL II/III: F(2,15) = 18.3; PL/IL V/VI: F(2,15) = 16.9] and significant differences compared with wildtype, determined post hoc, are indicated (*P < 0.05, **P < 0.001; n = 5 mice/genotype for baseline and CD and n = 6 mice/genotype for EDS testing).](https://oup.silverchair-cdn.com/oup/backfile/Content_public/Journal/cercor/15/7/10.1093/cercor/bhh202/2/m_cercorbhh202f04_ht.jpeg?Expires=1716545369&Signature=uL70X6xKWO7~e-~K1Zdz~kC~oZ5W7PDGx1~GqQGguoo45wGUaER9S5d7Ansqi2qs4dS9ADFHVU-Q8gFBNx6R4VCOnfyWKFrXfakNi9FfwtkYjefbCoQu77QO-VVTKAaKX51RskXYh9yi4DRecZewidYWsk2gazeaU3LYfOQ1IDuydg6vk-7zykW5addg3XNFsRNBRQxUJJLu3BliScK56Gq1LLY2~pHPnYMhdHpAGQc25EPGqtz0OwMsCIkuw9pHFFMzTERXvWbTnDr~QUc1ZwgaGfK1t7Lf6eRx-j1mNCcDtBmko0-E8lNHjQKEka7rAHC0GGdxF4k4eUfNrB8Paw__&Key-Pair-Id=APKAIE5G5CRDK6RD3PGA)
Stereological comparison of the densities of Fos-immunoreactive neurons in the mPFC and in the barrel fields of the somatosensory cortex (SSbf) of wildtype (WT) and D2 (D2–/–) and D3 (D3–/–) single mutants 1 h after CD and EDS testing. To compare solely the proportions of neurons activated by the test paradigm, the average baseline density of Fos-immunoreactive neurons of food-restricted mice, but non-tested animals (see Table 3) has been subtracted from corresponding densities determined for tested animals. The graphs show these adjusted mean densities (number of Fos-labeled neurons/ 0.1 mm3) ± SEM of neurons expressing Fos immunoreactivity in the superficial (II/III) or deep (V/VI) layers of the IL, PL and AC cortices and the SSbf. (A) Comparison of the densities of Fos-immunoreactive neurons calculated for CD-tested wildtype and D2 and D3 mutants. Although CD-tested D2 and D3 single mutants have increased densities of Fos-labeling in the SSbf compared with wildtype. D2 mutants express significantly less mPFC Fos immunoreactivity compared with either D3 mutants or wildtype. Data were compared using a one-way analysis of variance [AC II/III: F(2,12) = 9.6; AC V/VI: F(2,12) = 5.8; PL/IL II/III: F(2,12) = 4.2; PL/IL V/VI: F(2,12) = 2.5; SSbf: F(2,12) = 4.0] and significant differences compared with wildtype were resolved post hoc using the Student–Neuman–Keuls multiple comparisons test (*P < 0.05; **P < 0.01). (B) Comparison of the densities of Fos-immunoreactive neurons calculated for EDS-tested wildtype and D2 and D3 mutants. Compared with non-tested or CD-tested mice, Fos-immunolabeling in EDS-tested mice is increased in wildtype and D3 mutants, but not in D2 mutants. Moreover, compared with wildtype, the number of neurons expressing Fos immunoreactivity is significantly higher in D3 mutants. Data were compared as described in (A) (AC II/III: F(2,15) = 23.9; AC V/VI: F(2,15) = 22.6; PL/IL II/III: F(2,15) = 18.3; PL/IL V/VI: F(2,15) = 16.9] and significant differences compared with wildtype, determined post hoc, are indicated (*P < 0.05, **P < 0.001; n = 5 mice/genotype for baseline and CD and n = 6 mice/genotype for EDS testing).
A comparison of the sum of all densities (without subtracting baseline activation) calculated for the entire AC and PL/IL after CD testing revealed a differential extent of dorsal versus ventral PFC activation in wildtype and D3 mutants. In wildtype, the density of Fos-immunolabeled neurons in the AC exceeds that in the PL/IL by 17%. In D3 mutants, however, Fos-immunoreactive neurons are more densely packed in the PL/IL where they exceed AC activation by >50%.
Remarkably, in D2 mutants, CD-testing did not elevate c-fos expression above the already elevated baseline expression and the slightly decreased densities of Fos-labeled neurons that are evident in Figure 4A are not significantly different from corresponding baseline densities. In the AC, however, the densities of Fos-immunoreactive neurons of CD-tested D2 mutants were significantly lower when compared with wildtype [AC II/III, F(2,12) = 9.64, P < 0.01; AC V/VI, F(2,12) = 5.83, P < 0.05]. Despite the absence of CD-induced c-fos expression in the mPFC of D2 mutants, their densities of Fos-positive neurons in the SSbfs were increased relative to wildtype [F(2,12) = 4.03, P < 0.05].
The mean regional densities of Fos-immunoreactive neurons determined after EDS testing are plotted in Figure 4B. In EDS-tested wildtype, the expression of Fos immunoreactivity exceeded baseline and CD-test values in all regions examined. In EDS-tested D3 mutants, the extent of c-fos-induction in all regions of the mPFC was significantly increased when compared with wildtype [AC II/III, F(2,15) = 23.93, P < 0.001; AC V/VI, F(2,15) = 22.57, P < 0.01; PL/IL II/III, F(2,15) = 18.37, P < 0.001; and PL/IL V/VI, F(2,15) = 16.93, P < 0.001]. The induction of c-fos in the SSbfs surpassed baseline values determined for food-restricted, non-tested D3 mutants, but did not significantly differ from wildtype and CD-tested D3 mutants despite the large increase in mPFC Fos immunoreactivity. Similar to the differential relative activation of the AC and PL/IL detected after CD testing, wildtype animals still displayed a greater activation of neurons in the AC (>50%) compared with PL/IL regions. However, c-fos is expressed uniformly throughout the mPFC of D3 mutants.
In EDS-tested D2 mutants, the expression of mPFC Fos immunoreactivity does not rise above baseline values, and is substantially lower compared with EDS-tested wildtype. These differences are significant in the entire AC of D2 mutants [AC II/III, F(2,15) = 23.93, P < 0.05; AC V/VI, F(2,15) = 22.57, P < 0.05], but they do not reach statistical significance in either superficial or deeper layers of the PL/IL. Despite the lack of EDS-specific c-fos induction in the mPFC, the expression of Fos-immunoreactivity in the SSbfs of EDS-tested D2 mutants was increased by 18% from baseline but did not significantly differ from corresponding values obtained from wildtype.
In summary, whereas wildtype and D3 mutants exhibit test-specific activation of mPFC neurons, mPFC c-fos induction in mice lacking D2 receptors is not elevated above baseline. Furthermore, in EDS-tested D3 mutants, the expression of c-fos in the mPFC is significantly increased compared with EDS-tested wildtype.
Discussion
The present study shows that inactivation of D2 and D3 receptors differentially affects test-induced activation of neurons in the mPFC that correlates with the different response accuracies of the mutants in distinct phases of the cognitive test.
Whereas the performance of D2 mutants is indistinguishable from wildtype in simple discrimination tests, they have significant deficits in the compound discrimination. More precisely, deficits in rule acquisition become evident only when the complete set of stimulus dimensions and stimulus properties are presented for the first time. Our data indicate that D2 mutants have no deficit in attending to a perceptual dimension per se. Once these mutants acquired the rules of the CD, they proceed through attention-set-shifting tasks, including rule reversals, in a manner indistinguishable from wildtype. Interestingly, similar deficits in the acquisition of rules have previously been found to be responsible for the impaired performance of schizophrenic subjects in related cognitive tasks (Posada and Franck, 2002; Faraone et al., 1999). The present data therefore suggest that decreased D2-receptor activity contributes specifically to deficits in the acquisition of rules that govern cognitive tasks. They further suggest that chronic treatment with neuroleptic drugs that block D2 receptors would further worsen this deficit.
Our previous study has shown that D2 mutants have spatial working memory deficits that are due to decreased prefrontal cortical D1 receptor activity. Whereas a single dose of METH rescued both the decreased agonist-promoted D1 receptor function as well as the working memory deficits of these mutants in a long-term manner (Glickstein et al., 2002), the present study shows that an identical pharmacological manipulation with METH had no effect on the (impaired) performance of D2 mutants in the CD phase of the test, suggesting that the deficits of rule acquisition in D2 mutants are not due to their decreased D1-receptor activity in the mPFC. In this regard, it is of interest to note that a recent study demonstrated that D2 receptors selectively modulate a specific component of working memory circuitry that is not affected by D1 receptors (Wang et al., 2004). Similarly, the present study suggests that D2 receptors, but not D1 receptors, play a direct role in the acquisition of complex rules that govern cognitive tasks. Whether this requires activation of D2 receptors located on pyramidal cells or GABAergic interneurons of the mPFC (or both) remains to be investigated.
The present study also shows that D2 mutants exhibit virtually no task-specific activation of neurons in the mPFC after CD- and EDS-testing. This, however, does not imply that the neuronal mPFC activity is low in these mutants. Rather, our data revealed that in D2 mutants, the activity of mPFC neurons during tasks requiring sustained attention does not exceed the already elevated neuronal activation of non-tested, but food-deprived animals. This is clearly different from results obtained from D3 mutants. In SD and CD phases of the test, these mutants perform in a manner indistinguishable from their wildtype littermates. In intra- and extradimensional set-shifting phases, their performance is slightly enhanced, and they perform significantly better than wildtype in tests governed by reversal rules. Moreover, CD- and EDS-tests led to mPFC c-fos responses in these mutants that were significantly higher compared with the already elevated baseline levels of food-deprived, non-tested mutants. Furthermore, in EDS-tested D3 mutants, the densities of mPFC neurons expressing the c-fos gene were significantly higher compared with EDS-tested wildtype. Altogether, these data indicate that the extent of test-induced activation of neurons in the mPFC correlates with the performance of wildtype and mutants in the cognitive task and that the differences between wildtype and mutants are test-phase specific, i.e. they are evident for CD- and IDSRev-performances of D2 and D3 mutants, respectively, but the performance of either mutants in the EDS is indistinguishable from wildtype. These findings are different from those reported for rats with bilateral lesions of the mPFC (Birrel and Brown, 2000). These rats showed deficits only in the EDS phase of the task. Several reasons could account for these differences. First, bilateral lesions of the PFC are far more robust manipulations than inactivation of single genes. Second, differences in the use of anatomic circuitries activated during set-shifting could account for the differences between the two rodent species. Third, the attention-set shifting task developed by Birrell and Brown (2000) may be more sensitive in detecting deficits in set-shifting in rats compared with mice.
A striking finding of the present study is the difference of neuronal activation in the AC relative to PL/IL in wildtype and D3 mutants. Whereas in wildtype, AC activation exceeds corresponding ones found in PL/IL subregions, in D3 mutants the number of neurons expressing c-fos in the AC never exceeded PL/IL numbers. In fact, in CD-tested D3 mutants, AC activation was lower than PL/IL activation. The rodent mPFC, anatomically defined by its reciprocal connections to the mediodorsal thalamus as well as reciprocal corticocortical connections, has many functional properties that are also characteristic for the primate dorsolateral PFC (working memory, attention, attention shifts). However, the rodent mPFC also has features of other cortical regions of primates, most notably the anterior cingulate cortex (Uylings et al., 2003). In primates, one interpretation of neuronal activation in the AC during tasks requiring attention and response selection is that the AC monitors conflict between different action plans (‘performance monitoring’; MacDonald et al., 2000; Botvinick et al., 2001) to signal greater cognitive control to the dorsolateral PFC. This decreases conflict and in subsequent test trials, with correct response selections, activation of the AC decreases while activation of the dorsolateral PFC is increased (Kerns et al., 2004). It is thus tempting to speculate that the higher response accuracy of D3 mutants is, at least in part, due to their relatively higher activation in the PL/IL compared with AC and that such an activation pattern reflects less conflict, greater cognitive control, and hence lower error rates.
D3 mutants also exhibit prolonged response latencies in the behavioral task that cannot simply be explained by decreased motivation or increased anxiety of these mutants (see Table 1). The differences in response latencies between wildtype, D2 mutants and D3 mutants together with the differences between their response accuracies suggest that longer response latencies are necessary for heightened attention. Indeed, D3 mutants spent more time ‘checking’ both bowls and correcting approaches to the incorrect bowl than wildtype or D2 mutants. Thus, one role of D3 receptors in attention may be to speed up response selection, perhaps at the expense of response accuracy. However, the mechanisms underlying the improvement in attention in D3 knockout mice remain to be investigated.
Finally, a general concern of studies on constitutive knockout mice is that results obtained with such mutants are due to the lack of expression of the targeted gene during development. The extent to which the specific cognitive phenotypes of D2 and D3 mutants are related to adaptive developmental processes remains to be demonstrated. In the absence of evidence for both structural alterations in the PFC of the mutants examined in this study and a pivotal role of D1 receptors (whose function is diminished in these mutants) in the deficits described here, it is likely that sustained pharmacological blockade of D2 and D3 receptors reproduces the results obtained with the mutants. At present, however, a selective pharmacological inactivation of these two receptors must still await the successful development of drugs that, over a wide range of concentrations, clearly discriminate between D2 and D3 receptors expressed in vivo.
In summary, inactivation of D2 and D3 receptors in knockout mice results in different modulations of the performance in cognitive tasks requiring sustained attention. The lack of D2 receptors impairs the acquisition of complex rules that govern the task, and the lack of D3 receptors enhances performance in set-shifting/reversal phases of the task. Hence, DA exerts different modulatory effects on mPFC activity during tasks requiring sustained attention that are dependent upon the type of D2-like receptor that is activated.
We thank Rita Patel and Sharon Niv for their help with the behavioral studies. This work was supported by a grant from the National Institutes of Health MH56123 and NARSAD (C.S.).
References
Birrel JM, Brown VJ (
Botvinick MM, Braver TS, Barch DM, Carter CS, Cohen JD (
Faraone SV, Seidman LJ, Kremen WS, Toomey R, Pepple JR, Tsuang MT (
Fox MT, Barense MD, Baxter MG (
Gaspar P, Bloch B, Le Moine C (
Glickstein SB, Hof PR, Schmauss C (
Goldman-Rakic PS (
Hof PR, Young WG, Bloom FE, Belichenko PV, Celio MR (
Jung M-Y, Skryabin BV, Arai M, Abbondanzo S, Fu D, Robakis NK, Brosius J, Polites HG, Pintar JE, Schmauss C (
Kerns JG, Cohen JD, MacDonald III AW, Cho RY, Stenger VA, Carter CS (
Khan ZU, Gutierrez A, Martin R, Penapiel A, Rivera A, De La Calle A (
Le Moine C, Gaspar P (
MacDonald III AW, Cohen JD, Stenger VA, Carter CS (
Miller EK, Cohen JD (
Morissette M, Goulet M, Grondin R, Blanchet P, Bedard PJ, Di Paolo T, Levesque D (
Posada A, Franck N (
Schmitz C, Hof PR (
Turnbridge EM, Bannerman DM, Sharp T, Harrison PJ (
Uylings HBM, Groenewegen HJ, Kolb B (
Wang M, Vijayaraghavan S, Golsman-Rakic PS (
Author notes
1Department of Neuroscience, New York State Psychiatric Institute, New York, USA, 2Department of Pharmacology, Columbia University, New York, NY 10032, USA, 3Department of Neuroscience, Mount Sinai School of Medicine, New York, NY 10029, USA and 4Department of Psychiatry, Columbia University, New York, NY 10032, USA