


Abstract
Perceptual suppression of distractors may depend on both endogenous and exogenous factors, such as attentional load of the current task and sensory competition among simultaneous stimuli, respectively. We used functional magnetic resonance imaging (fMRI) to compare these two types of attentional effects and examine how they may interact in the human brain. We varied the attentional load of a visual monitoring task performed on a rapid stream at central fixation without altering the central stimuli themselves, while measuring the impact on fMRI responses to task-irrelevant peripheral checkerboards presented either unilaterally or bilaterally. Activations in visual cortex for irrelevant peripheral stimulation decreased with increasing attentional load at fixation. This relative decrease was present even in V1, but became larger for successive visual areas through to V4. Decreases in activation for contralateral peripheral checkerboards due to higher central load were more pronounced within retinotopic cortex corresponding to ‘inner’ peripheral locations relatively near the central targets than for more eccentric ‘outer’ locations, demonstrating a predominant suppression of nearby surround rather than strict ‘tunnel vision’ during higher task load at central fixation. Contralateral activations for peripheral stimulation in one hemifield were reduced by competition with concurrent stimulation in the other hemifield only in inferior parietal cortex, not in retinotopic areas of occipital visual cortex. In addition, central attentional load interacted with competition due to bilateral versus unilateral peripheral stimuli specifically in posterior parietal and fusiform regions. These results reveal that task-dependent attentional load, and interhemifield stimulus-competition, can produce distinct influences on the neural responses to peripheral visual stimuli within the human visual system. These distinct mechanisms in selective visual processing may be integrated within posterior parietal areas, rather than earlier occipital cortex.
Introduction
Recent findings from psychophysics, neurophysiology and functional brain imaging indicate that visual perception can be influenced by attentional factors operating at many sites in the brain, from early visual cortex through to higher-level areas in frontal and parietal cortex (Kanwisher and Wojciulik, 2000; Kastner and Ungerleider, 2000; Corbetta and Shulman, 2002; Driver et al., 2003). A given visual input may evoke different brain responses, depending on endogenous top-down mechanisms such as task-related goals, as well as on bottom-up sensory-driven factors, such as the presence of competing stimuli in the visual field (Reynolds et al., 1999; Kastner and Ungerleider, 2000). Both endogenous mechanisms and sensory-driven competition can modulate early stages of visual processing, including primary visual cortex (Kastner et al., 1998; Tootell et al., 1998a; Somers et al., 1999). However, relatively little is known about how the different constraints imposed by voluntary top-down processes and exogenous bottom-up processes may interact within early visual areas (Desimone and Duncan, 1995; Kastner and Ungerleider, 2000, 2001) or higher-level regions such as parietal cortex (Corbetta and Shulman, 2002). Here we used whole-brain functional magnetic resonance imaging (fMRI), coupled with retinotopic mapping, to compare the effects of top-down attentional load and of sensory competition on visual processing of distractors presented in the peripheral visual field. Our main goals were fourfold: (i) to determine whether increased attentional load at fixation, without changing visual stimulation there, might reduce responses to peripheral visual inputs at early cortical stages; (ii) to determine whether any effect of increased load at fixation might produce retinotopically selective influences on more peripheral versus more central representations of the visual field, e.g. resulting in ‘tunnel’ vision; (iii) to examine any competitive effects between sensory stimulation across the two hemifields, whereby task-irrelevant bilateral stimulation might reduce neural responses relative to those evoked contralaterally by unilateral stimulation; and (iv) to determine whether effects of central attentional load and inter-hemifield sensory competition may interact in some brain areas.
Lavie (1995, 2000) and Lavie and Tsal (1994) proposed an influential psychological theory of attention, according to which filtering-out of visual distractors in the periphery may depend on the ‘perceptual load’ of a current attentional task at central fixation, with less processing of the peripheral field (and hence less interference from distractors) obtained when more attentional capacity is demanded by the central task. Thus, higher attentional load for central targets might lead to exclusion of irrelevant peripheral inputs at an earlier stage of visual processing, as compared with lower central load. Although there is considerable psychological support for this theory from behavioral studies, only a few functional imaging studies have investigated the neural substrates underlying such effects (Rees et al., 1997; de Fockert et al., 2001; O'Connor et al., 2002; see also Pinsk et al., 2004). Moreover, these previous imaging studies have usually focused on responses to complex visual stimuli in selective regions of extrastriate cortex, such as moving patterns (Rees et al., 1997) or faces (de Fockert et al., 2001). For instance, Rees et al. (1997) reported a reduced response in area MT+/V5 for peripheral moving dots when attentional load was increased for an unrelated central task, performed on a rapid stream of letters at fixation. Although Rees et al. (1997) also noted some reductions in occipital cortex, the effect of attentional load in early visual areas has received little systematic investigation up to now [but see Smith et al. (2000), O'Connor et al. (2002) and Pinsk et al. (2004), whose studies are considered at greater length in our Discussion], nor has any imaging study examined whether central attentional load might differentially affect the response to peripheral stimulation at different eccentricities. In the present fMRI experiment, we varied attentional load in a central task while presenting flickering checkerboards as task-irrelevant stimuli in the peripheral visual field, in order to activate many brain regions from V1 onwards. This enabled us to examine the effects of attentional load at fixation on the processing of peripheral distractors in early visual areas, while keeping visual inputs absolutely constant across the load manipulation, both in the periphery and at fixation. Retinotopic mapping of visual areas allowed us to examine whether any reduction of neural responses due to central load might vary for different eccentricities, and for different visual areas.
Several classic psychophysical studies have suggested that when spatial attention is focused at fixation during a visual task with a high cognitive load, reduced processing of peripheral visual stimuli may lead to an effective narrowing of the ‘functional visual field’ (e.g. Mackworth, 1965; Williams, 1985; Plainis et al., 2001). However, it remains controversial whether this reduction of perceptual processing involves some eccentricities in the periphery more than others. Some findings were taken to suggest that increased attentional load at fixation might produce so-called ‘tunnel vision’, with more eccentric locations suffering the most (Ikeda and Takeuchi, 1975; Williams, 1985; Chan and Courtney, 1998). Other results suggest that a reduction in peripheral processing due to greater central load might be more uniform across all eccentricities in the field (Holmes et al., 1977; Williams, 1984). Yet another possibility is that a greater effect might occur for locations closer to the central target compared to those further away retinotopically, with a ‘suppressive surround’ predominating around the attended location (Bahcall and Kowler, 1999; Rantanen and Goldberg, 1999; Plainis et al., 2001). Therefore, a further aim of the present fMRI study was to test directly in functionally defined retinotopic visual areas whether neural responses to peripheral stimulation for relatively ‘outer’ versus ‘inner’ eccentricities might be differentially affected by increases in attentional load at central fixation. This has not been tested previously with fMRI.
Importantly, we held the foveal stimulus-streams absolutely constant across our manipulation of central attentional load, so that only ‘top-down’ factors related to task demands were varied. We also manipulated, in an orthogonal manner, ‘bottom-up’ (i.e. stimulus-driven) factors by varying the task-irrelevant peripheral checkerboards. These checkerboards could be absent, presented unilaterally in the left visual field (LVF), unilaterally in the right visual field (RVF) or bilaterally to produce double simultaneous stimulation of the two hemifields. The latter bilateral displays should increase any ‘sensory competition’ between hemifields (Kinsbourne, 1977; Miller et al., 1993; Fink et al., 2000), and thus enabled us to examine whether neural responses for one hemifield are reduced by competition with concurrent inputs from the opposite hemifield; and whether the extent of such competition depends on the degree of task-related central load. Competitive suppression between simultaneous bilateral stimulation across the two hemifields may give rise to perceptual ‘extinction’ in patients with unilateral parietal damage, who often remain unaware of a stimulus in the contralesional field during bilateral displays, yet are able to detect the same contralesional stimulus when presented alone (e.g. Kinsbourne, 1977; Heilman and Van Den Abell, 1980; Vuilleumier and Rafal, 2000; Driver and Vuilleumier, 2001). Between-hemifield competition may also arise behaviorally in normal people, in situations where processing of a stimulus in one hemifield is disrupted by adding a second salient stimulus on the other side (Pollmann, 1996; Pollmann and Zaidel, 1998; Hilgetag et al., 2001). In addition, in both patients and normals, behavioral effects of sensory competition between simultaneous stimuli can sometimes interact with increases in task load (Rapcsak et al., 1989; Robertson and Frasca, 1992; Vuilleumier and Rafal, 2000; Johnson et al., 2002), though the neural bases of such interactions remain unknown.
Some neural correlates of sensory competition have been found in early visual cortex by functional imaging in humans (Kastner et al., 1998, 2001; Fink et al., 2000) and single-cell recording in monkeys (Moran and Desimone, 1985; Miller et al., 1993; Reynolds et al., 1999), with mutually suppressive interactions between concurrent stimuli leading to reduced neuronal activation during simultaneous presentations, as compared with separate presentations. At the single-cell level, these effects have usually been observed for two competing stimuli shown within the same receptive field (Moran and Desimone, 1985; Reynolds et al., 1999), while functional imaging studies found similar effects for adjacent stimuli within the same quadrant or hemifield (Kastner et al., 1998, 2001). To our knowledge, no previous fMRI study has examined competitive effects between task-irrelevant stimulation in separate visual hemifields (as for the checkerboards here), even though this is a critical condition for producing perceptual extinction in patients (Rapcsak et al., 1987; Vuilleumier and Rafal, 2000; Driver and Vuilleumier, 2001) and in normal people (Pollmann, 1996; Pollmann and Zaidel, 1998). Only one PET study (Fink et al., 2000) has reported a reduced activation in visual cortex for contralateral stimuli when presented with concurrent stimuli in the opposite hemifield (compared with contralateral stimuli alone), but stimulus competition could not be distinguished from top-down attentional factors relating to the task performed on the peripheral stimuli in that study (as we discuss later). By contrast, in the present study, the spatial focus of attention for the central task was held constant, at fixation, and competing peripheral stimuli always remained task-irrelevant.
If sensory suppression between simultaneous inputs is determined by the size of neuronal receptive fields (Moran and Desimone, 1985; Kastner et al., 1998, 2001; Reynolds et al., 1999), then between-hemifield competition should presumably only arise at higher levels of processing, where representations of both ipsilateral and contralateral space exist (Leinonen et al., 1979; Luck et al., 1997; Tootell et al., 1998b), as perhaps in the parietal circuits that are dysfunctional in extinction patients (Mesulam, 1999; Ben Hamed et al., 2001; Driver and Vuilleumier, 2001; Corbetta and Shulman, 2002). However, if competition among concurrent visual inputs ultimately always affects activity within early sensory areas through mutual suppression and/or feedback influences, then one might expect reduced activation in occipital cortex for contralateral stimuli when presented with concurrent stimuli in the other hemifield (e.g. see Fink et al., 1999).
Finally, with the present design, we could directly assess whether ‘bottom-up’ suppression by bilateral sensory competition and ‘top-down’ suppression by higher attentional load for the central task might affect peripheral visual processing in a similar or different way, possibly interacting within specific brain areas (e.g. with increased central attentional load exacerbating sensory suppression between bilateral peripheral stimuli within visual areas). Although both top-down and bottom-up influences are thought to modulate visual processing (Kanwisher and Wojciulik, 2000; Kastner and Ungerleider, 2001; Corbetta and Shulman, 2002), the exact nature and functional sites of any interactions between these two kinds of influences still remain largely unknown.
Our study used both conventional whole-brain SPM group analyses and a retinotopic-mapping approach. The rationale of taking this combined approach is that whole-brain SPM analyses allowed us to assess any effects that might arise beyond retinotopic cortex (thus including frontal and parietal cortex, not just posterior visual cortex), while the retinotopic-mapping approach allowed us to test specific hypotheses for each functionally defined retinotopic visual area. It should also be noted that the random-effect SPM procedure used here can only reveal effects that were found consistently across all of the participants (Friston et al., 1998). However, a group analysis using a voxel-by-voxel SPM approach on normalized images may not be sufficient to examine early visual areas in detail, since a large inter-individual variability can exist in the exact anatomical position of these occipital regions. Therefore, each approach is suitable for asking different questions to the same data, and for investigating different brain regions; so together they provide a much fuller picture.
Materials and Methods
Participants
Sixteen healthy volunteers (seven male, nine female; age range 19–38 years, mean 27.6) participated in the study after giving informed consent, according to procedures approved by the Joint National Hospital for Neurology and Neurosurgery/Institute of Neurology Ethics Committee. All except one of the subjects were right-handed. All were in good health, with no past history of psychiatric or neurological diseases, and had normal or corrected (with contact lenses) visual acuity. They all underwent fMRI scanning during a main experimental session (visual load experiment), followed by a retinotopic mapping session, which allowed us to define individual visual cortical areas (Sereno et al., 1995; Engel et al., 1997).
Visual Load Experiment: Task and Design
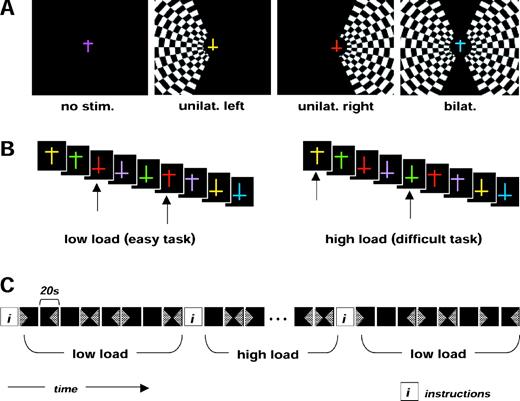
During the main fMRI experiment, participants performed a visual detection task on a continuous rapid successive visual presentation (RSVP) of colored letters (one letter every 750 ms) that was shown in a fixed central location at fixation. This RSVP stream consisted of T-shaped stimuli with different orientations (upright or upside-down) and different colors in random order (Fig. 1). Participants were required to monitor for the occurrence of infrequent (7.5%) pre-specified targets within this rapid central letter stream, and to respond by a button-press to each detected target. The central letter stream was shown continuously but presented either alone, or accompanied by peripheral flickering checkerboards that could appear in either the right, the left or both visual fields, in randomly ordered blocks of 20 s each (Fig. 1A).
Illustration of stimuli and design in the visual-load experiment. The four different visual conditions included blocks of 20 s with flickering checkerboards presented (A) to either the right, the left or both hemifields, or to none, in pseudo-random alternation. A rapid continuous stream of colored T-shapes appeared at central fixation during all conditions (500 ms duration each, plus 250 ms interval). The same four visual conditions (with exactly the same central and peripheral stimuli) were presented during two different tasks performed on the central shapes. (B) The central visual stream remained identical under both task conditions (only the task instructions differed). In the low-load task, participants had to detect any red shape; in the high-load task, they had to detect specific conjunctions of color and shape (yellow upright or green inverted Ts). (C) Blocks with irrelevant checkerboard stimulation in either hemifield alternated during both task conditions, in a pseudorandom sequence.
Within the same scanning session, the participants performed either a low-load or a high-load task on the central stream of letters, but importantly these central stimuli were equivalent in all respects across the two task conditions (Fig. 1B). The low-load (color) task required a key-press for any red T irrespective of its orientation; whereas the high-load (conjunction) task required a key-press for any upright yellow T or upside-down green T (both types of conjunction target had to be monitored for throughout this task). Importantly, the exact same pseudorandom stream of 429 central stimuli was presented during both task conditions, with items that required a button-press response appearing on average every 13.4 stimuli (7.5% of the total number of central stimuli), such that the number of targets was the same in both high-load and low-load conditions. Items that were targets in one condition also appeared with the same frequency as task-irrelevant stimuli in the other condition (i.e. high-load targets appeared as distractors under low-load instructions, or vice versa). Therefore, only the task instructions distinguished the high-load and low-load conditions for the central task. The rapid succession of stimuli and unpredictability of targets in this RSVP task ensured that participants always monitored items at central fixation, during both task conditions. Each task was performed twice during 160 s periods, each separated by a 20 s display presenting instructions for the next task (high load or low load). These two task conditions alternated in ABBA or BAAB order (randomized across participants), during a single continuous scanning session.
Based on prior work (e.g. Treisman and Gormican, 1988; Wojciulik and Kanwisher, 1999), we anticipated that detecting red targets should be a low-load task that can be solved on the basis of a single ‘pop-out’ color feature, whereas monitoring for Ts with a particular color and orientation in the rapid central stream should be a high-load task requiring more attentional resources in order to discriminate the specific conjunction of features. Such conjunction tasks are known to increase perceptual load (Lavie, 1995) and to activate attentional networks, including parietal cortex, even when always performed at central fixation as here (Wojciulik and Kanwisher, 1999).
During each task condition, high-contrast checkerboards flickered (8 Hz) continuously in either the right visual field (RVF), left visual field (LVF), both sides or none (each for blocks of 20 s, in random alternation), while participants performed the central task on the rapid successive letter stream without interruption (Fig. 1C). The checkerboards were always irrelevant to the central task, and participants were instructed to ignore them. Each type of peripheral visual stimulation was repeated 4 times during each task. The experimental conditions thus constituted a 2 (central load) × 4 (peripheral stimuli) factorial block-design.
All visual stimuli were projected on a screen and seen through a mirror mounted on the MRI headcoil (total display size 28 × 22° of visual angle, 1024 × 768 screen resolution, 60 Hz refresh rate) and generated using a MATLAB Toolbox, allowing visual presentation and response-recording with precise timing (Cogent, www.vislab.ucl.ac.uk/Cogent/).
Retinotopic Mapping: Task and Design
A standard retinotopic fMRI protocol followed the visual load experiment during the same scanning session. We used a conventional procedure (Sereno et al., 1995; DeYoe et al., 1996; Engel et al., 1997; Tootell et al., 1997; Warnking et al., 2002), in which two different visual stimulation conditions with moving flickering black-and-white-checkered stimuli were employed. Visual stimulation by a slowly rotating wedge (covering 45° of polar angle) was used to map angular positions within the visual field, and a slowly expanding annulus was used to map visual field eccentricity up to 14° from center-of-field (0.02 Hz period). To ensure adequate central fixation, participants were required to perform the low-load color detection task on a central stream of stimuli (i.e. report red targets among T-shapes presented every 750 ms) during retinotopic mapping, while the stimuli (wedge or annulus) progressively covered the same extent of the visual field that had been stimulated by the full task-irrelevant peripheral checkerboards in the load experiment (see Fig. 1).
MRI Data Collection
A 2T Siemens VISION system (Siemens, Erlangen, Germany) provided high-resolution T1 anatomical volume images (matrix, 256 × 176 × 256; voxel size: 1 × 1 × 1.5 mm3) and T2*-weighted functional transverse slices (TE = 40 ms; TR = 2.736 s; matrix size 64 × 64 × 36; voxel size: 3 × 3 × 3 mm3) with blood oxygenation level-dependent (BOLD) contrast. For the visual-load experiment, 262 functional volumes were acquired in a single continuous scanning run, during eight (2 central tasks × 4 peripheral stimuli) different conditions (Fig. 1C). Retinotopic visual stimulation was performed during separate runs in the same session, using the same scanning parameters, with 64 functional volumes acquired during each continuous block of polar angle and eccentricity mapping.
fMRI Data Analysis
Statistical parametric mapping (SPM99; www.fil.ion.ucl.ac.uk/spm/) was used for image processing (Friston et al., 1995). Data from the visual-load experiment were analyzed using both a whole-brain group SPM approach and a retinotopic-mapping approach. While voxel-by-voxel SPM analyses can reveal effects across the whole-brain, retinotopic mapping could provide more detailed information about activity within individually defined retinotopic areas, thus accounting for inter-individual anatomical variability in these regions of the visual cortex. Combining these two approaches therefore provides a unique way to test for modulatory effects both within visual areas and beyond.
First, fMRI series from our 16 participants were submitted to a random-effects group analysis using the general linear model applied at each voxel across the whole brain, according to standard SPM methods (Friston et al., 1995). Importantly, random-effects SPM analyses are first performed at an individual level before the individual contrasts between effects of interests are included in a second level analysis (t-tests), thus revealing only effects that are reliably found across all the participants (see below), without relying on a priori knowledge about the location of the expected effects. In each run, the first eight scans were discarded to allow for T1 equilibration effects. All scans from a given participant were spatially realigned to the first image of the first experimental run, time-corrected with reference to the middle slice, normalized to a standard anatomical template conforming to the MNI space (resampled voxel size: 2 × 2 × 2 mm3), and smoothed with an isotropic 8 mm full-width half-maximum (FWHM) Gaussian kernel (although less smoothing was used in the later retinotopic analyses; see below). Time-series from each voxel were high-pass filtered (1/120 Hz cutoff) to remove low-frequency noise.
Random-effects statistical analysis was performed as two stages of a mixed-effects model (Friston et al., 1998). For each participant, eight conditions of interest (2 loads × 4 visual stimulations) were modeled by boxcar waveforms convolved with a canonical hemodynamic response function (HRF), and used as covariates in a multiple regression analysis. Realignment parameters were included as covariates to capture any residual movement-related artifacts (three rigid-body translations and three rotations). Parameter estimates for each covariate were estimated at each voxel by a least-square fit to the data, for each condition and each individual participant. Statistical parametric maps of the t-statistic (SPM[t]) were generated from linear contrasts testing main effects and interactions between conditions in each participant, with these individual parameter estimates then included in a second-stage analysis using one-sample t-tests on the contrast images obtained from each subject (df = 15), for each condition and each voxel across the whole brain (Friston et al., 1998), to test reliability across the individual subjects. This resulted in a random-effect SPM[t] for each comparison of interest, thresholded voxelwise at P < 0.001 uncorrected, with a cluster size threshold of P < 0.05.
A separate analysis of the visual-load fMRI data was also performed for later use in retinotopic analyses, in 12 hemispheres from six participants. Such retinotopic approach could provide a more detailed description of the effects occurring within visual cortex than the whole-brain SPM approach. Selection of these six subjects was arbitrarily based on their behavioral performance during the visual-load experiment (six lowest rates for missed targets); they were not selected for showing particular fMRI effects. Individual scan series were first realigned and time-corrected. A slight degree of smoothing was also applied using a 4 mm FWHM Gaussian kernel to increase signal-to-noise ratio, and improve the power to detect spatially contiguous activations (Skudlarski et al., 1999), with no displacement of activation values and minimal smearing. Voxel size for these non-normalized data was 3 × 3 × 3 mm3. Statistical parametric mapping was performed on these data in each single subject to obtain parameter estimates of activity for the different experimental conditions. These parameter estimates were then extracted and averaged for all voxels within each of the retinotopic visual areas (V1, V2, V3/VP, V4), as delineated by the separate mapping session (see below). These data were mean-corrected using the average activity computed across all visual areas and conditions for a given subject (same arbitrary units as parameter estimates of activity), and then analyzed outside SPM by means of conventional analysis of variance (ANOVA), paired t-tests, and linear regression where appropriate (see Results section).
Retinotopic Mapping of Visual Areas and Eccentricity Bins
Early retinotopic visual areas were delineated using standard fMRI methods (Sereno et al., 1995; DeYoe et al., 1996; Engel et al., 1997; Tootell et al., 1997; Warnking et al., 2002), involving phase-encoded retinal stimuli that map the brain's response to the polar angle and eccentricity of these flickering checkerboard stimuli. Retinotopic maps were generated using SPM, MrGray and MrFlatMesh in combination (Engel et al., 1997; Teo et al., 1997; Wandell et al., 2000). Images were spatially smoothed by 4 mm FWHM Gaussian kernel, matching the slight smoothing performed on the load data. Separate SPM analyses were performed on the fMRI scans acquired during the rotating wedge stimulus, and during the expanding annulus stimulus. Each stimulus was modeled using two regressors, comprising sine and cosine functions with the same frequency as the retinotopic stimulation. The movement parameters derived from image realignment were also included in the model as covariates of no interest. The relative phase of the response at each voxel was calculated from the arctangent of the ratio of the parameter estimates for the sine and cosine regressors. This is equivalent to calculating the response phase using the discrete Fourier transform, as is common practice in retinotopic analyses (Engel et al., 1997; Warnking et al., 2002), but has the additional merit of maintaining two covariates, and of also allowing the analysis to be performed in the context of the general linear model. The response phase maps were inclusively masked to select all voxels responding to the retinotopic stimuli, using a voxel-wise F-test thresholded at P < 0.001.
Separate phase maps were obtained for polar angle and eccentricity. Each value in the phase maps was assigned a color code representing either a specific angle or a specific eccentricity range in the visual field. The color-coded responses were then projected onto a flattened occipital cortical surface of each individual hemisphere, to allow visualization of the calculated phase maps and delineation of the boundaries between discrete areas. Cortical segmentation and flattening were performed for the posterior part of each hemisphere separately, using algorithms implemented by MrGray and MrFlatMesh (Engel et al., 1997; Teo et al., 1997; Wandell et al., 2000). Boundaries between visual areas were identified on these flattened maps based on the gradient phase reversals in response to the rotating wedge (for polar angle mapping) and on the phase in response to the expanding annulus (for eccentricity mapping), as described by others (Sereno et al., 1995; Engel et al., 1997). Based on known alternations of upper and lower visual field representations (Sereno et al. 1995; Brewer et al., 2002), we could successfully delineate ventral and dorsal V1, V2 and V3/VP in all the subjects, as well as ventral V4, but not dorsal V3A and dorsal V4. Since V1, V2 and V3/VP showed similar patterns of activation in the load experiment for upper and lower fields (consistent with our peripheral checkerboard stimuli being symmetrical about the horizontal axis), data were collapsed across upper and lower fields for each of these areas (see Results). We note that the present definition of ventral V4 may include part of V8's representation of the lower visual field along the posterior fusiform gyrus (Tootell and Hadjikhani, 2001), as several previous fMRI studies of human visual cortex have done (e.g. Kastner et al. 1998; O'Connor et al., 2002; Pinsk et al., 2004).
In subsequent analyses, we also distinguished between ‘inner’ and ‘outer’ peripheral regions of the visual field based on the eccentricity phase-values of retinotopically defined visual voxels. This selection of voxels responding either to inner (∼2–8°) or outer (∼8–14°) eccentricities on the basis of phase-map values provided results consistent with manually dividing the flattened cortical maps at the middle of the color-coded eccentricity phase. In additional analyses, we further subdivided the peripheral visual field into four successive eccentricity bins (3° each; see Results) based on the voxel phase values. As described in the Results section, the pattern of eccentricity effects revealed by the 2 bins analysis was confirmed and refined when using these 4 smaller bins. The number of 3 × 3 × 3 mm3 voxels was equally balanced across the four different eccentricity bins for each visual area (mean across 12 hemispheres and for increasing eccentricities: V1: 24.7, 23.9, 20.1, 17.8; V2: 17.6, 13.1, 12.3, 17.1; V3/VP: 10.8, 8.3, 8.0, 10.9; V4v: 16, 16.1, 17.8, 18.9), consistent with previous findings for similar eccentricities beyond the central 2° (Brewer et al., 2002).
The 2-D coordinates of the flattened cortical retinotopic areas were projected onto the original 3-D brain volume, in order to identify voxels that were subsequently used as regions of interest (ROI) for a detailed analysis of fMRI activations obtained in visual cortex during the main attentional-load experiment.
Results
Behavioral Performance during fMRI Scanning
The central task during fMRI scanning was, as expected, harder for the high- than low-load condition in all participants. Mean detection latencies for central target letters were significantly slower in the high-load versus low-load condition [637 versus 486 ms, t(15) = 12.2, P < 0.001]. Hit rates were also lower [79.2 versus 89.5%, t(15) = 3.54, P = 0.003] and false alarms increased [25.9% versus 10.3%, t(15) = 5.64, P = 0.001] during high load versus low load. Performance was always reliably above chance on either task, confirming adherence to the task requirements. There were no significant differences in performance on the central task in the presence or absence of the different peripheral checkerboard stimuli, during either the high- or low-load tasks (ANOVA, all Fs < 0.35, P > 0.58), indicating that peripheral distractors did not mask central stimuli nor divert attention away from the central task. Taken together, these behavioral data confirm that central attentional load was successfully varied by our task manipulation.
SPM Group Analysis of fMRI Data across the Whole Brain
Functional MRI data were first analyzed using SPM on a voxel-by-voxel basis across the whole brain, for all 16 participants. We will first present these whole-brain data, and then consider the relevant results in terms of individually mapped functional retinotopic areas. We start with the basic effects of high attentional load and of peripheral visual stimulation, before moving on to the critical issue of how high central attentional load and inter-hemifield competition may modulate the neural responses to peripheral visual stimuli.
Main Effect of High versus Low Attentional Load in the Central Task
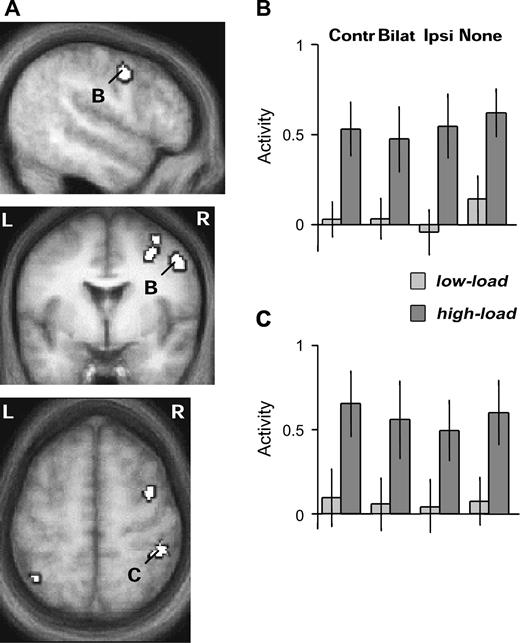
As expected, comparing activations for the high-load minus low-load central task, across all conditions of peripheral visual stimulation, revealed increases in activity within a typical ‘attention network’ of bilateral prefrontal and intraparietal areas (Table 1), including frontal eye field regions and anterior cingulate gyrus, more prominently in the right than left hemisphere (Fig. 2). Increased responses in the high-load versus low-load task were also found in left frontal pole, left caudate and insula (Table 1).
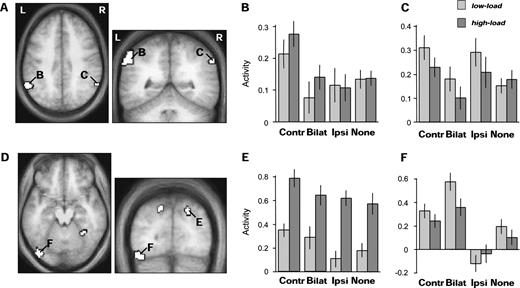
SPMs of brain areas showing a main effect of high minus low attentional load in the central task, overlaid on the mean anatomical scan of participants (all peaks P < 0.001). (A) Increased activity during high load was found in the superior and inferior parts of the right middle frontal gyrus, as well as bilateral superior parietal cortex. Average parameter estimates of activity (±SE) are shown for (B) right inferior FEF region and (C) right anterior parietal cortex, for all conditions of peripheral visual stimulation and central attentional load, showing that increased activation in these areas during high load occurred similarly irrespective of the presence or side of peripheral visual stimulation. Contr = contralateral, Bilat = bilateral, Ipsi = ipsilateral stimulation by peripheral checkerboards.
Main effects of high attentional load (SPM whole-brain analysis)
| Side | Areas (high > low load across all visual stimuli) | Coordinates | T value* | ||||
|---|---|---|---|---|---|---|---|
| x | y | z | |||||
| R | Superior frontal gyrus | 20 | −20 | 66 | 7.93 | ||
| R | Superior parietal lobule (ant) | 42 | −38 | 58 | 5.94 | ||
| R | Caudate | 18 | 20 | 0 | 5.44 | ||
| R | Caudal anterior cingulate cortex/SMA | 8 | 14 | 46 | 5.16 | ||
| R | Middle frontal gyrus/FEF inf | 52 | 0 | 42 | 4.94 | ||
| R | Middle frontal gyrus/FEF sup | 32 | 4 | 48 | 4.9 | ||
| R | Precentral gyrus | 50 | −20 | 44 | 4.88 | ||
| L | Anterior insula | −32 | 14 | −4 | 5.34 | ||
| L | Frontal pole | −24 | 52 | 4 | 4.68 | ||
| L | Caudal anterior cingulate cortex/SMA | −10 | 4 | 54 | 4.34 | ||
| L | Superior parietal lobule | −48 | −44 | 50 | 4.31 | ||
| L | Middle frontal gyrus | −38 | 28 | 30 | 4.09 | ||
All P < 0.001 (random effects analysis, df = 15).
In all these regions, further inspection of the data separately for the different peripheral-stimulation conditions confirmed that activation by high central load was independent of whether the peripheral visual stimulation was left, right, bilateral, or absent. Thus, significant increases were found for the high- minus low-load central tasks even during blocks without any checkerboard stimuli (frontal peaks: x y z = 20 −20 66, T = 8.91, and 32 2 48, T = 4.16; 50 2 42, T = 5.03; cingulate cortex: 10 14 44, T = 3.81; parietal cortex: 38 −40 54, T = 4.32, and −44 −44 38, T = 4.29; all P < 0.001). This is analogous to a previous study by Wojciulik and Kanwisher (1999) which compared easy and hard RSVP tasks, but always without any peripheral distractors, and reported similar intraparietal activations (note that their use of a surface coil precluded them from observing the more anterior activations found here, but see also Marois et al., 2000; Culham et al., 2001). The present activations by high load here without peripheral stimuli were similar to those found during blocks with checkerboard in the contralateral hemifield (i.e. for unilateral stimulation and bilateral stimulation combined, when considering each particular hemisphere; frontal peaks now at: x y z = 20 −20 66, T = 7.24; 32 4 48, T = 5.01; 52 0 42, T = 4.66; cingulate cortex: 8 14 46, T = 5.37; parietal cortex: 44 −40 60, T = 6.29, and −46 −46 50, T = 4.26; all P < 0.001). None of these regions showed a significant interaction between central load and peripheral stimulation (i.e. increases during high versus low central load that were stronger with peripheral stimulation than without), even at low statistical threshold (P < 0.05 uncorrected). These imaging results corroborate the behavioral findings that our different task conditions produced significant changes in attentional demand, revealing a stronger engagement of fronto-parietal networks in the high-load central task compared with the low-load task, as expected and consistent with prior work (e.g. Wojciulik and Kanwisher, 1999).
Main Effects of Contralateral Visual Stimulation
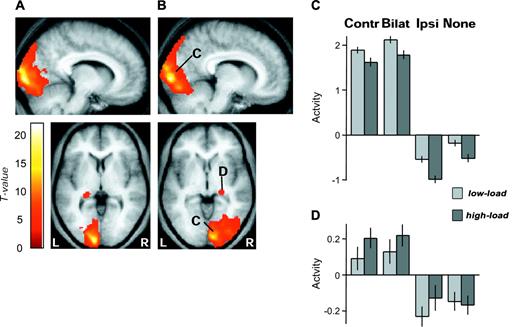
Regions activated by contralateral visual checkerboards were first identified by comparing neural responses to unilateral stimulation in the RVF versus LVF, and vice versa, across all task conditions. As expected, these contrasts revealed extensive activation of contralateral occipital cortex (Fig. 3), but also extended dorsally into posterior superior parietal cortex and ventrally into temporal cortex. Reliable activation of the lateral geniculate nucleus in the contralateral thalamus was also observed in this whole-brain analysis (Fig. 3A,B lower images, D and Table 2).
SPMs of brain areas activated by unilateral contralateral visual stimuli (threshold P < 0.0001). (A) Responses to RVF checkerboards greater than LVF checkerboards in left occipital cortex and left lateral geniculate nucleus. (B) Responses to LVF greater than RVF checkerboards in right occipital cortex and right lateral geniculate nucleus, whose activity across conditions is plotted in (C) and (D), respectively. (C) Average parameter estimates of activity (±SE) in the right occipital cluster (544 2 × 2 × 2 mm3 voxels, mean x y z = 13 −96 7) for all conditions of peripheral visual stimulation and central attentional load, showing preferential responses in presence of contralateral stimulation (i.e. for contralateral-unilateral and also bilateral checkerboards), but decreased activation with higher attentional load for the central task. Left occipital regions showed a similar pattern. (D) Average parameter estimates of activity (±SE) in the right lateral geniculate nucleus cluster (82 2 × 2 × 2 mm3 voxels, mean x y z = 24 −26 −6) for all conditions, showing preferential responses in presence of contralateral stimulation (i.e. for contralateral-unilateral and bilateral stimulation), but no significant decrease during higher central attentional load. The left geniculate showed a similar pattern. Same abbreviations as in Figure 2.
Main effects of visual stimulation (SPM whole-brain analysis)
| Side | Areas | Coordinates | T value* | ||||
|---|---|---|---|---|---|---|---|
| x | y | z | |||||
| RVF > LVF across all attentional conditions | |||||||
| L | Inferior calcarine sulcus | −10 | −100 | 0 | 20.97 | ||
| L | Superior calcarine sulcus | −8 | −102 | 8 | 18.07 | ||
| L | Lingual gyrus | −22 | −80 | −14 | 11.55 | ||
| L | Anterior calcarine sulcus | −6 | −86 | 6 | 10.14 | ||
| L | Lingual gyrus | −14 | −80 | −14 | 10.12 | ||
| L | Occipital pole | −14 | −110 | 12 | 8.22 | ||
| L | Lateral geniculate | −20 | −32 | 2 | 6.3 | ||
| L | Inferior parietal cortex (post angular gyrus) | −52 | −76 | 6 | 5.41 | ||
| L | Posterior intraparietal sulcus | −26 | −68 | 62 | 4.53 | ||
| LVF > RVF across all attentional conditions | |||||||
| R | Inferior calcarine sulcus | 10 | −96 | 0 | 21.68 | ||
| R | Superior calcarine sulcus | 14 | −100 | 14 | 14.07 | ||
| R | Anterior calcarine sulcus | 20 | −88 | 10 | 12.19 | ||
| R | Lingual gyrus | 10 | −84 | −12 | 11.98 | ||
| R | Lateral geniculate | 24 | −26 | −6 | 5.13 | ||
| R | Superior parietal lobule | 28 | −44 | 44 | 5.94 | ||
| R | Posterior intraparietal sulcus | 26 | −72 | 50 | 4.82 | ||
All P < 0.001 (random effects analysis, df = 15).
Figure 3C plots activity in each condition, averaged across the entire right occipital cluster revealed by the LVF-minus-RVF stimulation contrast, providing a first indication of the impact of our central-load manipulation on responses of the visual cortex. It can be seen that higher central load led to lower activations for the large occipital cluster overall (compare light and dark bars in Fig. 3C), consistent with the reduced response for peripheral vision predicted under higher central attentional load on the theory of Lavie (1995, 2000). A more detailed anatomical and statistical analysis of these reduced activations for peripheral stimuli under high central load is provided in the following section (main effects of load). Figure 3D also plots the average activity across conditions for the right lateral geniculate cluster, showing that activity here was not reduced by high central load (if anything, there was a trend for an increase, see next section), in contrast to the effects on occipital cortex. A similar pattern was found for the left hemisphere in both occipital and thalamic regions.
Main Effects of Low minus High Attentional Load: Stronger Visual Activations for Peripheral Stimuli with Less Central Load
To test directly for reduced processing of peripheral visual stimuli during higher load in the central task, as predicted by Lavie (1995, 2000), we identified brain regions where activity was significantly greater during low than high attentional load, in a whole-brain SPM analysis. Critically, the comparison of low minus high central load across all conditions of peripheral visual stimulation (low > high load, Table 3) showed greater responses in bilateral occipital regions during low load than high load (Fig. 4), despite the fact that all visual stimuli were exactly the same during each of the load conditions, both in the central stream and in terms of any peripheral stimulation. This finding is consistent with reduced activity for the visual periphery when more attentional capacity is required by the central task.
![SPMs from whole-brain analysis of any brain areas showing a main effect of low minus high attentional load in the central task (all peaks P < 0.001). Greater activity during low load was found in bilateral occipital poles (A), as well as right pregenual cingulate (B) and left orbitofrontal cortex (C). Such decreases for high load occurred for all conditions of peripheral visual stimulation, but were greater for occipital regions in the presence of checkerboards [as shown by a significant interaction of load × stimulation (low minus high load with bilateral stimulation) > (low minus high load without stimulation) found in the same occipital areas; see text].](https://oup.silverchair-cdn.com/oup/backfile/Content_public/Journal/cercor/15/6/10.1093/cercor/bhh178/2/m_cercorbhh178f04_ht.jpeg?Expires=1716407290&Signature=3UbxSzRYl2t-L-28y82B2FpwfTAbjgcy8O793ZXnwM0EZrPW0TWwbElnEej8RgnbQan~KfCFFKkBkAFi-nx6vzsFhQOutA8o56pWbgLAddRc4cncPcjFgH4OPDRpO9lqKVUDJbUCui~suNMZFq7VuH~to6hpn1oRdTnwhj26qcrnl4RhtBM7siem-2uxzBu1H6sbqVVOBrlof1y1BMeciUSb1s5VeJfKNDRWMBIoqkxp3Skei1nvkL-HyPFvcUInJ10Z3IfnvVjsjeyFSaE8~bzW-HkxIBJUevSk7lIJhSJBhFWNIh60pfxCI6~J~k4GrfE3pc45tMWOKg1Uq-j0xA__&Key-Pair-Id=APKAIE5G5CRDK6RD3PGA)
SPMs from whole-brain analysis of any brain areas showing a main effect of low minus high attentional load in the central task (all peaks P < 0.001). Greater activity during low load was found in bilateral occipital poles (A), as well as right pregenual cingulate (B) and left orbitofrontal cortex (C). Such decreases for high load occurred for all conditions of peripheral visual stimulation, but were greater for occipital regions in the presence of checkerboards [as shown by a significant interaction of load × stimulation (low minus high load with bilateral stimulation) > (low minus high load without stimulation) found in the same occipital areas; see text].
Main effects of low attentional load (SPM whole-brain analysis)
| Side | Areas (low > high load across all visual stimuli) | Coordinates | T value* | ||||
|---|---|---|---|---|---|---|---|
| x | y | z | |||||
| R | Rostral anterior cingulate gyrus | 16 | 50 | 12 | 4.99 | ||
| L | Orbitofrontal cortex | −10 | 50 | −16 | 4.21 | ||
| L | Posterior occipital cortex | −24 | −104 | 12 | 3.94 | ||
| R | Posterior occipital cortex | 8 | −108 | 14 | 2.94** | ||
*All P < 0.001, except **P < 0.005 (random effects analysis, df = 15).
This modulation of occipital cortex by load was strongest when considering only blocks with contralateral hemifield stimulation (e.g. pooling over bilateral and contralateral-unilateral stimulation to examine each hemisphere: left peak, x y z = −22 −104 12, T = 5.41; right peak, 8 −108 12, T = 3.82; both P < 0.001 uncorrected); whereas load effects were smaller when considering only blocks without hemifield stimulation (i.e. no checkerboard: left, −24 −102 12, T = 3.17, P < 0.005 uncorrected; right: 8 −108 12, T = 1.84, P < 0.05 uncorrected). Indeed a direct test for a central load by peripheral stimulation interaction confirmed significant differences in the same occipital regions [(low minus high during bilateral stimulation) > (low minus high without stimulation): left peak, −24 −90 2, T = 3.98; right peak, 22 −104 14, T = 4.34; both P < 0.001; see also Fig. 4].
Taken together, these results suggest that visual responses to task-irrelevant peripheral stimuli can be reduced in occipital cortex when the attentional load of processing for task-relevant stimuli is increased at central fixation, even though the visual stimulation itself remains constant. While some reduction in occipital activations with high central load was found here even in the absence of any contralateral peripheral stimulation (consistent with Smith et al., 2000), the effect of central load on occipital activity was significantly stronger in the presence of contralateral peripheral stimulation.
As shown in Table 3 and Figure 4, the peaks for the low-minus-high load effects, and for the interaction of load with peripheral visual stimulation, were localized to the lateral occipital pole in the normalized SPM group analysis. A similar reduction in activation during high load was also observed in more medial regions when selectively testing those occipital peaks that were found (as reported above) to respond preferentially to RVF versus LVF stimuli, or preferentially to LVF versus RVF stimuli (left side, T = 2.84; right side, T = 2.56, both P < 0.01; see also Fig. 3 and Table 2). However, a whole-brain analysis using a voxel-by-voxel statistical parametric mapping approach on normalized images, as in the standard SPM analysis presented thus far, may not be sufficient to examine early visual areas in detail, since a relatively large inter-individual variability can exist in the exact anatomical position of these regions (Amunts et al., 2000). As described later, we therefore also tested for effects of attentional load in discrete visual areas, as functionally defined by retinotopic mapping in individual participants. To anticipate, this approach confirmed a reduced activation to peripheral visual stimuli during higher central attentional load, which occurred from V1 onwards but progressively increased for successive areas in extrastriate cortex.
By contrast with the significant effects of load in occipital cortex, we note that the SPM analysis showed no reliable effect of low minus high attentional load for the lateral geniculate nucleus (LGN), even when confining the analysis to the peak that we had found in our earlier analysis to show a selective response to either RVF or LVF stimuli (see Fig. 3D and Table 2). Instead, there was a non-significant opposite trend for relative increases in the high minus low-load task in the LGN (T = 1.88 and T = 1.29, P = 0.05 and P = 0.10 uncorrected, for right and left, respectively).
Finally, only two other brain regions showed a significant increase in activation for the whole-brain SPM comparison of low load minus high load (Table 3), involving the rostral-pregenual cingulate and orbitofrontal cortex (Fig. 4). Increases in rostral cingulate during low load were comparable for blocks with contralateral checkerboards (peak x y z = 16 50 12, T = 5.01, P < 0.001) and for blocks with no peripheral stimulation (peak x y z = 16 48 10, T = 4.02, P < 0.001), whereas orbitofrontal increases appeared slightly greater with contralateral (unilateral or bilateral) visual stimulation (peak x y z = −12 50 −16, T = 4.49, P < 0.001) in comparison to without visual stimulation (peak x y z = −14 48 −12, T = 3.19, P < 0.005). Since suppression of activity has been reported in both of these areas during difficult cognitive tasks compared with rest, possibly due to a decrease in spontaneous affective monitoring of current states (e.g. Drevets and Raichle, 1998; Simpson et al., 2001), this particular result merely indicates further that our different load conditions did indeed induce significant changes in attentional set.
Effect of Bilateral versus Unilateral Checkerboard Stimulation in Whole-brain Analysis
Another major aim of our study was to examine whether presenting task-irrelevant visual stimuli simultaneously in both hemifields would result in competitive suppression between hemispheres (as usually invoked to explain perceptual extinction in neurological patients, e.g. Heilman and Van Den Abell, 1980; Driver and Vuilleumier, 2001), and to determine whether any suppression by interhemispheric competition may interact with central attentional load. If bilateral stimulation produced a competitive suppression via sensory competition between hemispheres (e.g. Kinsbourne, 1977, 1993; Kastner and Ungerleider, 2001), then bilateral checkerboards should reduce activations in a given hemisphere as compared with a unilateral checkerboard in the contralateral hemifield (cf. Fink et al., 2000). Responses to unilateral (right + left) minus bilateral stimulation were therefore examined, across all brain voxels in our whole-brain SPM analysis.
No suppression by bilateral competition was found in occipital or temporal cortex. Instead, a competitive reduction was found specifically within parietal cortex (Table 4), beyond conventional visual areas. Inferior parietal regions in supramarginal gyrus of the left hemisphere responded more to unilateral right than left or bilateral stimuli; whereas homologous parietal regions in the right hemisphere responded to either left unilateral or right unilateral stimuli, more than to bilateral stimuli (Fig. 5A,B,C). These regions showed no significant main effect of attentional load (T ≤ 1.77, n.s.). Another region in posterior right intraparietal sulcus (Fig. 5E) also responded more to left than to right or bilateral stimuli (Table 4), but in addition showed an increase during high versus low load, irrespective of visual stimulation (T = 3.43, P = 0.002). These dependencies on unilateral versus bilateral stimulation in parietal cortex contrast with the striking lack of competitive suppression between bilateral simultaneous stimuli in early visual areas (see also next section), and suggest that competitive suppression between hemispheres may arise only at later stages of visual processing.
SPMs of brain areas showing decreased responses for bilateral compared to unilateral peripheral visual stimulation (all peaks P < 0.001). (A) Bilateral inferior parietal regions were more activated by unilateral stimuli in RVF than bilateral stimuli, regardless of load. (B) Average parameter estimates of activity (±SE) in the left inferior parietal cluster (shown in A; 203 voxels, mean x y z = −60 −52 40) for all conditions, showing selective response only to unilateral RVF stimuli. (C) Average parameter estimates of activity across the right inferior parietal cluster (shown in A; 58 voxels, mean x y z = 60 −55 40), showing selective response to either RVF or LVF unilateral stimuli, but not bilateral stimuli. (D) Areas showing an interaction between central load and unilateral minus bilateral peripheral stimulation. These include bilateral superior parietal and fusiform regions, where a decrease in the responses to bilateral versus unilateral stimulation was more pronounced during high attentional load. (E) Average parameter estimates of activity in the right superior parietal cluster (shown in D; 51 voxels, mean x y z = 20 −80 44), showing similar responses to bilateral and contralateral-unilateral stimuli during low, but not high load, in addition to general high load increases. The left superior parietal region showed a similar pattern. (F) Average parameter estimates of activity in the posterior left fusiform cluster (shown in D; 80 voxels, mean x y z = −42 −80 −19), showing enhanced responses during bilateral compared to unilateral stimulation during low, but not high load. The right fusiform showed a similar pattern. Same abbreviations as in Figure 2.
Main effects of bilateral visual stimulation (SPM whole-brain analysis)
| Side | Areas | Coordinates | T value* | ||||||
|---|---|---|---|---|---|---|---|---|---|
| x | y | z | |||||||
| Bilateral > RVF + LVF | |||||||||
| L | Medial occipital cortex | −10 | −102 | 0 | 19.56 | ||||
| L | Posterior inferior temporal gyrus | −24 | −80 | −16 | 10.59 | ||||
| R | Medial occipital cortex | 10 | −94 | 0 | 18.15 | ||||
| R | Posterior inferior temporal gyrus | 30 | −74 | −10 | 12.92 | ||||
| Unilateral LVF > bilateral | |||||||||
| R | Inferior posterior parietal cortex (angular gyrus) | 50 | −80 | 28 | 11.02 | ||||
| R | Frontal operculum | 8 | −46 | −26 | 4.99 | ||||
| R | Posterior intraparietal sulcus | 32 | −74 | 46 | 4.23 | ||||
| R | Inferior posterior parietal cortex (supramarginal) | 62 | −52 | 38 | 4.11 | ||||
| Unilateral RVF > bilateral | |||||||||
| L | Inferior posterior parietal cortex (supramarginal) | −56 | −52 | 44 | 5.83 | ||||
| L | Inferior posterior parietal cortex (supramarginal) | −64 | −52 | 36 | 3.93 | ||||
| R | Inferior posterior parietal cortex (supramarginal) | 60 | −24 | −28 | 5.08 | ||||
| R | Inferior posterior parietal cortex (supramarginal) | 60 | −52 | 40 | 4.41 | ||||
| Interaction of bilateral stimulation × load (unilateral versus bilateral during high load > unilateral versus bilateral during low load) | |||||||||
| R | Posterior superior parietal cortex | 20 | −84 | 40 | 4.09 | ||||
| L | Posterior superior parietal cortex | −18 | −74 | 48 | 3.94 | ||||
| R | Anterior fusiform gyrus | 30 | −54 | −12 | 3.78 | ||||
| R | Posterior fusiform gyrus | 56 | −74 | −6 | 3.75 | ||||
| L | Posterior fusiform post | −38 | −82 | −20 | 3.61 | ||||
All P < 0.001 (random effects analysis, df = 15).
Finally, our SPM analysis also allowed us to test for areas showing a significant interaction between the effects of competitive bilateral stimulation and of central attentional load, i.e. any areas across the whole brain where competitive suppression during bilateral field stimulation would worsen with higher central load [(unilateral minus bilateral during high load) > (unilateral minus bilateral during low load), analyzed separately for each unilateral side, left or right]. Such an interaction was selectively found bilaterally in posterior parietal cortex, and in fusiform areas (Table 4). Posterior parietal regions responded equally to bilateral and unilateral contralateral stimulation during the low-load task, but only to unilateral stimulation of the contralateral hemifield during the high-load task (Fig. 5D,E). This corresponds to an ‘extinction-like’ effect (see Introduction and Discussion) for contralateral visual inputs during bilateral stimulation, that was specific to high central load in this region. Fusiform regions showed a different interaction, with increased activity on bilateral versus unilateral stimulation during low load, but not during high load (Fig. 5F).
Analyses of Retinotopically Mapped Visual Areas
While the above analyses were performed for the whole brain using normalized images in SPM, we next examined effects of central attentional load on activity in specific visual cortical areas, as functionally defined by standard retinotopic mapping. This analysis was performed for 12 hemispheres of six individual participants (see fMRI Data Analysis above). These individual retinotopic maps also allowed us to divide each visual area into distinct eccentricity regions, in order to compare the load effects for central and peripheral representations of the visual field (initially in terms of two ‘inner’ and ‘outer’ bins of 2–8° and 8–14° from central fixation respectively, but later broken down further; see below).
Average activity during the visual load experiment was extracted from all voxels within V1, V2, V3/VP and ventral V4 areas, for each condition of peripheral visual stimulation and of central attentional load, in each of the 12 hemispheres. Figure 6 provides examples of activity clusters obtained by analysis of the low load minus high load contrast in individual participants, now overlain onto functional visual areas delimited by the retinotopic mapping procedure. Grand average results for each condition in each visual area are shown in Figure 7A.
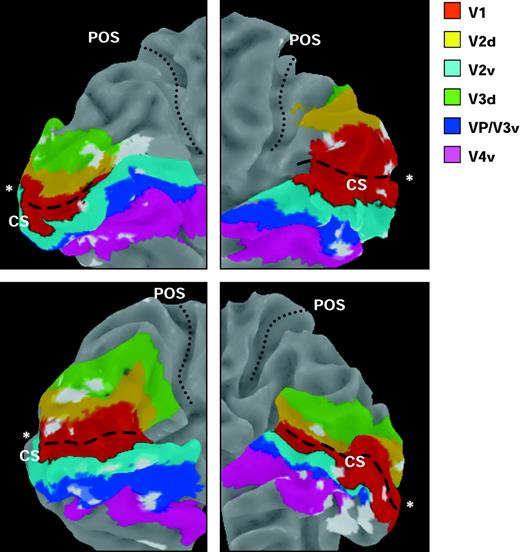
Three-dimensional reconstruction of medial occipital cortex where visual responses decreased during high versus low attentional load, in four representative participants (two left and two right hemispheres). Colored regions correspond to voxels that were assigned to distinct visual areas (V1, V2, V3, ventral V4) based on retinotopic mapping after cortical flattening. Regions colored in white correspond to clusters from individual SPMs (thresholded at P < 0.01) where significant decreases were found during high versus low central load, overlapped on the retinotopically mapped areas. These clusters were distributed across the different visual areas, including V1. Asterisks show the foveal region at the occipital pole. CS = calcarine sulcus; POS = parieto-occipital sulcus.
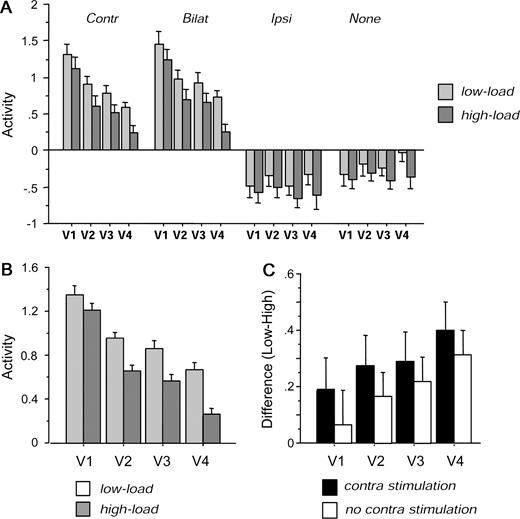
Activity in visual areas delimited by retinotopic mapping, across the different conditions of peripheral visual stimulation and of central attentional load. Data from 12 hemispheres of six participants in the load experiment were extracted from ROIs individually defined by retinotopic mapping (see main text and Materials and Methods). (A) Average parameter estimates of activity (±SE) for each area in each condition. (B) Mean activity for each area under low and high load, averaged over all conditions with checkerboards present in contralateral hemifield (i.e. for contralateral-unilateral and bilateral), showing a progressive effect of load from V1 to V4. Negative values for parameter estimates with ipsilateral or no checkerboards result from the mean-corrected data used in these individual analyses and do not reflect deactivation. (C) Mean difference in activity for low minus high load conditions, for each visual area, averaged over all conditions with contralateral visual stimulation (contralateral-unilateral and bilateral; black bars) or without contralateral stimulation (unilateral-ipsilateral and no checkerboards; white bars). The difference in activity is expressed in the same units as the parameter estimates. The impact of load not only increased from V1 to V4, but was generally larger in the presence of contralateral peripheral stimulation, especially in V1 and V2; load effects in subsequent areas occurred without as well as with contralateral stimulation. Same abbreviations as in Figure 2.
Critically, an effect of attentional load on responses to contralateral peripheral stimulation was observed within each retinotopic area, with significantly reduced activation for contralateral visual stimulation during high load as compared with low load (see Fig. 7B, which pools data from the contralateral-unilateral and bilateral checkerboard conditions, since both included contralateral hemifield stimulation and both exhibited similar load effects, as shown below).
This was confirmed by an ANOVA on the mean fMRI signal-values extracted from each area in each hemisphere, with load (high or low) and visual stimulus type (contralateral, ipsilateral, bilateral, or none) as within-factors, plus hemisphere (right or left), visual area (V1, V2, V3/VP or ventral V4, collapsed across upper and lower visual fields) and eccentricity representation (‘inner’ or ‘outer’, as defined above) as between-factors. There was no main effect of area [F(3,80) = 1.26], but a significant effect of stimulus type [F(3,240) = 243, P = 0.001, with stronger activation to bilateral or contralateral checkerboards than to ipsilateral or no checkerboards, as expected]. There was also a significant effect of eccentricity [F(1,80) = 10.2, P = 0.002, with greater activation in voxels representing the ‘inner’ than the ‘outer’ peripheral visual field]. More critically, the main effect of low minus high load was highly significant [F(1,80) = 13.5, P < 0.001]. Pairwise comparisons confirmed that activity was lower during the high than low load task within all retinotopic areas, including V1 [t(47) = 2.04, P = 0.04]; V2 [t(47) = 3.75, P = 0.005]; V3 [t(47) = 3.97, P = 0.002]; and V4 [t(47) = 4.05, P = 0.002]. There was no main effect or interaction involving hemispheric side (right or left).
In addition, this analysis revealed a significant interaction of load with peripheral stimulus type [F(3,240) = 3.48, P = 0.016] due to high central load producing large decreases in cortical activation for contralateral or bilateral hemifield stimulation [t(47) ≥ 2.41, P ≤ 0.019, across all areas), but much smaller or non-significant decreases in the condition with no peripheral checkerboard [t(47) = 1.84, P = 0.071, across all areas]. However, there was also a triple interaction of load with stimulus type and area [F(9,240) = 2.23, P = 0.021], reflecting not only the fact that load effects were generally greater at successive areas from V1 to V4 in the presence of contralateral visual stimulation (see Fig. 7B), but also that some effect of load occurred even in the condition with no peripheral stimulation for V4 [F(1,20) = 6.15, P = 0.022] and for V3 [F(1,20) = 4.27, P = 0.052]. On the other hand, these effects of load were not significant in the condition with no peripheral stimulation for earlier areas V2 [F(1,20) = 2.39, P = 0.14] or V1 [F(1,20) < 0.1, P > 0.95]. This pattern is illustrated further in Figure 7C, showing the difference in fMRI response between the low-load and high-load conditions, for each area.
Our results for functionally defined retinotopic areas converge with and also extend the SPM whole-brain analyses above, demonstrating that a reduction of cortical activation for the peripheral visual stimuli by higher attentional load at central fixation occurred throughout the visual cortex, including primary visual cortex, but was most pronounced in higher-level extrastriate areas. Moreover, whereas load effects were found primarily in the presence of contralateral peripheral visual stimulation in earlier areas such as V1, significant decreases in activation for representations of the contralateral visual field were also found even without peripheral stimulation at later cortical stages, such as V4.
In further agreement with the initial SPM analysis, our retinotopic analysis also revealed that none of the mapped visual areas exhibited a reduced activation during bilateral as opposed to contralateral-unilateral checkerboards, confirming that any sensory suppressive interactions between task-irrelevant competing peripheral stimuli in opposite hemifields do not arise at the level of early visual cortex, when attention is directed centrally. Note, however, that the whole-brain analyses above revealed that such competitive reduction was found within parietal cortex, thus beyond retinotopic visual areas.
Effect of Central Load on Activity in Visual Cortex Representing Different Peripheral Eccentricities
As mentioned above, our retinotopic eccentricity phase maps were used to delimit separate ‘eccentricity bins’ for the peripheral visual field within individual cortical areas (see fMRI Data Analysis), allowing us to test whether increased attentional load in the central task might affect distinct eccentricities in the visual field differentially; in particular, whether activity might be suppressed predominantly in the more peripheral portions of the visual field (‘tunnel vision’), or instead at more inner eccentricities (‘surround suppression’). The eccentricity maps extended up to ∼14° of visual angle (matching the extent of peripheral checkerboards) and were initially divided into two bins of ‘inner’ (∼2–8° from fixation) and ‘outer’ eccentricities (∼8–14° from fixation) within each visual area (see fMRI Data Analysis for details of this division and for the number of voxels in each resulting bin). Figure 8A plots average activity for each of these eccentricity bins. It can be seen that higher load in the central task produced a reduction of activity in response to a contralateral stimulus (i.e. on bilateral or contralateral-unilateral trials, but not ipsilateral or none) that was larger for voxels representing the ‘inner’ (2–8°) visual field than for those representing the ‘outer’ peripheral field, further away from the attended central stream (8–14°).
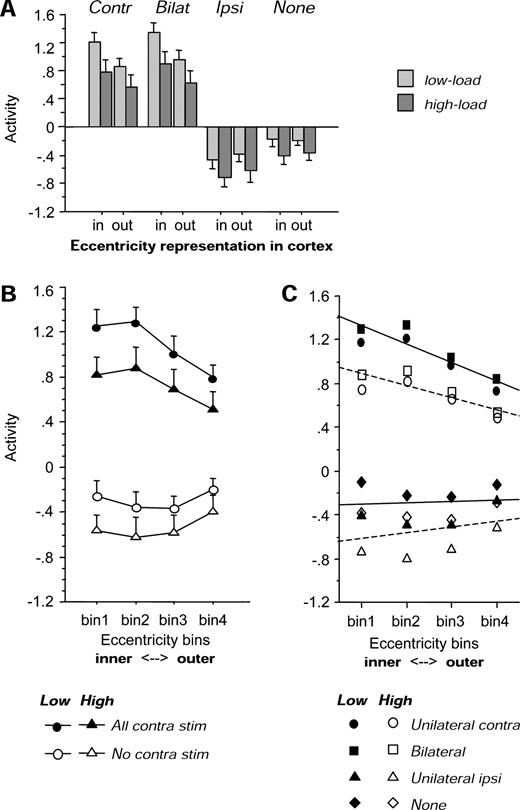
Effects of central load at different eccentricities in retinotopic cortex. (A) Average parameter estimates of activity (±SE) for each condition in visual cortex representing ‘inner’ (∼2–8°) or ‘outer’ (∼8–14°) parts of the visual field (pooled across all areas for simplicity here, as influences of eccentricity did not differ between areas, see main text). Specifically, during contralateral-unilateral and bilateral stimulation, higher load reduced neural responses at inner eccentricities more than at outer eccentricities, so that the differentiation between inner and outer cortical regions in parameter estimates of activity was now attenuated (compare ‘in’ and ‘out’ bars in light gray, versus ‘in’ and ‘out’ bars in dark gray). This pattern was found in each visual area. (B) Same data now further split into four bins of ∼3° eccentricity each, from inner field (bins 1 and 2) through to outer field representation (bins 3 and 4). Parameter estimates of activity (±SE) are averaged over conditions with contralateral visual stimulation (unilateral and bilateral; dark symbols) or without contralateral stimulation (ipsilateral and no checkerboards; white symbols). (C) Visual activations for each stimulation and load condition at each of the four eccentricity bins, with linear regression slopes illustrated for conditions with contralateral checkerboards (unilateral and bilateral) and without contralateral checkerboards (ipsilateral and none). The outer-to-inner gradient in activation during contralateral visual stimulation was significantly shallower during high than low load. Same abbreviations as in Figure 2.
The factor of eccentricity bin (inner/outer) had been included in the ANOVA described in the previous section, revealing not only a main effect of eccentricity [F(1,80) = 10.2, P = 0.002] but also an interaction with stimulus type [F(3,240) = 24.2, P < 0.001], as overall activity was greater at inner than outer eccentricity regions in the presence of contralateral-unilateral [t(47) = 7.66, P < 0.001] and bilateral stimulation [t(47) = 7.93, P < 0.001], but not without any peripheral stimulation or with only ipsilateral stimulation (see Fig. 8A). More critically, there was also a significant triple interaction of eccentricity × stimulus type × load [F(3,240) = 3.61, P = 0.013], due to the reduction of activity during high load being larger at inner than outer eccentricities especially during contralateral-unilateral or bilateral stimulation (Fig. 8A). Paired comparisons using the difference in activity between the low-load and high-load conditions confirmed a greater load effect in inner than outer eccentricity bins for contralateral-unilateral stimulation [across all areas, t(47) = 2.61, P = 0.012] and for bilateral stimulation [t(47) = 2.06, P = 0.043], but no such eccentricity difference for ipsilateral [t(47) = 1.66, P = 0.11] or absent peripheral stimulation [t(47) = 0.98, P = 0.33]. There were no two-way or higher-level interactions involving eccentricity with area [all F(3,80) < 0.24] because this differential eccentricity pattern for load effects was similar across all retinotopic areas. To take into account the overall different magnitude of signal at the different eccentricities, we also calculated a relative reduction ratio for each bin and each condition, as the difference between high and low load divided by the sum of activations during both conditions [i.e. (low − high)/(low + high)]. This also confirmed a significantly greater reduction for contralateral responses in the inner than outer eccentricity bins [mean ratios 7.2 versus 4.7%, t(47) = 2.23, P = 0.03]. These data suggest that the differential load effects as a function of eccentricity did not simply result from the general difference in signal magnitude for inner and outer regions.
These data therefore suggest that when more attentional capacity is allocated at central fixation, cortical activation for task-irrelevant contralateral peripheral stimulation (present during contralateral-unilateral and bilateral trials only) is reduced primarily for the representations of adjacent central portions of the visual field (consistent with ‘surround-suppression’ proposals; see Bahcall and Kowler, 1999; Plainis et al., 2001), but less so for the more eccentric locations that are further away from the central stimuli. This pattern is inconsistent with traditional proposals of ‘tunnel-vision’, on which visual processing should predominantly ‘shrink’ inwards from the periphery when a foveal task consumes much attentional capacity (e.g. Mackworth, 1965; Williams, 1985).
We further examined these eccentricity differences by splitting eccentricity maps of each visual area further down, now into four rather than two eccentricity bins per hemifield (i.e. corresponding to ∼2−5, 5–8, 8–11 and 11–14° from fixation, respectively). This finer division provided even stronger evidence for a graded effect of central load, which in the presence of contralateral stimulation was larger for ‘inner’ than for progressively more ‘outer’ parts of the visual field. Figure 8B shows average activity at each of these four eccentricity bins during contralateral visual stimulation (i.e. with contralateral-unilateral or bilateral checkerboards) and without contralateral stimulation (i.e. ipsilateral and no checkerboard), averaged across all retinotopic areas given that the critical eccentricity × load × stimulation effects did not interact with visual area. It can be seen, first, that an inner-through-to-outer field differentiation was apparent only with contralateral visual stimulation (with greater responses in the two inner bins), but not without stimulation of the contralateral hemifield; and second, that higher central load reduced this differentiation across eccentricities (with larger load decreases in the inner bins, during contralateral stimulation). This general pattern was confirmed by an ANOVA with the same factors as before, but now using four levels of eccentricity. This showed again significant interactions of eccentricity × stimulus [F(3,360) = 42.8, P < 0.001] and of eccentricity × stimulus × load [F(3,120) = 2.91, P = 0.002], in addition to the main effects of each factors. Again, these influences of eccentricity did not interact with area (F < 1).
Finally, to examine more precisely the influence of the four eccentricity bins on visual responses as a function of central load, we fitted linear regression functions to averaged cortical activity using our four eccentricity bins as the independent variable, for each of the stimulus and task conditions (across all areas given that this did not interact with the critical eccentricity effects above). This regression analysis showed a significant slope in the level of activation from the inner through to the increasingly outer eccentric parts of the visual field, for both contralateral-unilateral and bilateral stimulation, and critically with a much steeper linear effect of eccentricity during the low-load task [slope = 0.79 and 0.85, respectively; F(1,190) > 14.3, P < 0.002] than during the high-load task [slope = 0.48 and 0.62, respectively; F(1,190) > 3.25, P < 0.072]. These differences in slope were significant (paired t-test, P < 0.041). By contrast, there was no significant linear effect of eccentricity with just ipsilateral stimulation or no peripheral stimulation, irrespective of task load [all slopes < 0.14, F(1,190) < 2.33, P > 0.13]. This pattern is illustrated in Figure 8C for each of the peripheral visual stimulation conditions. These findings therefore confirm that the inner-through-to-outer field differentiation in visual responses to contralateral stimulation found during low load was significantly reduced by high central load, with more pronounced decreases in activations due to higher central load for less eccentric locations in the peripheral visual field, relative to more eccentric locations.
Discussion
By manipulating the attentional load of a RSVP task performed at central fixation, as well as the presence or absence of sensory competition for peripheral stimulation between the two hemifields, in a systematic orthogonal fashion, our fMRI experiment provided several important findings. Increasing attentional load at fixation produced prominent frontal and parietal activations, especially in the right hemisphere, consistent with other imaging studies using tasks with high attentional demands (Wojciulik and Kanwisher, 1999; Culham et al., 2001). More critically, increasing load in the central task reduced activations to salient peripheral visual stimuli throughout visual cortex, consistent with predictions from the psychological theory propounded by Lavie and Tsal (1994) and Lavie (1995). Detailed retinotopic analyses showed that (i) decreased activations for peripheral visual stimuli during high attentional load at fixation occurred even in V1; (ii) they became more pronounced for successive visual areas through to V4 (see Fig. 7); (iii) they were typically larger in the presence of contralateral stimulation (i.e. contralateral-unilateral or bilateral checkerboards), especially in V1, although some reduction also occurred even without peripheral checkerboards in higher-level areas such as V3 and V4 (see Fig. 7C); and (iv) the decreases in response to contralateral stimulation with high central load were more pronounced for inner than for outer peripheral eccentricities in the visual field (see Fig. 8), providing evidence against the classic view that high load at the fovea might induce ‘tunnel vision’ with predominant suppression of the more peripheral eccentricities (Mackworth, 1965; Williams, 1985; Chan and Courtney, 1998), but rather suggesting ‘surround suppression’ instead (e.g. Plainis et al., 2001).
In addition, by manipulating sensory competition between peripheral stimuli that appeared either unilaterally or bilaterally, we demonstrated that suppressive effects across the two hemifields produced distinct decreases in inferior parietal cortex, but not in early visual areas; and that this sensory competition between hemifields interacted with top-down effects of central attentional load only in higher-level areas, such as the posterior superior parietal cortex, where an ‘extinction-like’ pattern (i.e. contralateral response reduced on bilateral versus unilateral stimulation) was observed specifically during high load. These data reveal distinct neural substrates for the modulation of visual cortical responses as a function of central attentional load and of sensory competition across hemifields, with an integration of these combined influences in specific posterior parietal areas only. We consider the implications of these results below.
Reduced Processing of Peripheral Stimuli in Early Visual System Due to Increased Central Load
Our results show that simply changing the attentional demands for a constant stream of stimuli at fixation can change neural responses to salient peripheral stimuli throughout multiple visual areas. Our whole-brain analysis showed greater activation in bilateral occipital cortex during low than high load in the central task, with changes peaking in posterior extrastriate areas (see Fig. 4), while further analysis of retinotopic areas demonstrated that such effects of load occurred as early as V1, but progressively increased in successive areas, and were most pronounced in V4 (see Figs 6 and 7).
Across all visual areas, these suppressive effects of high central load were larger in the presence of checkerboard stimuli in the contralateral hemifield, as shown by a significant load × stimulation interaction in occipital cortex in both the whole-brain and retinotopic analyses. This was particularly so for V1, which showed no significant suppression by higher load at fixation in the absence of peripheral stimuli. This suggests that the load reductions in early visual areas may primarily affect stimulus-driven responses to peripheral distractors, as predicted by psychological accounts of perceptual load (Lavie and Tsal, 1994; Lavie, 1995), rather than by a more general shift in activity. In addition, higher-level areas V3 and V4 showed some reduction in activity during high attentional load even in the absence of peripheral checkerboards.
The increase in attentional effects from V1 through to V4 is reminiscent of the pattern observed for competitive suppression between simultaneous visual stimuli within retinal quadrants (Kastner et al., 1998, 2001), that was previously attributed to the receptive field size of neurons in these areas (small in V1, but larger in V4), leading to greater overlap between stimuli and to greater suppressive effects in V4 than V1. However, a greater modulation of V4 than V1 may also arise for ‘baseline shifts’ of activity due to spatially directed attention in the absence of visual stimuli (Kastner et al., 1999). Here, we found increasing attentional effects from V1 to V4 under purely top-down influences, due to the central task load, rather than to bottom-up competition between concurrent stimuli. These data suggest that V4 may constitute a critical ‘gate’ for visual processing along the ventral cortical stream (McAdams and Maunsell, 1999; Mehta et al., 2000; see also Pinsk et al., 2004).
Our findings that top-down attentional load of a central task at fixation can modulate visual responses to peripheral distractors in early retinotopic cortex, including V1, substantially extend previous results (Rees et al., 1997) which had showed that increased task load may reduce processing of irrelevant motion patterns in MT+/V5. Only marginal changes were seen in earlier visual areas in that study. Our data also go beyond imaging results indicating that attention can modulate activity in early retinotopic areas in a spatially specific manner for stimuli at attended locations (Tootell et al., 1998a; Brefczynski and DeYoe, 1999; Ghandi et al., 1999) or even in the absence of stimuli (Kastner et al., 1999). Previous studies indicated that performing a foveal task (compared with passive viewing or peripheral attention) can reduce fMRI activation in peripheral regions of retinotopic cortex (e.g. Somers et al., 1999), whereas directing attention to the peripheral visual field (compared with passive viewing) may conversely reduce activation in foveal retinotopic cortex (e.g. Tootell et al., 1998a). However, in the latter studies, spatial attention could be freely distributed across both the central and peripheral field during passive viewing. In our study, attention was always required at the fovea across the two task conditions, while only the perceptual load for the central RSVP task was varied. Our findings firmly establish that activation of visual cortex for peripheral stimulation at irrelevant locations can vary with central load, when the task requires attention at fixation throughout.
Smith et al. (2000) also observed that the performance of a central task may decrease activity for peripheral regions of retinotopic cortex, in the absence of peripheral stimuli in that study, but these changes arose in the context of different central stimuli (e.g. with versus without central events, or with versus without targets in the central stream), unlike here. Similarly, a pioneering study by O'Connor et al. (2002) described reduced activation of visual cortex by peripheral stimuli when changing attentional load in a foveal task (see their fig. 2D), although their report primarily concerned the LGN. They did not report statistical details for the load effects in individual cortical areas, but their figures suggest no reliable effect in V1. Moreover, that study used different central stimuli during the low and high-load tasks, unlike our study.
In another recent study published subsequent to our own submission, Pinsk et al. (2004) also found decreased responses in V4 and TEO for contralateral peripheral distractors when attentional load was increased for task-relevant peripheral stimuli in the other hemifield; but no effect was found in earlier areas. While those data are in broad agreement with our own, here we show consistent decreases during high central load (rather than peripheral load, as in Pinsk et al., 2004) from V1 to V4. Moreover, several differences in the stimuli and tasks used may explain some apparent slight discrepancies between the two studies (e.g. Pinsk et al. presented small colorful stimuli in the upper visual field at slower rates, and all distractors remained the same while attended targets changed, possibly leading to some adaptation in fMRI responses for distractors as noted by those authors). Many of the further issues addressed in our study (e.g. manipulating the presence or absence of bilateral sensory competition between hemifields for task-irrelevant distractors, and any interaction of this with central load; how central load may differentially affect different eccentricities in the peripheral visual field, and so on) were not considered or addressed in the Pinsk et al. (2004) study, and the results for these issues are shown for the first time here.
In conclusion, our new findings confirm but also extend previous suggestions that activity in peripheral regions of visual cortex can be reduced by high attentional load at fixation, even without peripheral stimulation (for some areas), and here without any physical changes whatsoever in either the central or peripheral visual stimuli. We further demonstrated that the effects of central load are stronger with than without contralateral checkerboards (especially in V1); stronger in later areas (especially in V4); and stronger for ‘inner’ than ‘outer’ eccentricities (see below).
We note also that our whole-brain analysis across all 16 participants found robust responses in the LGN to contralateral and bilateral checkerboards (Fig. 3), but no reliable decreases with attentional load. This result accords with some neurophysiological monkey data (Mehta et al., 2000; Bender and Youakim, 2001), although a modulation of the LGN was found in a study comparing spatially lateralized to divided attention (Vanduffel et al., 2000). Moreover, fMRI results of O'Connor et al. (2002) in four participants suggested that the LGN can be modulated by various attentional factors, including foveal load. The exact reasons for this apparent discrepancy with respect to effects in the LGN are unknown, but the present results indicate that visual cortex can be modulated by central load without corresponding modulation of LGN, even when LGN activation can be observed (see Fig. 3). One possible explanation is that in our study, the central stimuli were kept identical for high and low-load tasks, whereas they differed between conditions in O'Connor et al. (e.g. with transient color changes occurring in the central stream only during their low-load task). Alternatively, attentional filtering in the LGN might saturate even during low load in our RSVP task, with further modulation during high load arising cortically instead.
Load and Eccentricity in Retinotopic Cortex: ‘Surround Suppression’ rather than ‘Tunnel Vision’
Our fMRI study is the first to test the retinotopic effects of foveal attentional load not only along the hierarchy of areas from V1 to V4, but also for different eccentricity bins within each area (i.e. for inner versus outer representations of the visual field). Our results show that attentional demands at fixation impact on activity for task-irrelevant portions of the visual field in an unequal manner, with greater effects on responses to contralateral stimulation on visual cortex representing the ‘inner’ hemifield than on cortex representing the more peripheral ‘outer’ extent (see Fig. 8). We found a significant inner-to-outer field differentiation in activation, with a progressive gradient from inner to outer eccentricities, that was seen only in response to contralateral checkerboards and was significantly reduced during high load at fixation (Fig. 8C). Importantly, these differential effects of load across eccentricities remained significant even when taking into account the fact that the magnitude of responses to checkerboards was generally higher in inner than outer regions.
These results do not support the view that increased foveal attention may cause a disproportionate reduction for the most eccentric locations in the visual field, as if producing ‘tunnel vision’ with a concentric restriction of the functional visual field (Mackworth, 1965; Williams, 1985; Chan and Courtney, 1993). Instead, our data converge with recent psychophysical findings (e.g. Plainis et al., 2001) that foveal load can impair visual thresholds for stimuli at inner more than outer eccentricities (within versus beyond 10° in that study). This may also accord with further behavioral observations that selective attention to a location can suppress the processing of irrelevant inputs more strongly when the latter are close to the target (Eriksen et al., 1993; Bahcall and Kowler, 1999; Slotnick et al., 2002). Moreover, recent results in the macaque suggest that increased focusing of attention can suppress activity in a retinotopic band surrounding the representation of an attended stimulus within striate cortex (Vanduffel et al., 2000), and also modify the center-to-periphery gradient of the receptive fields of extrastriate neurons (Ben Hamed et al., 2002).
Our results provide strong fMRI evidence in humans that increased attentional load at fixation can reduce stimulus activation for surrounding inner peripheral locations, more so than for distant eccentricities, consistent with recent proposals of attention-related ‘surround suppression’ (Bahcall and Kowler, 1999; Plainis et al., 2001) rather than ‘tunnel vision’. Further studies are needed to establish whether similar effects are found for an attentional focus away from central fixation (cf. Pinsk et al., 2004).
Sensory Competition between Hemifields and ‘Extinction-like’ Effects in the Normal Brain
Our study also tested for competitive effects arising due to simultaneous inputs in the two hemifields, reflecting sensory competition rather than load-dependent suppression. Between-hemifield competition can induce perceptual extinction in patients with attentional deficits (e.g. Kinsbourne, 1977; Heilman and Van Den Abell, 1980; Driver and Vuilleumier, 2001), suggesting a competition for processing resources between hemispheres (Pollmann, 1996; Pollmann and Zaidel, 1998; Mesulam, 1999; Hilgetag et al., 2001), and such effects in patients tend to worsen with increased task load (Vuilleumier and Rafal, 2000). Moreover, imaging studies in healthy humans and single-cell recordings in monkeys have found suppressive interactions in visual responses when stimuli are simultaneously presented within the same retinal quadrant (Kastner and Ungerleider, 2000; Kastner et al., 2001) or within the same receptive field (Moran and Desimone, 1985; Luck et al., 1997).
However, the present fMRI study clearly found no response suppression to contralateral checkerboards within visual cortex, due to the addition of a second checkerboard in the other hemifield (i.e. for unilateral minus bilateral conditions). Such effects were only found in higher areas, within parietal cortex. This lack of competitive suppression in visual cortex contrasts with the substantial effects of central attentional load within these areas. Our results suggest that competitive suppression between the two hemifields may not occur in early cortical areas where neurons have strictly contralateral receptive fields, but arise only at higher levels where both ipsilateral and contralateral space is represented (Leinonen et al., 1979; Luck et al., 1997; Pouget and Sejnowski, 1997; Tootell et al., 1998b). Importantly, our factorial design allowed us to systematically manipulate load and competition in an independent manner, and to directly examine possible interaction of attentional resources with sensory competition (either due to local intrinsic suppression or long-range interactions beyond the classic receptive field in occipital cortex). Thus, a formal test of whether spare attentional resources differentially modulated responses to unilateral versus bilateral displays was provided by our SPM whole-brain analysis. In addition to the lack of effect in retinotopic occipital areas, this analysis revealed a significant interaction in posterior parietal and fusiform regions alone.
Our findings differ strikingly from Fink et al.'s (2000) report that PET activation in visual cortex for contralateral stimuli may be reduced by adding simultaneous stimuli in the other hemifield. This is likely to reflect the fact that in the Fink et al. (2000) study, participants had to report the peripheral stimuli (letters), and in bilateral blocks they had to attend to one specified hemifield in advance (reporting letters on this side first). This could presumably have led to differential top-down influences on visual cortex during the bilateral blocks, rather than purely sensory-driven competition. By contrast, in our study, the peripheral stimuli were always task-irrelevant, regardless of their bilateral or unilateral presentation, and regardless of central load.
In contrast with the lack of sensory competition between hemifields in early visual areas, the comparison of unilateral minus bilateral stimulation did show a significant ‘extinction-like’ effect in inferior parietal cortex, near the temporoparietal junction, as revealed by our whole-brain analyses (see Fig. 5). This suggests that these parietal regions may include neurons with ipsilateral as well as contralateral receptive fields (Leinonen et al., 1979; Ben Hamed et al., 2001), thus providing a site where double simultaneous stimulation across the two hemifields can cause mutually suppressive interactions (Pouget and Driver, 2000; Driver and Vuilleumier, 2001). Also in contrast to early retinotopic activity, these parietal effects showed a striking hemispheric asymmetry, which might relate to well-known asymmetries in neurological deficits of spatial attention (Heilman and Van Den Abell, 1980; Mesulam, 1999). Here, the left supramarginal gyrus responded to unilateral right checkerboard stimuli, whereas the right supramarginal gyrus responded to either left or right unilateral stimuli, more than to bilateral stimuli (see also Corbetta et al., 1993; Corbetta and Shulman, 2002). There was no effect of attentional load in these areas (Fig. 5). In addition, the right intraparietal sulcus also responded to left more than right or bilateral stimuli, but showed a general increase during high versus low load irrespective of visual stimulation.
These asymmetries support the longstanding view that right parietal regions may represent bilateral space, while left regions represent only the contralateral right side (Heilman and Van Den Abell, 1980; Mesulam, 1999). Moreover, Corbetta and Shulman (2002) recently suggested that the right inferior parietal cortex may be involved in stimulus-driven responses to previously unattended locations. Our new data suggest that sensory competition between hemifields arises within neural systems in inferior parietal cortex thought to be involved in stimulus-driven attentional mechanisms, rather than within lower-level areas of the visual system. Our finding that right inferior parietal cortex responded to both left and right peripheral stimuli, whereas left parietal cortex responded only to right stimuli, also accords with perceptual extinction occurring primarily after lesions in right inferior parietal regions (Karnath et al., 2003). In such patients, the intact left parietal cortex may favor orienting to right contralateral stimuli; whereas in left parietal patients, intact regions in the right hemisphere can monitor stimuli from either left or right hemifield (cf. Heilman and Van Den Abell, 1980; Mesulam, 1999).
Finally, we identified regions that selectively showed an interaction between bilateral sensory competition and central load (Fig. 5). In particular, posterior parietal cortex showed reduced responses for bilateral versus contralateral stimulation only during high but not low attentional load, i.e. thus producing an ‘extinction-like’ effect in normals. This interaction arose in a posterior part of the intraparietal sulcus, just anterior to the parieto-occipital sulcus, previously found to activate in a variety of attention-demanding visual tasks (Wojciulik and Kanwisher, 1999; Culham et al., 2001). This posterior parietal region may play a critical role in integrating inter-hemifield stimulus-driven competition with goal-directed mechanisms in selective visual processing. These findings also indicate that distinct areas in parietal cortex make different contributions to visual attention.
We also note that none of the positive findings considered in this section would have been observed if we had restricted our analyses to retinotopic visual cortex only, instead of also assessing the whole brain SPMs.
Conclusions
Our study has shown that foveal attentional load and competition between simultaneous peripheral stimulation in opposite hemifields affect distinct brain areas, but also interact in selective regions of parietal cortex. Purely top-down increases in attentional load at fixation decreased responses to peripheral distractors in early visual cortex, with such reduction increasing for successive visual areas (i.e. from V1 to V4). In addition, effects of central load or responses to contralateral visual stimuli were larger for inner than outer eccentricities in visual cortex, suggesting attentional surround-suppression rather than strict tunnel vision. By contrast, sensory competition between bilateral stimuli did not arise in visual cortex itself but in parietal areas, where ‘extinction-like’ effects were observed, some of which depended on attentional load. These parietal regions also showed hemispheric asymmetries that may relate to pathological extinction and neglect in neurological patients after right brain damage.
This study was supported by Swiss National Science Foundation grants (3100A0-102133 to S.S.; 632-65935 to P.V.) and by a Wellcome Trust programme grant to J.D. Thanks to Nilli Lavie, Geraint Rees, Bob Turner, and radiographers of the FIL. Preliminary results were presented in a poster at the Cognitive Neuroscience Society meeting in New York (2003).
References
Amunts K, Malikovic A, Mohlberg H, Schormann T, Zilles K (
Bahcall DO, Kowler E (
Bender DB, Youakim M (
Ben Hamed S, Duhamel JR, Bremmer F, Graf W (
Ben Hamed S, Duhamel JR, Bremmer F, Graf W (
Brefczynski JA, DeYoe EA (
Brewer AA, Press WA, Logothetis NK, Wandell BA (
Chan HS, Courtney AJ (
Chan HS, Courtney AJ (
Corbetta M, Shulman GL (
Corbetta M, Miezin FM, Shulman GL, Petersen SE (
Culham JC, Cavanagh P, Kanwisher NG (
de Fockert JW, Rees G, Frith CD, Lavie N (
Desimone R, Duncan J (
DeYoe EA, Carman GJ, Bandettini P, Glickman S, Wieser J, Cox R, Miller D, Neitz J (
Drevets WC, Raichle ME (
Driver J, Vuilleumier P (
Driver J, Eimer M, Macaluso E, Velzen V (
Engel SA, Glover GH, Wandell BA (
Fink GR, Marshall JC, Halligan PW, Dolan RJ (
Fink GR, Driver J, Rorden C, Baldeweg T, Dolan RJ (
Friston KJ, Holmes AP, Worsley KJ, Poline JB, Frith CD, Frackowiak RSJ (
Friston KJ, Fletcher P, Josephs O, Holmes A, Rugg MD, Turner R (
Ghandi S, Heeger D, Boyton G (
Heilman KM, Van Den Abell T (
Hilgetag CC, Theoret H, Pascual-Leone A (
Holmes DL, Cohen KM, Haith MM, Morrison FJ (
Ikeda M, Takeuchi T (
Johnson DN, McGrath A, McNeil C (
Kanwisher N, Wojciulik E (
Karnath HO, Himmelbach M, Kuker W (
Kastner S, Ungerleider LG (
Kastner S, Ungerleider LG (
Kastner S, De Weerd P, Desimone R, Ungerleider LG (
Kastner S, Pinsk MA, De Weerd P, Desimone R, Ungerleider LG (
Kastner S, De Weerd P, Pinsk MA, Elizondo MI, Desimone R, Ungerleider LG (
Kinsbourne M (
Kinsbourne M (
Lavie N (
Lavie N (
Lavie N, Fox E (
Lavie N, Tsal Y (
Leinonen L, Hyvarinen J, Nyman G, Linnankoski I (
Luck SJ, Chelazzi L, Hillyard SA, Desimone R (
McAdams CJ, Maunsell JH (
Mehta AD, Ulbert I, Schroeder CE (
Mesulam MM (
Miller EK, Gochin PM, Gross CG (
Moran J, Desimone R (
O'Connor DH, Fukui MM, Pinsk MA, Kastner S (
Pinsk MA, Doniger GM, Kastner S (
Plainis S, Murray IJ, Chauhan K (
Pollmann S (
Pollmann S, Zaidel E (
Pouget A, Driver J (
Pouget A, Sejnowski TJ (
Rantanen EM, Goldberg JH (
Rapcsak SZ, Watson RT, Heilman KM (
Rapcsak SZ, Verfaellie M, Fleet WS, Heilman KM (
Rees G, Frith CD, Lavie N (
Reynolds JH, Chelazzi L, Desimone R (
Sereno MI, Dale AM, Reppas JB, Kwong KK, Belliveau JW, Brady TJ, Rosen BR, Tootell RB (
Simpson JR, Jr., Drevets WC, Snyder AZ, Gusnard DA, Raichle ME (
Skudlarski P, Constable RT, Gore JC (
Slotnick SD, Hopfinger JB, Klein SA, Sutter EE (
Smith AT, Singh KD, Greenlee MW (
Somers DC, Dale AM, Seiffert AE, Tootell RB (
Teo PC, Sapiro G, Wandell BA (
Tootell RB, Hadjikhani N (
Tootell RB, Mendola JD, Hadjikhani NK, Ledden PJ, Liu AK, Reppas JB, Sereno MI, Dale AM (
Tootell RB, Hadjikhani N, Hall EK, Marrett S, Vanduffel W, Vaughan JT, et al. (
Tootell RB, Mendola JD, Hadjikhani NK, Liu AK, Dale AM (
Treisman A, Gormican S (
Vanduffel W, Tootell RB, Orban GA (
Vuilleumier P, Rafal R (
Wandell BA, Chial S, Backus BT (
Warnking J, Dojat M, Guerin-Dugue A, Delon-Martin C, Olympieff S, Richard N, Chéhikian A, Segebarth C (
Author notes
1Laboratory for Neurology and Imaging of Cognition, Departments of Neurosciences & Clinical Neurology, University of Geneva, Switzerland, 2Institute of Cognitive Neuroscience, University College London, UK, 3Department of Psychology, University of Geneva, Switzerland, 4Wellcome Department of Imaging Neuroscience, Institute of Neurology, London, UK and 5Dipartimento di Psicologia, Università di Milano, Bicocca, Italy