


Abstract
Graphical genome maps are widely used to assess genome features and sequence characteristics. The CGView (Circular Genome Viewer) software family is a popular collection of tools for generating genome maps for bacteria, organelles and viruses. In this review, we describe the capabilities of the original CGView program along with those of subsequent companion applications, including the CGView Server and the CGView Comparison Tool. We also discuss GView, a graphical user interface-enabled rewrite of CGView, and the GView Server, which offers several integrated analyses for identifying shared or unique genome regions relative to a collection of comparison genomes. We conclude with some remarks about our current development efforts related to CGView aimed at adding new functionality while increasing ease of use.
Introduction
Genome maps can effectively convey information that can aid in understanding the biological properties and evolutionary history of organisms. For example, on a map that displays the positions of genes, the judicious use of color and text can highlight gene families or functions of interest, to indicate that a genome has the capacity to produce the components of a particular pathway. Additional information relating to specific positions of the sequence can be displayed to further aid in interpretation. For example, including a GC content graph and BLAST comparison results may reveal that key components of the pathway were likely acquired through horizontal gene transfer. Further feature types of potential value include the positions of sequence differences with respect to a closely related genome, gene expression information at the level of transcription or protein abundance, the positions of contig boundaries for incomplete genomes and sequence coverage information.
Numerous genome visualization tools exist [1]. Genome browsers like Ensembl [2], IGV [3] and JBrowse [4] offer an impressive array of features including interfaces for searching and map customization, and can be applied to eukaryotic and prokaryotic genomes. However, given the relatively small size and in most cases circular topology of bacterial chromosomes, a variety of bacterial-specific visualization tools have been developed. Recent examples include Circleator [5], CiVi [6] and SynTView [7]. These tools lack many of the capabilities of full-genome browsers but can be used to quickly generate visually appealing and compact circular maps that are often used in publications to highlight specific findings of interest or to convey summary information. Our focus in this review is on bacterial genome visualization software, specifically on the Circular Genome Viewer (CGView) family of visualization tools.
The Circular Genome Viewer
CGView (http://wishart.biology.ualberta.ca/cgview/) is a Java program developed in 2005 as a tool for generating high-quality, navigable maps of circular genomes [8]. Originally intended for bacterial genomes, it has proven to be popular for organellar genomes as well. CGView supports a custom XML (Extensible Markup Language) input format for describing the contents and appearance of a map, which the program then converts into graphical format. Bitmap images (PNG or JPG) or vector-based output in SVG (Scalable Vector Graphics) format can be generated. The SVG format offers advantages for image editing and printing, but the file size can be problematic when complex maps are generated. The contents of a sample XML file and the resulting map generated by CGView are shown in Figure 1. Simpler input formats are supported, which allow the positions of genes to be described, but which offer less control over how the information is displayed. Also provided is a well-documented API (application program interface), which allows the CGView Java code to be used in other applications. For example, the BRIG program [9] uses CGView code and its associated API to generate maps displaying the results of sequence similarity comparisons between a bacterial genome of interest and other genomes.
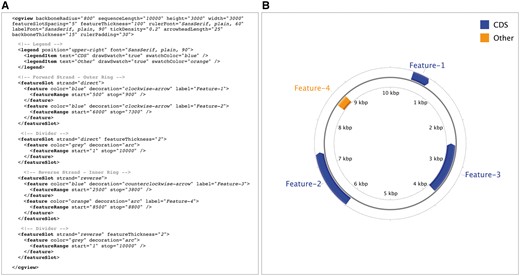
CGView converts the contents of an XML file (A) into a graphical map (B). The XML describes general characteristics of the map (height, width and font styles and sizes, for example) as well as the features that are to be depicted. Each feature can have one or more ranges drawn on the map, the positions of which are described using ‘featureRange’ elements. Features are grouped by ‘featureSlot’ elements, which represent rings on the graphical map. A full description of the XML format and additional examples is available on the CGView Web site.
The CGView application remains a popular genome visualization tool; however, the process of creating a map is intimidating and laborious for many users. First, CGView is a command-line tool, meaning that users must enter specific commands and options in a command-line environment. Although command-line interfaces offer important advantages, many users understandably prefer an intuitive graphical user interface provided via a Web server or stand-alone application. Second, CGView itself does not identify sequence features or perform sequence analyses. Instead, the user must use other software to identify features of interest and then provide that information in a format that CGView supports. Although the CGView application download includes documentation on how to do this as well as a script for converting GenBank or EMBL files into an XML file suitable for CGView, many users are likely to lack the experience or inclination to build the required input files.
Map creation simplified: the CGView Server
CGView’s command-line interface and API allow it to be easily incorporated into more capable visualization tools or pipelines. One such tool is the CGView Server (http://stothard.afns.ualberta.ca/cgview_server/), a Web server released in 2008 that offers a convenient interface to CGView and has built-in analysis capabilities [10]. For example, up to three sequence data sets (protein or DNA) can be uploaded to the server, along with the primary genome sequence of interest (also termed the ‘reference sequence’). BLAST is used to compare the reference sequence with each of the uploaded data sets, and the results are included on the map. If the reference sequence is uploaded in GenBank or EMBL format, feature information is extracted and also displayed. A variety of other feature types can be identified or calculated and displayed (open reading frames, start and stop codons, GC content and GC skew) or uploaded in a simple tab-delimited format. Internally, the CGView Server generates the map using CGView and an XML input file that it builds according to the user-supplied options, information extracted from the reference sequence and the BLAST analysis results. Users can choose to have the server return a map displaying the entire sequence, or, thanks to the zooming capabilities of CGView, a portion of the genome at an expanded size (Figure 2).
![A map generated using the CGView Server, showing a full view of the genome (A) and an expanded view of a region of interest (B). The contents of the feature rings (starting with the outermost ring) are as follows: Ring 1 and Ring 2 depict features from the forward and reverse strands, respectively, read from the primary sequence file (E. coli NRG857c; accession: CP001855); Ring 3 (E. coli LF82; accession: CU651637); Ring 4 (E. coli K12 substr. MG1655; accession: NC_000913) and Ring 5 (E. coli O157:H7 str. Sakai; accession: NC_002695) shows BLAST comparison results (BLASTN) with the primary sequence; Ring 6 shows putative NRG857c genomic islands indicative of horizontal gene transfer [11]; Ring 7 shows GC content; and Ring 8 shows GC skew. The BLAST comparison results are drawn at partial opacity—darker regions indicate the presence of multiple hits to the corresponding portion of the reference sequence.](https://oup.silverchair-cdn.com/oup/backfile/Content_public/Journal/bib/20/4/10.1093_bib_bbx081/2/m_bbx081f2.jpeg?Expires=1716357302&Signature=HW4deQjQQDFaI1W6P0BcVEkhvVBVD-fnNjTMMq6PmTaY-V4EvZvFtfS~zw6sDBlB~wM5kmh5TO1onvv2ElXE7VqhKW0bPW5ut4CXb5zVnhVX1Uk2BBE-Qh72feyZMDlEGlb1HeTs-AelBfMN8RTE1uVm3YNnXNeNAebuFnl9Jqz1w9BjgKJymqZYisyQt3aFQeWk~oHxUPIurEtzNhOnKEYFaXHUftZheIKmniHp7tCFOYOIzcQDCfD1J81jmoMTIq-lcuQxIRohh2EnUdOsbX2nLOcKjNPeST-BOuyX7rFrtOummj3lTSi~V1isbkpodt~-wX6Vkkguvjfkf-xN5g__&Key-Pair-Id=APKAIE5G5CRDK6RD3PGA)
A map generated using the CGView Server, showing a full view of the genome (A) and an expanded view of a region of interest (B). The contents of the feature rings (starting with the outermost ring) are as follows: Ring 1 and Ring 2 depict features from the forward and reverse strands, respectively, read from the primary sequence file (E. coli NRG857c; accession: CP001855); Ring 3 (E. coli LF82; accession: CU651637); Ring 4 (E. coli K12 substr. MG1655; accession: NC_000913) and Ring 5 (E. coli O157:H7 str. Sakai; accession: NC_002695) shows BLAST comparison results (BLASTN) with the primary sequence; Ring 6 shows putative NRG857c genomic islands indicative of horizontal gene transfer [11]; Ring 7 shows GC content; and Ring 8 shows GC skew. The BLAST comparison results are drawn at partial opacity—darker regions indicate the presence of multiple hits to the corresponding portion of the reference sequence.
Some notable limitations of the CGView Server include support for only three comparison sequence data sets, the absence of vector-based output and reduced control over the appearance of maps compared with when the CGView application is used directly. The sequence comparison limitation exists to reduce the workload for the server. Vector-based output, SVG in the case of CGView, is not supported because the resulting files can be too large to send by e-mail even when compressed (the CGView Server sends the final map to the e-mail address supplied by the user). Instead, all maps are 3000 × 3000 pixels in PNG format. Finally, the reduced control over map appearance is the result of providing a simplified Web interface for controlling map appearance that does not provide the full flexibility of the XML format used by CGView.
Comparing thousands of genomes using the CGView Comparison Tool
Following the release of the CGView Server, we frequently received requests from users of the server who wanted maps to be modified. Typical requests included the addition of further comparison data sets, the changing of font sizes or feature colors, the creation of larger maps and the labeling of specific genes or features of interest. Over time, we developed a software pipeline that we used to handle these requests. This pipeline consists of a variety of scripts to build or modify complex maps potentially involving thousands of sequences. Eventually, we released this pipeline as the CGView Comparison Tool (CCT) (http://stothard.afns.ualberta.ca/downloads/CCT/) [12].
Although CCT is a command-line tool, its use is simplified through wrapper scripts that automate the map building process—creating a map can involve a few simple commands. For example, the map comparing Escherichiacoli O157:H7 str. Sakai with 100 additional E. coli genome sequences (Figure 3) required four simple commands to generate (one to download the primary sequence; one to start a map project; one to download the comparison sequences; and one to complete the map). The last command generates several maps automatically, differing in terms of size and level of detail, as well as in terms of how the BLAST comparisons are done (at the nucleotide level or at the level of translated coding sequences). The maps depicting translated coding sequence comparisons also, by default, display COG (Cluster of Orthologous Groups) classifications, generated through the use of a COG sequence database [13]. The contents and appearance of the maps can be changed from the default settings using a simple configuration file present in the map project directory, and by using command-line options. Additional custom feature types can be shown, as described in the tutorials section of the CCT Web site.
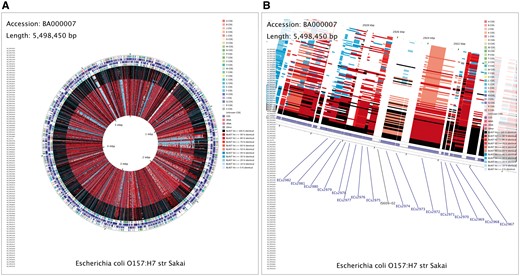
CCT map comparing E. coli O157:H7 str. Sakai (accession BA000007) with 100 additional E. coli genome sequences. A full-genome view (A) and zoomed view (B) are shown, with the latter centered on Shiga toxin I subunit A and B genes, labeled as ECs2974 and ECs2973, respectively. The contents of the feature rings (starting with the outermost ring) are as follows: Ring 1: COG functional categories for forward strand coding sequences; Ring 2: forward strand sequence features; Ring 3: reverse strand sequence features; Ring 4: COG functional categories for reverse strand coding sequences. The next 100 rings show regions of sequence similarity detected by BLAST comparisons conducted between CDS (coding DNA sequence) translations from the reference genome and those from 100 E. coli comparison genomes.
CCT is well suited to the analysis of large collections of complete or partial genomes generated through high-throughput sequencing, as thousands of comparison genomes can be displayed on a single map simply by placing each of their respective contig files (in GenBank, EMBL or FASTA format) in the ‘comparison_genomes’ directory of a CCT project. Metagenomes can be included as comparison genomes, in which case the map will serve to indicate which portions of the reference genome are similar to sequences in the metagenomes. In some scenarios, it may be of interest to generate many different maps, using a variety of reference genomes. CCT, by virtue of its command-line interface, can be run repeatedly from a script to generate separate maps for a group of reference sequences of interest. Alternatively, users can use the included ‘build_blast_atlas_all_vs_all.sh’ script. This script generates a separate map for each genome in a group of completed genomes, comparing the genome to all the others in the collection. The advantage of generating multiple maps in this manner is that the non-conserved regions of each genome can be found as regions lacking BLAST hits when the genome serves as the reference.
GView: CGView reloaded
CGView, the CGView Server and CCT are popular research and visualization tools, as they provide the means to generate the kinds of circular genome maps most often desired by the research community while largely shielding the end user from the computational complexity required for their construction. At the time of its original development, the available processing power in most commodity computing hardware limited CGView to the generation of static output, thus limiting its interactivity. Over time, the processing power in most personal computers had improved to the point that the development of CGView capable of user interaction, such as panning and zooming, seemed plausible. This motivated us to redevelop CGView as a stand-alone Java application that could quickly render and allow the end user to interact with even large genome maps in real time.
GView (https://www.gview.ca) is a complete rewrite of the CGView program that preserves the aesthetic of the original and many of its most popular features [14]. GView fully supports the CGView XML format, has a public API that facilitates its incorporation into other Java programs and has a command-line interface that allows it to be run from scripts. GView also introduces a number of new features that address the main limitations of CGView. Aside from its real-time interactivity, the most notable new feature is the addition of linear maps. The linear map view is often used to depict zoomed-in regions of the genome, where the features are clearly defined, and can be helpful to convey the comparative synteny of those features in multiple genomes. Another major enhancement is the addition of the Style Editor (Figure 4). This utility allows users to customize nearly every aspect of their maps including the backbone, legends, ruler, features, labels and plots. Customizations can be separately saved as a ‘genome stylesheet’, similar in concept and design to the Cascading Style Sheets format used to apply styles to Web pages. Other features implemented in GView include parallel processing capability, a ‘birds-eye-view’ to keep track of zoomed in views relative to the full map, stabilized label placement when zooming in and out of maps and compatibility with the GenBank, EMBL and GFF3 genomic file formats standardly used to record information about protein-coding sequences, ribosomal RNA, transfer RNA and other genomic features that are commonly displayed on circular genome maps.
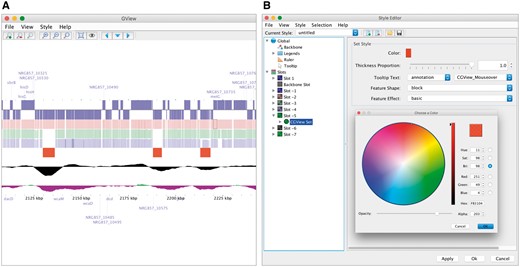
A genome map (A) drawn by GView from an XML file created by the CGView Server. The GView Style Editor (B) allows numerous properties of the map to be adjusted interactively.
The GView Server
Like CGView, GView has a companion Web application, the GView Server (http://server.gview.ca), to assist users in performing commonly desired comparative genomics analyses and rendering the corresponding genome maps (Figure 5). Users supply sequence files corresponding to a reference genome and optional comparison genomes, and an analysis type. The available analysis types are listed and described in Table 1. The GView Server then guides the user through the process of performing the specified analysis and customizing the initial style for the map. In-line help and tooltips are provided for nearly all the analysis parameters and other options involved in the procedure. The completed request is sent to a queue for processing and the end user provided a job identifier, which can be used to check on the status of the analysis. A simple analysis involving one or a few genomes is typically processed in under a minute, but GView does not place restrictions on the number of genomes that can be submitted for an analysis, and large numbers of genomes can sometimes require many hours of processing time. The GView Server can e-mail users when their large jobs are complete. Completed jobs are presented to the user as an HTML report with a snapshot of the maps in both circular and linear layouts. Users can download the data sets for execution in their stand-alone GView application, or they can use Java Web Start to download and launch GView and the data directly from the Web application. Most of the analysis results are also available as a separate downloadable spreadsheet file.
Genome comparison analyses supported by the GView server
| GView analysis | Description |
|---|---|
| BLAST Atlasa | Displays the regions of similarity between a reference genome and one or more query genomes |
| Core Genomea | Displays only the regions of similarity shared among all genomes (reference plus query genomes) |
| Accessory Genomea | Displays regions found within the reference and query files, but absent from the core genome |
| Unique Genomea | Displays regions unique to the reference genome, i.e. displays only the regions in the reference genome that are not found any of the query genomes |
| Signature Genesa | Displays genes that are unique to a user-defined inclusion genome group (including the reference genome) in comparison with the user-defined exclusion genome group |
| Pan-genomea | Displays the full genomic content of a group of genomes. Regions absent from the reference genome but present in any of the other genomes are grouped and appended to the end of the reference sequence, with no attempt to preserve synteny |
| Reciprocal BLASTb | Displays possible orthologous regions between two genomes |
| Custom Analysisc | Performs logical operations on a set of BLAST results between a two or more genome sequences and displays the results |
Note:aSimilarity is assessed by all-against-all BLAST alignments between the supplied genome sequences.
Similarity is assessed by all-against-all BLAST alignments between the two genomes. Orthologs are identified as gene or protein pairs where each member of the pair is the other member’s top BLAST hit.
Details are provided in the GView Server documentation.
Conclusions and future directions
CGView can be used to generate visually impressive graphical maps of bacterial genomes. CGView’s custom XML format, command-line interface, API and zooming ability have led to its incorporation into a variety of other programs created by us and by others. For example, the CCT package, which can be used to generate massive maps comparing thousands of genomes, relies on CGView for map drawing. The newer GView program offers similar features to CGView along with support for linear maps and interactive editing. The companion servers (CGView Server and GView Server) provide the simplest means to access the functionalities of CGView and GView, respectively, and include additional analysis tools. The GView Server in particular provides several helpful analysis pipelines for comparative genomics.
The democratization of high-throughput sequencing has resulted in the generation of genome databases of staggering size. Bioinformaticians have had to rethink the way they design their software using ‘big data’ approaches, where the software now must be able to operate on remote centralized data sets using modern APIs and Web technologies. New advances in Web-based visualization technologies, such as the D3 JavaScript library and HTML 5 Canvas are creating exciting new opportunities for genome visualization systems that can operate on remote data while providing the interactivity historically available in stand-alone systems. The nature of the analyses is also beginning to change, for example the existence of large data sets of closely related bacterial genomes is making possible the identification of subtle differences among genomes, and the correlation of these differences with biological traits [15]. This new analysis will influence the way that we view and interact with microbial genomic sequence data. We are currently prototyping the third generation of our circular genome map viewer technology using cloud computing and Web-based visualization technologies. However, there is still much work to be done in the area of API development, better support for high-throughput sequence data and innovative new ways to explore and visualize the ever-growing repositories of genomic sequence data. Although the challenges are significant, so is the reward; we are excited to be in a position to continue to develop the advanced technologies that will facilitate the next generation of microbial genome visualization and analysis.
CGView is a command-line Java program for generating high-quality, navigable maps of circular genomes.
The newer GView program offers similar features to CGView along with support for linear maps and interactive editing.
The companion servers (CGView Server and GView Server) provide the simplest means to access the functionalities of CGView and GView, respectively.
The GView Server includes several helpful analysis pipelines for comparative genomics.
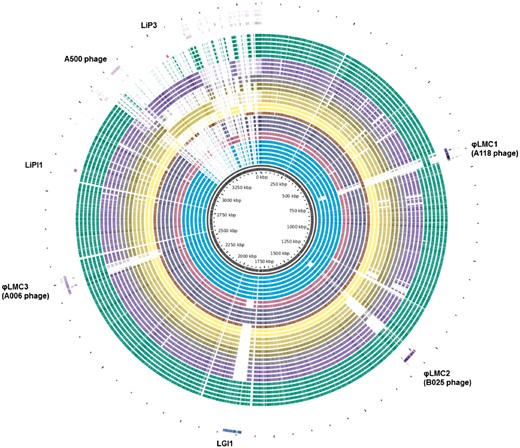
A pan-genome map of 40 Listeria monocytogenes genomes isolated from foodborne disease outbreaks in Canada from 1980 to present, generated with the GView Server. The locations of several pathogenicity-associated mobile elements (phage and genomic islands) are highlighted.
Paul Stothard, PhD (University of Alberta, 2002), is an Associate Professor in the Department of Agricultural, Food and Nutritional Science at the University of Alberta, Edmonton, Canada.
Jason Grant, PhD (University of British Columbia, 2006), is a Research Associate in the Department of Agricultural, Food and Nutritional Science at the University of Alberta, Edmonton, Canada.
Gary Van Domselaar, PhD (University of Alberta, 2003), is the Chief of the Bioinformatics Laboratory at the National Microbiology Laboratory and Adjunct Professor in the Department of Medical Microbiology at the University of Manitoba, Winnipeg, Canada.
