


Abstract
Aims: We investigated the population-level relationship between exposure to brand-specific advertising and brand-specific alcohol use among US youth.
Methods: We conducted an internet survey of a national sample of 1031 youth, ages 13–20, who had consumed alcohol in the past 30 days. We ascertained all of the alcohol brands respondents consumed in the past 30 days, as well as which of 20 popular television shows they had viewed during that time period. Using a negative binomial regression model, we examined the relationship between aggregated brand-specific exposure to alcohol advertising on the 20 television shows [ad stock, measured in gross rating points (GRPs)] and youth brand-consumption prevalence, while controlling for the average price and overall market share of each brand.
Results: Brands with advertising exposure on the 20 television shows had a consumption prevalence about four times higher than brands not advertising on those shows. Brand-level advertising elasticity of demand varied by exposure level, with higher elasticity in the lower exposure range. The estimated advertising elasticity of 0.63 in the lower exposure range indicates that for each 1% increase in advertising exposure, a brand's youth consumption prevalence increases by 0.63%.
Conclusions: At the population level, underage youths' exposure to brand-specific advertising was a significant predictor of the consumption prevalence of that brand, independent of each brand's price and overall market share. The non-linearity of the observed relationship suggests that youth advertising exposure may need to be lowered substantially in order to decrease consumption of the most heavily advertised brands.
INTRODUCTION
Prior research has identified several risk factors associated with youth alcohol use, including peer drinking (Ali and Dwyer, 2010; Mundt, 2011), parent drinking (Bahr et al., 2005; Barnes et al., 2006), personality factors such as sensation-seeking and deviance (Zuckerman et al., 1972) and environmental factors such as alcohol outlet density and various alcohol control policies (Naimi et al., 2014). Independent of these risk factors, exposure to alcohol advertising has been shown to be associated with the initiation of drinking, increased frequency of drinking and negative alcohol-related health consequences (Anderson et al., 2009; Smith and Foxcroft, 2009; Grenard et al., 2013).
Like most products, alcohol is promoted and purchased for consumption by specific brand. According to Saffer (2002), companies try to cultivate product ‘personalities’ that will appeal to specific target audiences by generating ‘brand capital’—that is, a set of positive images, emotions and expectancies that come to be associated with each brand. In turn, Saffer states, successfully building brand capital translates directly into increased market share. This perspective suggests that if advertising does influence youth drinking behavior, then not only would youth who are more heavily exposed to advertising be more likely to consume alcohol, they also should be more likely to drink the specific alcohol brands to whose advertising they are most exposed.
Even though the branding of commercial products plays a key role in consumer decision-making (Moschis and Moore, 1979; Aaker, 1996; Hanby, 1999; Evans and Hastings, 2008; Gordon et al., 2008), most of the existing literature on alcohol advertising and drinking has not taken into consideration the specific brands being advertised and consumed, Econometric studies examining the population-level association between total advertising exposure and total alcohol consumption have found mixed results (Nelson and Moran, 1995; Saffer, 1996, 2002; Nelson, 2005). A more recent study found an association between total advertising spending in each of 24 US television media markets and both the number of alcohol ads that study participants recalled seeing and the total volume of alcohol consumed in those markets (Snyder et al., 2006). Importantly, this effect persisted when the sample was restricted only to participants younger than 21, the minimum legal drinking age. Neither this study nor the previous econometric studies examined drinking at the brand level.
The evidence linking advertising and underage alcohol use would be greatly strengthened if it were shown that youth are in fact more likely to drink the specific brands to whose advertisements they have been exposed. Such a finding would have important implications for public policy. Recall that the youth-oriented ‘Joe Camel’ advertising campaign was found to be associated with a dramatic increase in Camel's market share among young smokers (DiFranza et al., 1991). This finding solidified the causal link between brand-specific cigarette advertising and brand-specific youth smoking, and, in combination with other studies, led policy makers to impose extensive regulations on cigarette advertising, including restrictions on the placement of advertisements in media or venues with high youth audiences (Family Smoking Prevention and Tobacco Control Act, 2009).
In contrast with the intensive federal regulation of cigarette advertising, there are virtually no federal restrictions on the placement of alcohol advertising. Although the Federal Trade Commission has jurisdiction over alcohol advertising, it has taken few steps to reduce youth exposure beyond periodically reviewing and encouraging alcohol industry self-regulation. Its actions have otherwise focused on misleading claims made for specific alcoholic beverages. A possible reason for this contrast is that the body of evidence linking cigarette advertising and youth smoking is substantially stronger than that tying alcohol advertising to youth drinking. In particular, there is substantial brand-level research linking the consumption of specific cigarette brands with brand-specific advertising exposure, but a virtual absence of such research in the alcohol field.
Recently, we advanced the field of alcohol research by identifying the prevalence of past 30-day consumption of 898 alcohol brands among a large, national sample of underage drinkers (Siegel et al., 2013). With this information, we can examine—for the first time—the degree to which brand-specific prices, adult brand use and brand-specific advertising exposure predict brand-specific consumption among underage youth. In an initial paper, we found that an individual's total exposure to brand-specific alcohol advertising—determined by the specific ads known to have aired during any of 20 popular television shows they had reported watching during a defined time period—predicted the likelihood of that individual consuming the advertised brand (Ross et al., 2014). Specifically, individual youth exposed to ads for a particular brand were approximately three times more likely to consume that brand.
From the standpoint of informing policy, this first study has an important limitation—namely, it was conducted at the individual level and therefore cannot tell us, at a population level, by how much youth consumption of a particular brand would change in response to changes in overall advertising levels for that brand, a concept known as brand-level advertising elasticity of demand (Sethuraman et al., 2011). Establishing the brand-level advertising elasticity of demand would enable policy makers to better judge how restrictive advertising regulations would need to be to lower overall youth drinking to a desired level because they would understand how much of an impact advertising has on alcohol consumption across the observed range of levels of advertising exposure. While the individual-level analysis allowed us to conclude that higher exposure to brand-specific alcohol advertising increases the likelihood that a youth will drink a particular brand, it does not allow us to estimate the magnitude of the effect that advertising has on youth consumption of alcohol at the population-level. This is the primary objective of the brand-level analysis in this paper.
Determining the brand-specific elasticity of demand would also provide even deeper insights into the influence of brand-specific advertising on youth alcohol use. Consider that, when looking at specific cigarette brands, Pollay et al. (1996) determined that the brand-level advertising elasticity of demand was three times higher for youth than for adults. This information provided what the authors called ‘the last straw’ in clinching the link between cigarette advertising and youth smoking.
In the present study, we again turned to our national survey of 1031 underage drinkers. Here, after examining and the controlling for the influence of brand-specific prices and overall brand market shares, we conducted a brand-level analysis to examine the degree to which a brand's youth consumption prevalence at a population level is associated with the aggregate advertising exposure it achieved among the underage youth population.
METHODS
Youth sample
The Youth Alcohol Brand Survey's methodology is detailed elsewhere (Knowledge Networks, 2012; Siegel et al., 2013). The sample, which was recruited from a national panel maintained by Knowledge Networks (Palo Alto, CA, USA) (Knowledge Networks, 2012), consisted of 1031 youth, ages 13–20, who had consumed at least one drink of alcohol in the past 30 days. The internet-based surveys were carried out between December 2011 and May 2012.
Briefly, Knowledge Networks maintains a probability-based panel of adults who were recruited based on both random-digit-dial and address-based sampling. The 18- to 20-year-old panelists were sent an email invitation to participate in the survey. Older adult panelists were asked whether they had children ages 13–17. With parental consent, Knowledge Networks invited these younger children to participate.
Participants who agreed to complete the survey were emailed a secure link to a screening questionnaire to determine if they had consumed alcohol in the past 30 days and were thus eligible for the survey. A $25 incentive was offered to enhance participation. For the 13–17 year-old sample, the overall response rate was 44.4%. For the 18–20 year-old sample, the overall response rate was 43.4%.
The protocol for the study was approved by the Boston University Medical Center's Institutional Review Board.
Weighting procedures
Knowledge Networks weighted the data to account for selection probability, non-response to panel recruitment and panel attrition (Knowledge Networks, 2012). Based on demographic distributions from the Current Population Survey (CPS) conducted by the US Bureau of the Census, the company also applied post-stratification adjustments for gender, age, race/ethnicity, census region, household income, home ownership status, metropolitan area and household size.
Advertising exposure by brand
Respondents were asked which of the 20 television shows they had viewed in the past 30 days in order to estimate their potential exposure to brand-specific alcohol advertising. These shows, being popular with youth, had been determined by Nielsen (New York, NY, USA) to rank in the top 20 for exposing underage youth (ages 12–20) to alcohol advertising during 2009 and 2010 (Nielsen, 2011–2012).
The effects of advertising have been shown to vary over time, with past advertisements being less influential than current advertisements (Broadbent, 2000). To account for this, the advertising industry uses a measure of cumulative advertising exposure called adstock which is calculated by summing current advertising exposure levels with depreciated levels of prior exposure (Broadbent, 2000). The rate of advertising depreciation for most consumer products has been estimated; Broadbent reported a half-life of 3–4 weeks, or approximately one month (Broadbent, 1997).
Advertising exposure is typically measured by gross rating points (GRPs), which represent the total number of ad exposures per target audience population during a given time period. For example, 100 GRPs represents one ad exposure for every member of the population. This does not necessarily mean that every member of the population was exposed; it may be, for example, that 50% of the population viewed two ads. Based on the television shows that each respondent reported watching during the past 30 days, we added the GRPs reported by Nielsen (licensed for 2011–2012) for each brand on each show, beginning with the month that the respondent completed the survey and proceeding back in time 12 months. These values had already been obtained from Nielsen for use in another study (Ross et al., 2014). Exposures for previous months were discounted based on a one month half-life. Cumulative GRPs were then summed across all of the television shows to derive brand-specific adstock values for each individual respondent. Finally, we summed each brand's adstock values across all of the respondents to generate the total adstock of advertising exposure for each advertised alcohol brand among the entire sample.
Brands included in analysis
The data analysis included all alcohol brands (N = 123) that were advertised nationally during the period January 2011 through May 2012 on any of the 20 television shows. Sixty-one brands were advertised on one or more of the 20 selected television shows, and 62 were not.
Outcome measures
The main outcome was the prevalence of past 30-day consumption for each alcohol brand among the 1,031 underage drinkers who completed the survey. In this internet survey, the respondents indicated which of 898 brands, grouped into 16 alcohol beverage types, they had consumed in the past 30 days. We calculated the total consumption prevalence for each brand as the percentage of respondents who reported consuming any quantity of that brand in the past 30 days. The validity of this survey methodology has been demonstrated in a previous study (Siegel et al., 2011). The reliability and validity of self-reported alcohol consumption by adolescents is well established (Smith et al., 1995; Williams et al., 1995; Lintonen et al., 2004).
Main predictor variable
The main predictor of interest was overall population exposure to each brand's advertising on the 20 television shows, measured as the total adstock for each of the 123 brands. The relationship between advertising and consumption has been shown to be non-linear. Effects tend to saturate, with a lower magnitude of marginal effects at higher levels of exposure (Ackoff and Emshoff, 1975; Saffer, 2002; Wind and Sharp, 2009). For that reason, we log-transformed (using the natural log) the adstock variable. Because of the non-linear relationship between advertising and consumption, running a single model in which the adstock variable is entered is not appropriate since it assumes a linear relationship. Instead, we estimated the relationship between advertising exposure and brand-consumption prevalence separately for three different ranges of exposure, which were determined by dividing the adstock variable into quartiles.
Covariates
We controlled for several potential confounding variables. We controlled for brand-specific price by using a systematic internet pricing protocol to ascertain the average price per ounce of ethanol for each alcohol brand. We controlled for overall brand-specific market share (including adult drinkers) by using Impact Databank's (M. Shanken Communications, New York, NY) estimates of annual wholesale shipments for each alcohol brand in 2010 (Impact Databank, 2011a,b,c).
Data analysis
Our data consisted of 123 brand-specific records, each with a value for: (a) that brand's 30-day consumption prevalence among the youth sample; (b) the total adstock for that brand among the sample; (c) the average price per ounce of ethanol for that brand; and (d) the overall market share for that brand.
The main outcome variable—brand-consumption prevalence—was not normally distributed: there were many brands with zero or very low consumption prevalence and a rapidly decreasing number of brands as the level of consumption prevalence increased. Accordingly, we modeled consumption prevalence as a negative binomial function, consistent with other studies that examined factors related to alcohol consumption (Kerr et al., 2009; Harkonen and Makela, 2011; Pedersen et al., 2013; Pereira et al., 2013; Meng et al., 2014). Using the negative binomial model, we examined the relationship between brand-specific advertising exposure and brand-specific consumption, while controlling for brand-specific prices and overall brand market share. To estimate brand-level advertising elasticity of demand, we used the model to calculate the percentage change in brand-specific youth consumption prevalence associated with a 1% increase in youth exposure to brand-specific advertising.
RESULTS
In a bivariate analysis, there was a consistent relationship between increasing advertising exposure and brand-specific consumption prevalence (Table 1). The mean brand-consumption prevalence increased from 0.83% for brands with no advertising exposure to 3.21% for brands with between 1 and 520 GRPs of adstock, to 4.36% for brands with between 521 and 1799 GRPs of adstock and to 6.05% for brands with 1800 or more GRPs of adstock.
Average prevalence of youth alcohol brand consumption by quartiles of brand-specific advertising exposure and correlation between exposure and consumption prevalence
| Exposure group (GRPs) | Median exposure for group (GRPs) | Log of median exposure (log GRPs) | Mean brand-consumption prevalence (%) |
|---|---|---|---|
| 0 | 0 | 0 | 0.83 |
| 1–520 | 277 | 5.43 | 3.21 |
| 521–1799 | 956 | 6.86 | 4.36 |
| 1800+ | 3768 | 8.23 | 6.05 |
| Exposure group (GRPs) | Median exposure for group (GRPs) | Log of median exposure (log GRPs) | Mean brand-consumption prevalence (%) |
|---|---|---|---|
| 0 | 0 | 0 | 0.83 |
| 1–520 | 277 | 5.43 | 3.21 |
| 521–1799 | 956 | 6.86 | 4.36 |
| 1800+ | 3768 | 8.23 | 6.05 |
Correlation between exposure (log GRPs) and consumption prevalence = 0.49 (P < 0.0001).
After controlling for brand price and overall market share, there remained a strong relationship between a brand's consumption prevalence and whether or not it advertised on the 20 television shows (Table 2). Brands with advertising exposure on these shows had a consumption prevalence that was approximately four times higher than brands that did not advertise [incidence rate ratio (IRR) = 4.03; 95% confidence interval (CI) = 2.65–6.13]. In this analysis, brand price and overall market share were also significant predictors of youth consumption prevalence. For each $1.00 increase in average price per ounce of alcohol, a brand's youth consumption prevalence declined by a factor of 0.77, and for each one percentage point increase in a brand's overall market share, its youth consumption prevalence increased by a factor of 1.39.
Incidence rate ratio (IRR) for brand-specific youth alcohol consumption prevalence by brand-specific advertising exposure (dichotomous), average brand price and overall brand market sharea
| Variable | IRR | 95% confidence interval | P-value |
|---|---|---|---|
| Advertising exposure (any vs. none) | 4.03 | 2.65, 6.13 | <0.0001 |
| Average brand price | 0.77b | 0.61, 0.96 | 0.02 |
| Overall brand market share | 1.39c | 1.15, 1.67 | 0.0007 |
| Variable | IRR | 95% confidence interval | P-value |
|---|---|---|---|
| Advertising exposure (any vs. none) | 4.03 | 2.65, 6.13 | <0.0001 |
| Average brand price | 0.77b | 0.61, 0.96 | 0.02 |
| Overall brand market share | 1.39c | 1.15, 1.67 | 0.0007 |
aBased on a negative binomial regression with brand-specific youth alcohol consumption prevalence as the outcome variable and advertising exposure as a dichotomous predictor variable. Other predictors are the brand′s average price per ounce of alcohol and its estimated overall market share, including both youth and adult consumers, based on 2010 estimates of annual wholesale shipments for each alcohol brand.
bIndicates that the youth consumption prevalence decreases by a factor of 0.77 for each one dollar increase in the average price per ounce of ethanol for that brand.
cIndicates that the youth consumption prevalence increases by a factor of 1.39 for each one percentage point increase in the overall market share for that brand.
Figure 1 shows a loess curve of the crude association between brand-specific alcohol advertising exposure and brand-specific consumption among underage drinkers. The curve approximates a log curve with diminishing effects at higher levels of exposure, similar to what has been reported in other advertising research studies (Ackoff and Emshoff, 1975; Saffer, 2002; Wind and Sharp, 2009). Table 3 shows a similar pattern for the model adjusted for brand pricing and market share. Over the adstock range from 0 to 277 GRPs, which represents the change from the first to the second quartile of exposure, brand-consumption prevalence increased by a factor of 2.92 (95% CI = 2.11–4.04). From 277 to 956 GRPs, consumption prevalence increased by a factor of 1.27 (95% CI = 1.18–1.36), with similar results over the range from 956 to 3,768 GRPs. This non-linear relationship is consistent with advertising research which demonstrates a saturation effect at higher levels of advertising exposure (Ackoff and Emshoff, 1975; Saffer, 2002; Wind and Sharp, 2009).
Incidence rate ratio (IRR) for brand-specific youth alcohol consumption prevalence and brand-level advertising elasticity of demand by brand-specific advertising exposure, average brand price and overall brand market sharea
| Change in exposure (Adstock) | IRR | 95% confidence interval | P-value | Brand-level advertising elasticity of demandb |
|---|---|---|---|---|
| 0–277 | 2.92 | 2.11, 4.04 | <0.0001 | 0.63 |
| 277–956 | 1.27 | 1.18, 1.36 | <0.0001 | 0.14 |
| 956–3768 | 1.30 | 1.20, 1.41 | <0.0001 | 0.15 |
| Average brand price | 0.78c | 0.63, 0.98 | 0.03 | |
| Overall brand market share | 1.36d | 1.12, 1.64 | 0.0018 |
aBased on a negative binomial regression with brand-specific youth alcohol consumption prevalence as the outcome variable and log advertising exposure as a continuous predictor variable. Other predictors are the brand′s average price per ounce of alcohol and its estimated overall market share, including both youth and adult consumers, based on 2010 estimates of annual wholesale shipments for each alcohol brand.
bAdvertising elasticity of demand is the percentage increase in consumption prevalence associated with a 1% increase in exposure. An elasticity of 0.63 indicates that for each 1% increase in exposure, consumption prevalence increases by 0.63%.
cIndicates that the youth consumption prevalence decreases by a factor of 0.78 for each one dollar increase in the average price per ounce of ethanol for that brand.
dIndicates that the youth consumption prevalence increases by a factor of 1.36 for each one percentage point increase in the overall market share for that brand.
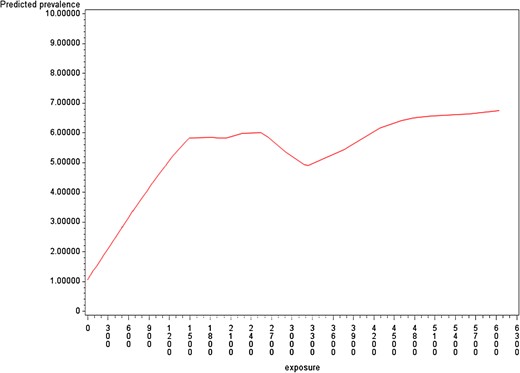
Loess curve of association between brand-specific advertising exposure (adstock) and prevalence of brand consumption among underage drinkers ages 13–20. This figure shows the relationship between brand-specific advertising exposure (adstock) and the prevalence of youth alcohol brand consumption over the range of advertising exposure revealed through the survey. Adstock units represent a measure of cumulative exposure in the month a youth participant completed the survey and the preceding months, with an advertising half-life of one month. The loess curve uses a smoothing function to visually demonstrate the relationship between the two variables.
Because of the non-linear relationship between advertising exposure and consumption prevalence, we estimated the advertising elasticity separately within each exposure range. Our estimates for the brand-level advertising elasticity of demand were 0.63 over the adstock range from 0 to 277 GRPs, 0.14 for the range from 277 to 956 GRPs and 0.15 for the range from 956 to 3768 GRPs (Table 3).
DISCUSSION
We examined the cross-sectional association between the population-level exposure of underage drinkers to alcohol brand advertising on 20 television shows popular among youth and the population-level consumption prevalence of these same brands. We found that, after controlling for a brand's average price and overall market share, the prevalence of brand consumption among these youth was significantly associated with the brands' level of advertising exposure. Brands that advertised on these 20 television shows were four times more likely to be consumed by underage youth than brands that did not. Lower levels of exposure to brand advertising produced the greatest increase in brand-consumption prevalence among underage youth, with diminishing effects at higher levels of exposure.
Our results suggest that the brand-level advertising elasticity of demand for alcohol varies by exposure level, with higher elasticity in the lower exposure range. For adstock between 0 and 277 GRPs, estimated advertising elasticity was 0.63, meaning that for each 1% increase in advertising exposure, a brand's youth consumption prevalence increases by 0.63%. At higher levels of exposure, advertising elasticity dropped to 0.15.
Since we are aware of no previous studies of advertising elasticity at the brand level, we cannot compare our results with those from other studies. However, a meta-analysis of alcohol industry-level estimates of advertising elasticity of demand reported a mean value of only 0.08 (Gallet, 2007). There are two major reasons why our estimates are higher. First, prior estimates are based advertising expenditures, not actual advertising exposure. There may not be a one-to-one relationship between changes in advertising expenditures and changes in actual advertising exposure. Second, given the wide divergence of brand popularity, brand-level advertising elasticity would be expected to be considerably higher than industry-wide advertising elasticity (Png and Lehman, 2007).
A prior research study that examined per capita advertising spending in 24 US media markets discovered that for every additional dollar per capita spent on advertising, the number of alcoholic beverages consumed by adolescents and young adults increased by three percent (Snyder et al., 2006). Note that this study did not examine the association at the brand level and assumed a linear relationship between advertising and consumption. Since per capita advertising spending levels across television markets may be relatively similar, there may have been insufficient variation in their predictor variable to reveal non-linear effects at lower levels of spending. The current study, by examining advertising across brands with very different advertising levels, was able to assess exposures at many different levels, thereby revealing the non-linear form of the response function.
This study further adds to the existing literature on alcohol advertising and youth drinking by demonstrating, at the population level, that higher levels of brand-specific youth advertising exposure are associated with greater brand-specific consumption prevalence, and by providing the first estimates of the magnitude of change in youth consumption prevalence that is associated with changes in advertising exposure. Our findings suggest that for alcohol brands with very high advertising exposure, substantial declines in exposure will be necessary to significantly reduce youth consumption of those brands. On the other hand, it appears that for brands with lower levels of advertising exposure, relatively small reductions in advertising exposure could potentially produce quite significant reductions in youth consumption. Our findings also strengthen the conceptual basis for identifying an effect of alcohol advertising on youth drinking behavior by providing empirical support for Saffer's theory of brand capital (Saffer, 2002). Our results support this theory by suggesting that youth are more likely to drink the specific alcohol brands to whose advertising they are most exposed. For all of these reasons, these results add to the growing body of evidence linking alcohol advertising with youth drinking behavior and suggest that stronger intervention to limit youth exposure to alcohol advertising may be warranted.
This study has several important limitations. First, our estimates of brand-specific advertising exposure are based only on each brand's level of advertising on 20 specific television shows, which represents only a portion of potential alcohol brand exposure. It is possible that the participants received brand-specific alcohol exposure on other television programs, and that this additional exposure might not be congruent with their reported brand consumption. Additional research may be required to verify these findings using a more comprehensive assessment of brand advertising exposure, preferably in a longitudinal study.
Second, this study is cross-sectional and therefore the causal direction of the association could not be assessed. It is theoreticaly possible that the respondents' consumption of specific brands preceded their exposure to advertising to those brands. However, since we assessed exposure using a list of 20 television programs, a reverse-causation explanation would require that the study participants knew which alcohol brands were going to be advertised on certain television programs and then choose to watch those programs because they were drinking those brands. This seems unlikely, but cannot be definitively ruled out.
Third, while we controlled for the price of each alcohol brand and its overall market-share, there may be other uncontrolled confounders that could have affected our results. For example, if youth were drinking certain brands because of specific flavoring or taste, but those brands also happened to be more frequently advertised on the selected shows, then this would make it difficult to separate the effect of flavoring or taste from the effect of the level of advertising exposure. Further research, preferably longitudinal, should be conducted to attempt to account for this and other potential confounders.
Fourth, because of their underage status, some respondents may have limited options with regards to the brands available to them. For example, they may drink at a party where the brand is chosen for them. Nevertheless, we have demonstrated that youth brand preferences are not significantly different between youth based on whether or not they have autonomy in their brand choices (Roberts et al., 2014).
Finally, we did not have information on the respondents' exposure to anti-alcohol advertising, which could potentially mitigate the negative impact of alcohol advertising exposure. However, youth exposure to alcohol industry ‘responsible drinking’ ads and ads to discourage drinking and driving has been shown to be miniscule compared with alcohol product advertising exposure (Center on Alcohol Marketing and Youth [CAMY], 2007). For example, from 2001 to 2005, youth were 239 times more likely to see an alcohol ad than a responsible drinking ad and 32 times more likely to see an alcohol ad than an ad discouraging drinking and driving (CAMY, 2007).
Despite these limitations, our findings clearly demonstrate that, after controlling for a brand's price and overall market share, advertising exposure for that brand among underage youth is strongly associated with the brand's consumption prevalence among underage drinkers. By statistically controlling for brand price and overall market share, our analysis bolsters the findings from earlier studies that youth exposure to alcohol-branded advertising influences youth alcohol consumption. In response, new steps may need to be taken to reduce the likelihood of youth exposure to advertising.
FUNDING
This work was supported by the National Institutes of Health, National Institute on Alcohol Abuse and Alcoholism (grant number R01 AA020309). Craig Ross's participation in this study was funded in part by the Boston University Reproductive Perinatal and Pediatric Epidemiology training program (NIH T32 HD052458).
CONFLICT OF INTEREST STATEMENT
None declared.
