


Abstract
Aims: This study aimed to analyse if changes in drinking in Sweden have been similar in different population subgroups between 2004 and 2011, a period when per capita consumption declined significantly. Method: The analysis starts out from monthly alcohol survey data including 1500 telephone interviews every month. The population is divided into 20 equally large consumption groups separately for men and women and two broad age groups. Both absolute and relative changes in drinking are studied. Results: Most findings confirmed a collectivity of change in drinking: a decline was found at all consumption levels overall, among men and women, and among those under 50 years of age. The decline was smaller in groups with the highest consumption, and among those over 50 years consumption rather increased among the heaviest drinkers. Conclusion: Support was obtained for the conception of a social component in recent consumption changes in Sweden. This finding has an important policy message in line with the total consumption model, namely that measures that reduce per capita consumption are likely to imply fewer heavy drinkers. Some exceptions from the collectivity theory that deserves attention in future studies were also noted, e.g. the development among heavier drinkers above 50 years of age.
INTRODUCTION
After many years of increasing per capita consumption of alcohol in Sweden, a decline has been observed between 2004 and 2009 (Leifman and Ramstedt, 2009), and this decline has then continued during 2010 and 2011. In this paper, we examine this decline in more detail with a focus on the extent to which the decline is observed in different segments of the Swedish population. Our analysis is based on a large, repeated, cross-sectional survey; as a theoretical starting point we use Skog's theory of collectivity of drinking cultures (hereafter referred to as collectivity theory) and then analyse more specifically how well the theory predicts the Swedish development.
Collectivity theory has been very influential in alcohol epidemiology, not the least by offering a social explanation for the observed regularities in the distribution of alcohol consumption in a population (Skog, 1985). The theory starts out from the idea that drinking behaviour is essentially a social phenomenon and that social interaction causes collective changes in population drinking. In other words, people are considered to be highly influenced by their peers when it comes to consuming alcohol. External factors such as changes in alcohol prices or economic changes in society may also affect most groups and thus produce a collective change. As a result, a change in per capita consumption is expected to include roughly similar changes at all levels of drinking from lower to heavier drinking groups.
Collectivity theory also offers an explanation for the statistical association between per capita consumption and harm rates revealed in numerous studies, e.g. alcohol-related mortality (Norström and Ramstedt, 2005). In contrast to the idea that heavy drinkers influence per capita consumption (e.g. Gmel and Rehm, 2000), the theory proposes social interaction and subsequent collectivity as the major explanation for these research findings.
It should however be stressed that exceptions from this general idea of collectivity have been noted in several studies. A classic example is the experience of abolishing the rationing system in Sweden when it appeared that heavy drinkers increased their consumption more than other groups with lower drinking levels (Norstrom, 1987). Furthermore, differential changes in consumption across population subgroups have been found in relation to dramatic changes in the availability of alcohol or when there has been a divergence (Caetano et al., 1983) or convergence in income between population subgroups (Norström and Romelsjo, 1998). There is also some evidence of regional differences in consumption changes, e.g. that the north of Sweden had a different pattern of consumption development from the south of Sweden when the import quotas were raised in 2004 (Gustafsson, 2010). Some studies have also suggested that developments among the most severely dependent drinkers are not related to developments in lower consumption strata (Skog and Duckert, 1993).
Whether lower drinking overall implies lower drinking in all (or in most) different consumption levels in the population is also a question of significant policy relevance. If such conformity exists, it would represent further support for the usefulness of lowering per capita consumption—the main idea behind the so-called total consumption model, which has been questioned in Sweden during recent years since the increase in consumption has not been followed by the expected increase in problem rates (Andreasson et al., 2006). Discrepancies between trends in per capita consumption and levels of harm have also been noted in Australia (Livingston et al., 2010) and in the UK (Meier, 2010). Another issue that has been raised is that modern societies have become less homogeneous and that the collectivity in drinking thus may have become weaker than previously. In other words, we should not expect that per capita consumption changes are as collective in modern societies as suggested in earlier research. Furthermore, a recent study of adolescents from the Stockholm city area in Sweden has demonstrated a polarization in drinking between 2000 and 2010: consumption has decreased among the large majority, while the group of heaviest drinkers (approximately top 5%) have increased their consumption (Hallgren et al., 2012).
Overall, analyses of consumption trends in different segments of the population during a period when per capita consumption declines help to obtain more insight into these questions. The main purpose of the paper is to examine the extent to which the decline in per capita consumption in Sweden from 2004 to 2011 corresponds to a decline in drinking at different levels of consumption and in different demographic segments of the Swedish population.
DATA AND METHOD
Data on alcohol consumption were retrieved from a database collected within the so-called Monitoring Project (Ramstedt et al., 2010a). The major source of the data in this project is a running, monthly, telephone survey with 1500 adult Swedes including questions about both self-reported drinking habits and purchases of unrecorded alcohol (e.g. travellers' imports and smuggling). A nationally representative sample of the Swedish general population aged 16–80 years is randomly drawn every month. An organization (Ipsos) specialized in performing telephone surveys is contracted to perform the interviews and sampling. The sampling procedure is performed in two stages: first, a sample is drawn from Swedish official registers, and then these are matched to find telephone numbers. Interviews are then conducted until 1500 respondents have been interviewed resulting in a repeated cross-sectional sample of 18,000 respondents each year. The same organization has performed the interviews during the study period. Some cases were excluded from the analyses due to missing values on the consumption questions (see Table 1 for the total number of respondents each year). Since relatively large, repeated, cross-sectional data were analysed, the same individual could theoretically be interviewed more than once. However, given that 18,000 out of ∼7 million people in the age group 16–80 years are interviewed each year, this likelihood is very low.
Self-reported yearly per capita alcohol consumption in Sweden 2004–2011. Means in millilitres of 100% alcohol per year and standard deviations (SD) for the overall population and different subgroups separately
| Overall | Men | Women | Below 50 | Over 50 | |
|---|---|---|---|---|---|
| 2004 | 4441 (8367) (n=13 485) | 6230 (10 601) (n=6275) | 2668 (5115) (n=7210) | 5027 (9215) (n=7714) | 3591 (6983) (n=5771) |
| 2005 | 4286 (8193) (n=17 999) | 5903 (10 053) (n=8471) | 2686 (5594) (n=9528) | 4759 (9139) (n=10 043) | 3592 (6751) (n=7956) |
| 2006 | 4348 (8148) (n=17 972) | 6001 (10 208) (n=8428) | 2715 (5203) (n=9544) | 4749 (8979) (n=9683) | 3772 (7012) (n=8289) |
| 2007 | 4139 (7849) (n=17 940) | 5703 (9786) (n=8242) | 2593 (5211) (n=9698) | 4499 (9036) (n=9402) | 3618 (6245) (n=8538) |
| 2008 | 4211 (8791) (n=17 957) | 5743 (10 954) (n=8215) | 2695 (6005) (n=9742) | 4508 (10 020) (n=8996) | 3774 (7336) (n=8961) |
| 2009 | 3917 (8890) (n=17 973) | 5285 (11 147) (n=8233) | 2540 (6028) (n=9740) | 4060 (10 226) (n=8542) | 3720 (7470) (n=9431) |
| 2010 | 3814 (8385) (n=17 688) | 5115 (10 324) (n=8056) | 2507 (6006) (n=9632) | 4026 (10 007) (n=8215) | 3518 (6652) (n=9473) |
| 2011 | 3878 (8598) (n=17 600) | 5227 (10 437) (n=8035) | 2516 (6374) (n=9565) | 4023 (9932) (n=8504) | 3684 (7122) (n=9096) |
The consumption estimate of unrecorded alcohol is added to monthly figures on recorded sales to obtain monthly estimates of actual per capita alcohol consumption. In the present analysis with focus on drinking changes in different groups, we make use of the self-reported data that is based on the so-called quantity and frequency scale applied for the last 30 days. In accordance with recommendations in the literature (e.g. Feunekes et al., 1999) the questions are asked separately for each beverage type and answers are summarized into a measure of overall drinking during the last 30 days. This measure thus combines questions on how often spirits, wine, beer and cider have been consumed during the last 30 days and the typical amount consumed on one occasion. The frequency questions are formulated in the same way for all types of beverages, and are as follows: How often have you consumed beer/wine/fortified wine/spirits during the last 30 days? The response categories are a gradient with a range from ‘more or less every day’, ‘4–5 times a week’, ‘2–3 times a week’, ‘once a week’, ‘about 2–3 times’, ‘about once’ and ‘never’. The quantity questions’ response alternatives are specific for each beverage and are customized to the different standard containers in which the beverages are sold in (for a more detailed description of the methods in Swedish see Ramstedt et al. (2010a)). Neither the quantity nor frequency questions have been altered between 2004 and 2011. As the reference period is only 30 days, distorting memory effects are assumed to be relatively small, at least in comparison with scales using 6 or 12 months as reference periods (Stockwell et al., 2004). Although up to 30 contact attempts are made before the case is recorded as a non-response, the monthly non-response rates ranged between 40 and 60% during the study period, with a somewhat increasing rate. We come back to the possible implications of increasing non-response in the discussion of the results.
In the analysis of changes in different consumption groups between 2004 and 2011, the distribution of drinking in the population is compared in terms of 5% groups, which divide the population into 20 equally large groups from low to high consumption. The group means are compared both in terms of absolute changes in consumption—measured in millilitres of 100% alcohol consumed during the last 30 days—and in terms of relative changes. To obtain the relative measure, the natural logarithm of alcohol consumption is used. The Whitney–Mann test is used to assess if the group means are significantly different between 2004 and 2011. The demographic subgroups analysed are men compared with women and two wide age groups composed of those under 50 years of age and those over 50 years of age. Non-consumers are included in all analyses and the grouping of respondents was done before the logarithm of alcohol consumption was calculated.
RESULTS
Table 1 shows the development in alcohol consumption in Sweden between 2004 and 2011 according to self-reported alcohol consumption for the whole population and four different subgroups. Alcohol consumption has decreased overall as well as among men and those <50 years of age, while those over 50 years of age have instead increased their consumption. Women have marginally decreased their consumption during the same period.
We now continue by analysing the survey data in more detail to see if the decline in average consumption is reflected at different levels of consumption by comparing the distribution of drinking between 2011 and 2004. Table 2 shows the average consumption in different consumption groups each made out of 5% of the population. As shown, the decrease occurs in all consumption groups, i.e. the whole population has lowered its alcohol consumption. The decrease in consumption is gradual for each year, except in the top 10% where the consumption in the second highest group increased in 2011, after declining during the other years, and the consumption in the highest group is somewhat unstable. We also see that in 2011 there are 5% more that have not consumed alcohol at all during the last 30 days compared with 2004.
Average self-reported monthly consumption of millilitres of 100% alcohol in a selection of consumption (5%) groups. Overall population, 2004–2011
| 4 | 5 (1st quartile) | 7 | 9 | 10 (50%) | 15 (3rd quartile) | 18 (90%) | 19 | 20 | |
|---|---|---|---|---|---|---|---|---|---|
| 2004 | 0 | 6 | 53 | 113 | 149 | 433 | 786 | 1089 | 2241 |
| 2005 | 0 | 5 | 51 | 108 | 142 | 408 | 753 | 1039 | 2153 |
| 2007 | 0 | 3 | 47 | 102 | 134 | 405 | 727 | 1001 | 1975 |
| 2008 | 0 | 2 | 45 | 98 | 126 | 389 | 719 | 1004 | 2199 |
| 2010 | 0 | 0 | 38 | 89 | 112 | 353 | 666 | 918 | 1948 |
| 2011 | 0 | 0 | 31 | 80 | 106 | 353 | 677 | 951 | 2159 |
| Difference 2004 vs 2011 | 0 | −6*** | −22*** | −33*** | −43*** | −80*** | −109*** | −138*** | −82 |
***P < 0.001.
A further analysis of the results in Table 2 shows that the largest decrease in consumption has been among the groups that consume the most alcohol. However, the results also show that the decrease in consumption is greater in the lower than in the higher consumption groups in relation to their level of consumption.
A central assumption in Skog's theory of collectivity is that relative changes in consumption should be equal in the whole population (Skog, 1985). Figure 1 shows the relative changes in consumption in the same groups as in Table 2. As can be seen, consumption is lower in 2011 compared with 2004 in every consumption group including the 5% of drinkers having the highest consumption. The changes are gradual in all consumption groups, suggesting that there has been a collective shift of the whole distribution. However, although there is a significant decrease in all groups, the lower consumption groups have decreased their consumption more in relative terms than the higher consumption groups.
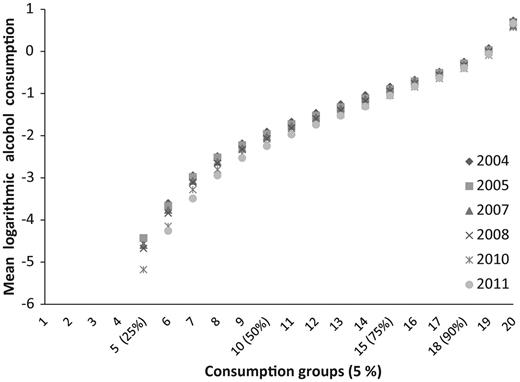
Mean consumption in different consumption groups for the overall population, 2004–2011.
The second approach to test the degree of collectivity in the decline in drinking in the Swedish population was to assess whether the changes over time have been the same in different demographic groups. Figure 2 shows the consumption trends for men and women with the same emerging pattern as for the whole population. The consumption among men has, however, decreased more than among women, and the changes are more apparent in all consumption groups among men. Further, the decrease among the lower consumption groups is more apparent among men, while among women the changes in the higher consumption groups are much less apparent. This suggests that, while the majority of the female population have lowered their consumption considerably, the groups of women with the highest levels of alcohol consumption still maintain a high consumption level. These results are in accord with the changes in absolute numbers shown in Table 1.
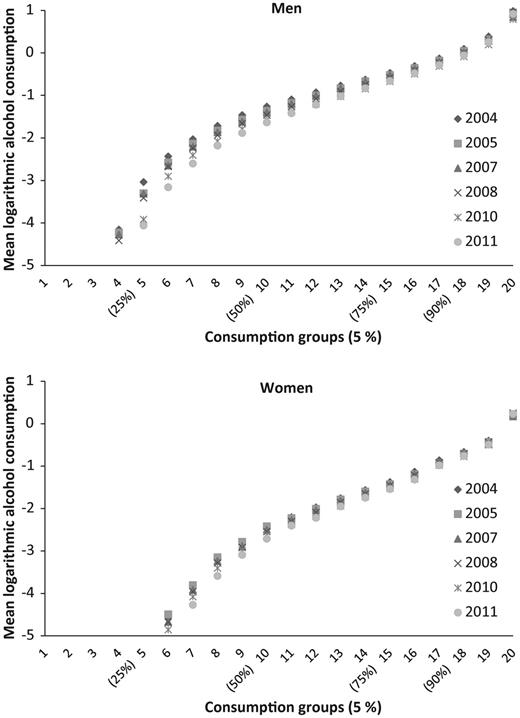
Mean consumption in different consumption groups for men and women, 2004–2011.
We also examined whether a similar consumption decline was found for different age groups. Although the age groups are rather broad, the data reveal some clear patterns. For those under 50 years of age, the same pattern is found as for the whole population, i.e. a significant decrease at all drinking levels; the decrease has been foremost in the lower consumption groups. Among those over 50 years of age, however, the pattern is different from that in the rest of the population; there is no decline at higher consumption levels, with even signs of an increase; see Fig. 3. Among drinkers at lower drinking levels there has been a much smaller decrease in consumption than among those under 50 years of age, and in the higher consumption groups the changes are not significant comparing 2004 with 2011. Thus, the elderly (+50 years of age) have not lowered their consumption during this period to the same extent as those <50 years of age and there is a group among the elderly that has even increased their consumption. The decline in consumption observed between 2004 and 2011 for the whole population is therefore the result of the decrease in consumption among those below 50 years of age.
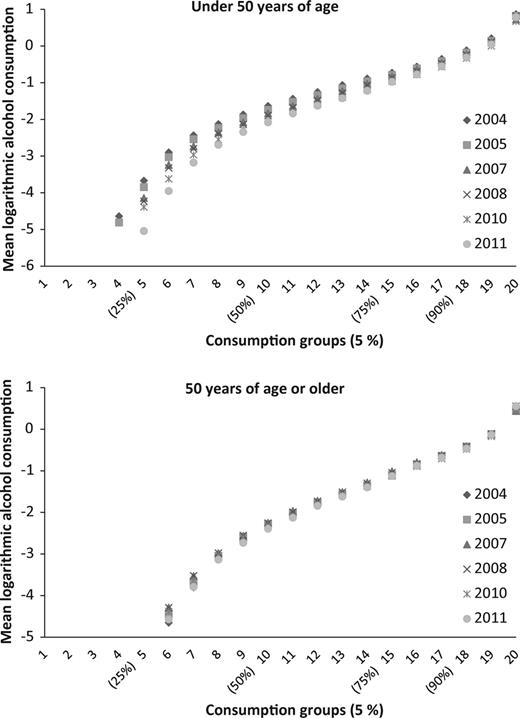
Mean consumption in different consumption groups for two age categories, 2004–2011.
The broad age groups used for the analyses could overlook important changes that would appear if smaller intervals were used for the age groups. Separate analyses were thus conducted where age groups 16–29, 30–49 and 50+ were used (data not shown). These showed the same basic patterns emerging as in the analyses presented in the paper, suggesting that the results are robust.
DISCUSSION
In the present paper, we addressed the question of whether the recently observed decline in per capita consumption in Sweden has been subject to a collective change in the sense that alcohol consumption at all drinking levels has declined and also whether the decline was seen across different demographic groups. Some of the results confirmed the idea of collectivity: a significant decline was found at most consumption levels overall and among men and women. These results support the idea that there is a strong social component in the Swedish drinking culture where, as described by Skog, ‘changes tend to spread like waves in the water’ (Skog, 2001) leading to a displacement of the whole distribution under normal circumstances. However, the results also raised some questions about the idea of collectivity: the higher consumption groups in all segments of the population have lowered their consumption less than the lower consumption groups. Among those over 50 years of age there has not been any significant decline in consumption among the heaviest drinkers and in the top 5% group there was even a small increase in consumption. The non-parametric test that is used is sensitive to a high n when testing for significant changes and, with such a large sample at hand, we found that even small changes in consumption turned out to be significant. This should be kept in mind when interpreting the results.
It is worth noting that there is some evidence from other data of a different pattern of consumption development in heavy drinking among older age groups in Sweden. For instance, alcohol-related mortality among women and among the elderly has increased in Sweden during the last 20 years, compared with among men and younger age groups (Ramstedt, 2010).
Room et al. (2009) describes the way alcohol culture and consumption are moving through society over time as long waves lasting over several generations and that changes occur slowly and gradually. This could help explain some of the diverging trends in alcohol consumption we observe between age groups in this study. We can speculate that one factor that contributed to a non-decline among older people is a cohort effect, i.e. that the drinking habits of the new generation of elderly are wetter than in previous generations (Ramstedt, 2009). Thus, in the complex process of factors pushing drinking up and down (Room et al., 2009) the cohort effect may have been important in pushing drinking up among the elderly. Sweden has an ageing population with cohorts (born in the 1940s and 1950s) now growing older with other wetter drinking habits when compared with earlier generations of cohorts (e.g. those born in the 1920s and 1930s). It has also been shown that both consumption and harm rates are increasing in this group (Ramstedt and Raninen, 2012). Further studies with an age–period–cohort design could render valuable information on the possible cohort effects on consumption. A study regarding alcohol-related mortality in Sweden made it evident that cohort effects have a significant impact (Rosen and Haglund, 2006).
Again following the arguments made by Room et al. (2009) with respect to the relatively small decline among women in the highest drinking levels, there may be changes in family structures and social roles that prevent heavy drinking from declining among some women and not among men. For instance, the increasing male participation in child-raising in Sweden may have pushed heavy drinking down among men, while at the same time allowing more time for drinking among women. However, more careful analyses are needed to address these issues in future studies. Future studies should also focus on the consumption development in different socio-economic subgroups of the population. It has been shown in other studies that in periods with changes in consumption different socio-economic groups can be affected in different ways (Norström and Romelsjo, 1998; Herttua et al., 2008). In Sweden the improvement in income in the general population for those over 50 years of age have been somewhat stronger than for other groups during this period, which could be seen as a possible explanation for the maintenance of high consumption levels in this group. Analyses of the crude estimates of income that are available in the survey used for this study did not however reveal any deviant trends between the age groups studied (data not shown).
Another factor that could have a significant impact on the results is the proportion of people from ethnic minorities that do not consume alcohol. We do not have information on this in our survey but some help can be found from Statistics Sweden on this matter. Official statistics do not show any diverging trends between different age groups regarding the proportion of other ethnic groups. It should also be noted here that the study period is relatively short and thus does not allow for any major changes in the composition of the general Swedish population. This suggests that it is unlikely that the results found are a result of changes in the proportion of the population owing to ethnic minorities that do not consume alcohol.
Although the collectivity theory is only valid for the population as a whole in the way it was formulated by Skog (Skog, 1985), the observations made in the present study and by others (Hallgren et al., 2012) raise some questions on the relevance of this theory in today's society. One explanation, albeit speculative, could be that there are subgroups within populations that have a collective drinking culture and that we fail to recognize their collectivity in studies of the overall population. Changing the way we apply the collectivity theory could help our understanding of alcohol consumption within populations in today's society. Another issue highlighted by these results is that the most apparent changes in the relative dispersion during this period have happened in the lower tail of the distribution and perhaps the most important change is the increase in proportions of non-consumers. Since the levels of consumption in these groups are low, this does not automatically mean that these groups have contributed the most to the decline in the overall consumption. The small relative changes among heavy drinkers could be what have pushed overall consumption down. Further studies focusing on this are needed.
With regard to the limitations of this study, one can mention increasing non-response rates in the survey, from roughly 45 to 55–60% during the study period (Ramstedt et al., 2010b). If heavy drinkers are increasingly overrepresented among those not reached, the survey data could give a false picture of the development in consumption overall and in particular for heavy-drinking groups. Findings from a recent methodological study (based on monitoring data) however suggest that increasing non-response rates are not likely to have a significant bias towards a lower coverage rate of heavy drinkers (Wennberg et al., 2011). Still, given that the results are based on general population data, it is possible that the consumption trends for more marginalized heavy drinkers, e.g. people without access to a telephone, follow another pattern. At present, however, there are no data allowing for monitoring drinking in this group over time.
It should also be noted that there are merits of the data: the same questions and methods have been used and the steady and gradual changes seen in the results indicate that there are stable trends of changing alcohol consumption that are not an artefact of methodological issues. This assumption is also strengthened by the fact that during the study period the coverage rate of consumption, when compared with registered sales data, has remained stable at around 40% (Ramstedt et al., 2010a).
CONCLUSION
The general findings in this paper lend some support for the total consumption model and the collectivity theory, namely that the decline in overall per capita consumption has rendered a decline in consumption at all levels of consumption. Measures aimed at reducing per capita consumption are thus likely to imply fewer heavy drinkers and, thus, a lower prevalence of alcohol-related harm. The results from this study do not show any signs of a polarization of drinking in the general Swedish adult population. On the other hand, the results also confirm that lowering per capita consumption cannot always be expected to imply lower heavy drinking in all population subgroups since the older population subgroups and those with a high alcohol consumption, especially among women, are not drinking less when comparing 2004 and 2011. This gives implications for prevention work in Sweden to target certain high-risk groups with special efforts; for example, new prevention strategies for the elderly should be designed. More generally, the findings presented here illustrate the complexity in the process underlying changes in alcohol consumption in a population.
Funding
This study was funded by the Swedish Council for Working Life and Social Research (FAS, Grant number 2009-1705). Conflict of interest statement. None declared.
