


Abstract
Aims: Reducing craving is a key to success in the treatment of alcohol dependence. The emotion circuit may be involved in pathological craving for alcohol. In this study, we investigated neural correlates of emotional involvement in craving in alcohol dependence. Methods: The study included 17 detoxified alcoholic patients and 25 social drinkers. We used functional magnetic resonance imaging to examine brain activation (blood oxygen level-dependent signals) while participants reported craving and emotion in response to visually presented, alcohol-related stimuli and emotional stimuli. Results: In the craving-rating paradigm, negative emotional stimuli as well as alcohol cues activated craving-related brain regions in alcoholic patients. Activations of the inferior parietal lobule and dorsolateral prefrontal cortex by negative emotional stimuli were negatively correlated with craving; meanwhile limbic activation was positively correlated with craving. For the emotion paradigm, greater limbic activation was evident by alcohol-related stimuli in the alcohol-dependent group. Conclusions: Our findings constitute neural evidence for emotional involvement in pathological craving for alcohol, underscoring the importance of emotion management in abstinent alcoholic patients for relapse prevention.
INTRODUCTION
Reducing craving is a key to success in the treatment of alcohol dependence (Jellinek, 1955; Litt et al., 2000). Many alcohol-dependent individuals attempt to quit drinking but are thwarted by alcohol craving. Alcohol craving is defined as an impulse, motivation, emotion or thought associated with the consumption of alcohol (NIAAA, 1989). Craving can be induced not only by anticipation of the positive effects of alcohol consumption but also by stress or negative affect (Anton, 1999). Craving is not necessarily pathological because it is observed in both subclinical heavy drinkers and alcohol-dependent people (Ihssen et al., 2011; Seo et al., 2011).
The possibility of emotional involvement in pathological craving is suggested by abnormalities in alcohol-dependent people in the recognition of emotional facial expressions (Kornreich et al., 2001; Frigerio et al., 2002; Townshend and Duka, 2003; Maurage et al., 2008). There is behavioural evidence that negative-mood induction provokes craving in alcohol dependents as well as social drinkers (Sinha et al., 2009; Seo et al., 2011). Alcohol-related stimuli are also related to emotion. In heavy drinkers, alcohol cues are associated with positive emotion, which correlates with drinking amount (Jajodia and Earleywine, 2003; Lee et al., 2005). In contrast, alcohol-related stimuli are associated with negative emotion in treatment-seeking alcohol-dependent patients (Lee et al., 2005; Sinha et al., 2009). The neurocircuitry underlying pathological craving may include the emotion circuit (Koob and Volkow, 2010; Volkow et al., 2011). However, there is little neural evidence for an involvement of the emotional circuit in craving. Functional brain imaging studies indicate that the amygdala, hippocampus, insula, ventral striatum, anterior cingulate cortex, dorsolateral prefrontal cortex and orbitofrontal cortex are activated by alcohol-related stimuli (George et al., 2001; Schneider et al., 2001; Wrase et al., 2002; Myrick et al., 2004) in both subclinical and alcohol-dependent populations (Ihssen et al., 2011; Seo et al., 2011). These regions play an important role in emotional processing as well as craving (Phan et al., 2002).
The aim of the present study was to examine the neural correlates of emotional involvement in alcohol craving using functional magnetic resonance imaging (fMRI). We used two paradigms, a craving paradigm and an emotion paradigm, to examine neural responses in alcohol-dependent patients to alcohol-related and emotional stimuli. We hypothesized that we would see the following in treatment-seeking, abstinent alcohol-dependent patients compared with social drinkers: (a) more craving in response to negative emotional stimuli; (b) different activation of craving-related regions by emotional stimuli while reporting craving; (c) more negative emotional ratings for alcohol-related stimuli and (d) greater activation of the emotion circuit by alcohol-related stimuli while reporting emotion. Emotional stimuli may induce craving more weakly than alcohol-related stimuli, even though emotional stimuli can induce craving (Sinha et al., 2009). Therefore, in the craving paradigm, we measured craving responses to emotional stimuli and alcohol-related stimuli. During the emotion paradigm, we measured emotional ratings for all stimuli including alcohol-related stimuli.
MATERIALS AND METHODS
Participants and instruments
The study involved age- and gender-matched groups of alcohol-dependent patients and healthy social drinkers. Seventeen alcohol-dependent patients from the outpatient clinic or inpatient psychiatric ward of Severance Mental Health Hospital in Korea participated in the study. All patients were interviewed by two psychiatrists (Y-CJ and EL) using the DSM-IV (American Psychiatric Association, (2000) to exclude other axis I or substance use disorders (except nicotine- or caffeine-related disorders). The patients had abstained from alcohol for at least 14 days (mean = 39 ± 44 days) prior to scanning. On the day of scanning, we verified abstinence via a random breathalyzer as well as a withdrawal symptom score of <10 as measured by the Clinical Institute Withdrawal Assessment of Alcohol Scale (Sullivan et al., 1989). We also verified that smokers were not in a withdrawal state. The mean duration of illness was 8.4 ± 5.9 years. The mean number of psychiatric admissions was 1.9 ± 2.3.
We recruited 25 healthy social drinkers via postings in the hospital and local newspaper advertisements. To be included in the study as healthy controls, participants were required to meet the criteria for social drinking (fewer than 14 drinks per week and fewer than four drinks per occasion) and have neither lifetime psychiatric history nor current, diagnosed psychiatric disorder.
All participants participated voluntarily and completed written informed consent forms. The study was approved by the Institutional Review Board of Severance Mental Health Hospital, Yonsei University Health System. All participants underwent physical examinations to screen for medical and neurological disease. We collected information for the patient group from the patients themselves and from their family members. We conducted interviews to assess socio-demographic variables and history of alcohol use for each participant (Table 1). The two groups differed in educational level; however, their cognitive function as assessed by Raven's Standard Progressive Matrix (Raven and Raven, 1988) was equivalent. We used Timeline Followback to assess each participant's level of alcohol consumption over a period of 4 weeks prior to the day of participation (Sobell et al., 1979). As the participants’ duration of abstinence was quite long, we also assessed lifetime drinking levels. The mean lifetime drinking amount was 4.0 ± 3.2 × 10⁴ standard drinking units (SDUs; 1 SDU is ∼12 g of alcohol). We measured the severity of alcohol dependence and craving using the alcohol-dependence scale (ADS) (Skinner and Allen, 1982), visual-analogue scale (VAS) (Potgieter et al., 1999) and obsessive compulsive drinking scale (OCDS) (Anton et al., 1995).
Socio-demographic characteristics and clinical variables
| Alcoholics (n = 17) | Controls (n = 25) | t/X2 | P | |
|---|---|---|---|---|
| Age (years) | 34.7 ± 4.9 | 34.0 ± 5.4 | 0.5 | 0.626 |
| Gender (M/F) | 12/5 | 18/7 | 0.01 | 1.000 |
| Years of education | 14.6 ± 2.1 | 16.7 ± 1.7 | −3.5 | 0.001 |
| Raven's SPM | 50.6 ± 7.4 | 54.7 ± 3.9 | −1.9 | 0.07 |
| ADS | 20.2 ± 6.7 | 0.5 ± 1.2 | 11.3 | <0.001 |
| OCDS | 29.7 ± 0.4 | 1.6 ± 1.7 | 9.7 | <0.001 |
| VAS (mm) | 32.4 ± 43.2 | 2.4 ± 7.9 | 3.4 | 0.002 |
| BDI | 18.3 ± 10.9 | 4.6 ± 3.9 | 4.5 | <0.001 |
| BAI | 13.3 ± 10.9 | 4.6 ± 3.8 | 2.7 | 0.021 |
ADS, alcohol dependence scale; BAI, Beck anxiety inventory; BDI, Beck depression inventory; OCDS, obsessive compulsive drinking scale; SPM, standard progressive matrix; VAS, visual analogue scale.
Stimuli and behavioural protocol
Ten pictures were selected from each of four stimulus categories: alcohol-related, non-alcoholic beverage-related (e.g. milk, coffee and soda), negative emotional and positive emotional. In a previous study, we validated the alcohol-related stimuli for inducing craving in alcohol-dependent patients (Lee et al., 2006). They included advertisements for alcoholic beverages and pictures of bottles of beer and soju (the most popular traditional liquor in Korea; http://www.kalia.or.kr/drink/k_drink_03.html?b_cata_sub_idx=3&b_idx=16). The non-alcoholic beverage-related stimuli were developed to be similar to the alcohol-related stimuli with respect to size, colour and other physical properties. The emotional stimuli were taken from the International Affective Picture System (Lang et al., 1997) and maintained a balance between the arousal and emotional valence dimensions.
The fMRI experiment was done in both the craving paradigm and the emotion paradigm. Each paradigm was 621 s in duration, including 21 s of introduction. Using an event-related design, we presented each stimulus for 3 s (including 0.5 s inter-stimulus interval) in a randomized order. Stimuli in each category (alcohol, beverage, negative and positive) were repeated three times. The total number of trials was 120. The inter-trial interval (ITI) varied among 3, 6, 9 and 12 s. A fixation cross was presented during the ITI.
The participants reported craving or emotional responses to the stimuli using a computer mouse. At the beginning of the craving paradigm, we instructed the participants as follows: ‘For each of the following pictures, if you crave alcohol, press the left button. If you don't crave alcohol, press the right button’. At the beginning of the emotion paradigm, we instructed the participants as follows: ‘For each of the following pictures, if you feel positive, press the left button. If you feel negative, press the right button.’ For both paradigms, we asked the participants to respond as quickly as possible to each stimulus. For counterbalancing, half the participants completed the craving paradigm first and half completed the emotion paradigm first. All the participants completed an initial practice task.
We computed craving and positive emotional responsivity as a percentage (i.e. number of left button responses/total responses × 100). After the scan was completed, we asked the participants to rate each of the stimuli using the self-assessment manikin (SAM) (Bradley and Lang, 1994). We used SPSS v.18 for Windows (SPSS, Chicago, IL, USA) for all statistical computations. We examined differences in craving and emotional responsivity between the patients and the social drinkers, using independent samples t-tests. Statistical significance was set at P < 0.05.
fMRI acquisition
We used a 1.5 T scanner (Signa Eclipse; GE Medical Systems) for the fMRI scans. We obtained blood oxygen level-dependent (BOLD) signals with an echo-planar imaging sequence (gradient echo, 64 × 64 × 30 matrix with 3.75 × 3.75 × 5 mm spatial resolution; echo time = 14.3 ms; repetition time = 3000 ms; field-of-view = 240 mm; slice thickness = 5 mm; flip angle = 90°; number of slices = 30). We also acquired a series of high-resolution anatomical images using a fast spoiled gradient-echo sequence (256 × 256 × 116 matrix with 0.94 × 0.94 × 1.5 mm spatial resolution; field-of-view = 240 mm; slice thickness = 1.5 mm; repetition time = 8500 ms; echo time = 1800 ms; flip angle = 12°; number of slices = 116).
fMRI data analysis
fMRI data analysis was conducted using Analysis of Functional Neuroimages (AFNI) (Cox, 1996). For each task, we discarded the first six time points of the time series data to eliminate the fMRI signal decay associated with reaching equilibrium. We corrected all remaining fMRI data for slice timing and co-registered to the first remaining time sample to correct for the confounding effects of small head movements. Further processing included temporal and spatial smoothing (three-point median filter and Gaussian filter with 8-mm full width at half maximum). We produced subjective activation maps using a deconvolution routine in AFNI. Six head movement parameters were covaried for each analysis. The haemodynamic response function has six basis tent functions for the 18 s following stimulus onset. We estimated brain activation associated with each stimulus by averaging six regression coefficients with six basis tent functions. We performed spatial normalization to transform the data into Talairach space using the Montreal Neurological Institute N27 template in AFNI (bilinear interpolation, spatial resolution: 2 × 2 × 2 mm3).
To compare brain activation in response to alcohol-related and emotional stimuli, we used non-alcoholic beverage-related stimuli as a control. The mean valence of non-alcoholic beverage-related stimuli as measured by SAM was 5.7 ± 1.3 for the patient group and 5.9 ± 0.8 for the social drinker group, indicating a neutral valence. The values of the two groups did not differ (t = 0.3, P = 0.7). We obtained three individual contrast maps (positive-beverage, negative-beverage and alcohol-beverage) for each group. For all the fMRI analyses, behavioural responses were included as a covariate (the craving responsivity of positive-beverage, negative-beverage and alcohol-beverage, respectively). To examine the brain activity patterns in response to each stimulus category (alcohol-beverage, negative-beverage and positive-beverage) in the patient group, we performed one-sample t-tests. We also conducted one-way analyses of variance (ANOVA) to examine the difference in activation induced by each stimulus category. With these contrast maps, we performed a 2 (group) × 3 (stimulus category) ANOVA. We took a voxel-wise height threshold of P < 0.005 with a 20-voxel extent threshold. In addition, we performed the ANOVA with a significance of corrected P < 0.05 after family-wise error correction in order to identify brain regions satisfying more conservative criteria.
To examine the relationship between regional brain activity and clinical variables, we performed correlation analysis. For this analysis, the individual brain activities (% BOLD signal changes from the contrast maps) were extracted on the basis of the survived clusters in the group analysis with ANOVA.
Results
Behavioural measures and subjective ratings
We measured craving and positive emotional responsivity as a percentage (i.e. number of left button responses/total responses × 100). During the craving paradigm, the patient group reported higher responsivity of craving to alcohol-related stimuli (70 ± 35 vs. 20 ± 24%, t = 5.6, P < 0.001) and negative emotional stimuli (18 ± 28 vs. 3 ± 9%, t = 2.1, P = 0.048) than did the control group. There was no group difference in craving responsivity elicited by non-alcoholic beverage-related and positive emotional stimuli. During the emotion paradigm, the patient group reported significantly higher positive emotional responsivity to alcohol-related stimuli than did the control group (62 ± 37 vs. 31 ± 33%, t = 2.8, P = 0.01). There was no group difference in positive emotional responsivity elicited by non-alcoholic beverage-related or negative emotional stimuli. However, the patient group reported significantly lower positive emotional responsivity to positive emotional stimuli than did the control group (79 ± 16 vs. 90 ± 13%, t = −2.6, P = 0.01).
On the SAM, the patient group reported higher arousal in response to alcohol-related stimuli than did the control group (4.5 ± 2.2 vs. 2.8 ± 1.5, t = 2.9, P = 0.01). There were no significant group differences in arousal ratings for other stimulus categories, nor was there a significant group difference in emotional valence ratings for any of the stimulus categories.
fMiRI results
Neural circuits activated during the craving paradigm
The one-sample t-test results for the patient group are shown in Supplementary data S1. With craving responsivity as a covariate, the brain activations in response to the three stimulus categories (alcohol, negative and positive) were not significantly different in the patient group.
Two-way ANOVA for the craving paradigm showed that alcohol-related stimuli elicited stronger BOLD activity in the inferior parietal lobule (IPL), dorsolateral prefrontal cortex (DLPFC), medial prefrontal cortex, posterior cingulate and temporal pole in the patient group than in the control group (Table 2). Interactions between group and craving responsivity to negative emotional stimuli were observed for the IPL, DLPFC, cerebellum, temporal pole and amygdala (Fig. 1 and Table 2). In the DLPFC and the IPL, BOLD responses were negatively correlated with craving in the patient group but not the control group. By contrast, activation of the amygdala, temporal pole and cerebellum was positively correlated with craving in the patient group. However, when significance was adjusted to a corrected P of < 0.05, the IPL showed significant group or interaction effects in response to both alcohol-related stimuli and negative emotional stimuli.
Brain activation during the craving paradigm
| Region of activation (L/R) | Coordinatesa (x, y, z) | Cluster size (voxel) | F | |
|---|---|---|---|---|
| Alcohol-control | ||||
| Group effect | Inferior parietal lobule (R)* | 47, −63, 32 | 194 | 10.24 |
| Superior temporal gyrus (R) | 65, −13, 4 | 48 | 10.24 | |
| Temporal pole (R) | 53, 15, 0 | 38 | 9.61 | |
| Posterior cingulate (R) | 1, −47, 26 | 38 | 9.61 | |
| Superior frontal gyrus (R) | 21, 15, 38 | 37 | 10.24 | |
| Superior medial gyrus (L) | −3, 53, 30 | 31 | 10.89 | |
| Negative-control | ||||
| Group effect | Cerebellum (R) | 41, −57, −24 | 64 | 10.24 |
| Superior orbital gyrus (R) | 15, 29, −12 | 30 | 10.89 | |
| Interaction | Inferior parietal lobule (R)* | 49, −43, 44 | 183 | 14.44 |
| Middle frontal gyrus (L) | −35, 53, 20 | 56 | 16.00 | |
| Cerebellum (R) | 33, −33, −32 | 38 | 12.96 | |
| Temporal pole (R) | 27, 21, −22 | 29 | 12.96 | |
| Amygdala (R) | 21, −7, −8 | 25 | 11.56 | |
| Positive-control | ||||
| Group effect | Superior frontal gyrus (L) | −15, 55, 24 | 55 | 10.89 |
| Interaction | Cerebellum (L) | −1, −53, −42 | 23 | 10.89 |
L, left; R, right. Significance was set at an uncorrected P of < 0.005 with a 20-voxel extent threshold.
*Significant regions at the additional analysis of corrected P < 0.05.
aTalairach coordinates were used.
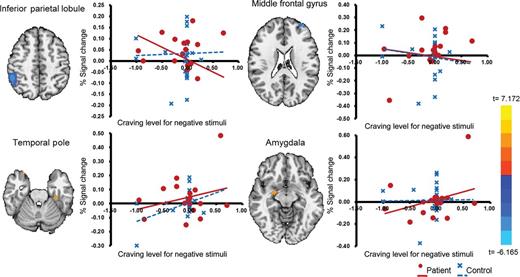
Interactions between group and craving responsivity to negative emotional stimuli. As craving responsivity increased in the patient group, activation of the right inferior parietal lobule and the left dorsolateral prefrontal cortex decreased and activation of limbic region increased.
To examine the relationship between clinical characteristics and neural correlates of emotional involvement for the patient group cravings, we looked for correlations between clinical characteristics and brain regions showing significant activation in the two-way ANOVA after removing an outlier. Among the regions showing a significant interaction between group and craving for negative emotional stimuli in the craving paradigm (Table 2), the BOLD activity of the DLPFC correlated with duration of abstinence (r = 0.537, P = 0.032) and craving measured by VAS (r = −0.760, P = 0.048). The BOLD activities of the IPL and DLPFC were negatively associated with the BOLD activities of the cerebellum, temporal pole and amygdala ( Supplementary data S2).
Neural circuits activated during the emotion paradigm
The one-sample t-test results for the emotion paradigm are shown in Supplementary data S3. With positive emotional responsivity as a covariate, one-way ANOVA revealed differential activation patterns in the right visual cortex ([23, −93, 4], t = 7.760, cluster size = 100 voxels, alcohol > negative > positive) and the left cerebellum ([−29, −61,−34], t = 6.642, cluster size = 25 voxels, alcohol and positive > negative).
Two-way ANOVA for group comparison showed greater activation of the temporal pole by alcohol-related stimuli in the patient group (Table 3). Activation of the visual processing area by negative emotional stimuli was greater in the patient group than in the control group. Upon additional analyses with corrected P < 0.05, the difference was still significant.
Brain activation during the emotional paradigm
| Region of activation (L/R) | Coordinatesa (x, y, z) | Cluster size (voxel) | F | |
|---|---|---|---|---|
| Alcohol-control | ||||
| Group effect | Temporal pole (L) | −21, 5, −32 | 31 | 13.69 |
| Negative-control | ||||
| Group effect | Middle occipital gyrus (L)* | −19, −83, 10 | 185 | 10.24 |
| Interaction | Inferior temporal gyrus (R) | 41, −5, −36 | 57 | 12.96 |
| Anterior cingulate (R) | 7, 43, 22 | 28 | 9.61 | |
| Positive-control | ||||
| Group effect | Superior occipital gyrus (L) | −13, −91, 2 | 103 | 10.89 |
| Cuneus (R) | 9, −83, 12 | 97 | 9.61 | |
| Middle occipital gyrus (R) | 27, −77, 12 | 55 | 10.24 | |
| Thalamus (R) | 5, −9, 10 | 34 | 10.89 | |
| Fusiform gyrus (L) | −23, −69, −2 | 24 | 10.24 | |
| Interaction | Insula (R) | 33, 25, 4 | 99 | 12.25 |
L, left; R, right. Significance was set a level of uncorrected P < 0.005 with a 20-voxel extent threshold.
*Significant regions at the additional analysis of corrected P < 0.05.
aTalairach coordinates were used.
DISCUSSION
This study involved two paradigms: a craving paradigm and an emotion paradigm. In the craving paradigm, we found that emotional stimuli, like alcohol-related stimuli, activate craving-related regions in alcohol dependence. The brain activations in response to negative emotional stimuli were associated with craving. In the emotion paradigm, we observed greater activation of the limbic region by alcohol-related stimuli in the patient group compared with the controls.
The patient group reported greater craving elicited by negative emotional stimuli than did the control group, but their craving in response to this type of stimulus was far less than that elicited by alcohol-related stimuli (18 vs. 70%). Therefore, we examined brain activation covarying with craving responsivity to control for this difference. We found that craving-related brain activations by three stimulus categories (alcohol, negative and positive) were not different from each other in the patient group after covarying with craving. However, two-way ANOVA (group × stimulus category) results were somewhat different. Alcohol-related stimuli induced greater activation of the IPL, DLPFC and limbic regions in the patient group compared with the control group. In contrast, negative emotional stimuli provoked a craving-related dissociation between the IPL/DLPFC and limbic regions in the patient group: as craving increased, limbic activation increased but the IPL and DLPFC activation decreased. The DLPFC is believed to be involved in anticipation of alcohol consumption (Wilson et al., 2004). The IPL, which exhibited similar interaction effects as the DLPFC, is a major target of the limbic system and receives afferent projections from the DLPFC and limbic areas (Lamb et al., 1989; Clower et al., 2001). The IPL is believed to contribute to allocation of a convergence of attention based on sensory information (Ohira et al., 2006). IPL co-activation with the DLPFC suggests a relationship between processing the emotional component and pathological craving.
Using correlation analyses, we confirmed reciprocal activation of the prefrontal and limbic regions ( Supplementary data S3). This finding is consistent with Koob and Le Moal's hypothesis that hypofunction of the prefrontal system contributes to hyper-activation of the limbic system in alcohol dependence (Koob and Le Moal, 2005). Prefrontal and limbic regions are key elements of the emotion-processing circuit. The prefrontal cortex plays an important role in regulating emotional responses and exhibits functional reciprocity with limbic regions (Lang et al., 1998; Olson et al., 2007). Increased prefrontal activation during emotional regulation is associated with decreased activation of the amygdala (Ochsner et al., 2004; Phan et al., 2005). Studies of other psychiatric illnesses (e.g. borderline personality disorder, schizophrenia and psychostimulant addiction) have found that prefrontal hypofunction is associated with limbic hyperactivity (Silbersweig et al., 2007; Williams et al., 2007; Tobias et al., 2010). However, to the best of our knowledge, this is the first study to demonstrate that prefrontal-limbic dysfunction contributes to an interaction between emotion and pathological craving in alcohol dependence.
In the emotion paradigm, the temporal pole showed a greater BOLD response in response to alcohol-related stimuli in the patient group than in the control group. This finding also supports the hypothesis that alcohol cues recruit greater activation of the emotional circuit in alcohol dependence. The temporal pole is located between and is interconnected with the orbitofrontal cortex and amygdala. It receives projections from the orbitofrontal cortex, amygdala, insula and visual cortex, and is important for autonomic regulation of emotion (Olson et al., 2007). In addition, the temporal pole is a well-known craving-related region in substance dependence (Childress et al., 1999; Brody et al., 2002). We observed recruitment of the temporal pole by alcohol-related stimuli in the craving paradigm as well. Therefore, the results suggest that the role of temporal pole is an emotional involvement with pathologic craving in alcohol dependence.
We hypothesized that alcohol-related stimuli would be associated with negative emotion in alcoholic patients. However, the patient group rated alcohol-related stimuli with higher positive responsivity than the control group. The differences from previous findings (Lee et al., 2005; Sinha et al., 2009) may be due to the clinical characteristics of the participating patients. Negative emotional association with alcohol cues is correlated to illness severity of their alcohol dependence (Lee et al., 2005). Clinically, the participants in this study seemed less severe than previous study subjects in terms of admission history and drinking amount. All the patients in our study were seeking treatment, but they may not associate alcohol cues with negative emotion as much as previous subjects.
This study had several limitations. First, although none of the patients was diagnosed with comorbid depressive disorder by psychiatric interview, depression and anxiety scores were significantly higher in the patient group. Considering that we observed craving-related reciprocal activation of the prefrontal-limbic circuit by negative emotional stimuli and correlations with duration of abstinence, elevated depression and anxiety scores in our patient population may reflect a protracted withdrawal state. Protracted withdrawal is believed to be a major cause of craving and relapse (Sinha and Li, 2007; Heilig et al., 2010). Meanwhile, there were no significant correlations between the BDI, BAI or the arousal for alcohol stimuli and activation of any brain region. A second limitation of this study is that we treated pictures of non-alcoholic beverages as control stimuli. However, the mean valence of the positive and negative emotional stimuli (5.7 and 5.9 for the patient and the control groups, respectively) was comparable with the mean valence of the non-alcoholic beverage-related stimuli (5.7 and 6.0 for the patient and the control groups, respectively). Furthermore, there is precedence in the literature for using non-alcoholic beverage-related stimuli as a control (Heinz et al., 2007). Finally, it should be noted that the statistical threshold of our fMRI analysis was not satisfied with the corrected P < 0.05. As mentioned above, in alcohol dependence, craving-related brain activation by emotional stimuli is expected to be less robust than craving-related activation by alcohol stimuli (Sinha et al., 2009). Thus, we set a less conservative threshold of P < 0.005 with a 20-voxel extent to avoid type II errors (Lieberman and Cunningham, 2009).
In summary, we identified recruitment of the prefrontal-IPL-limbic circuit as a neural substrate of emotional involvement in pathological alcohol craving. Our findings underscore the importance of emotion management in abstinent alcoholic patients for the prevention of relapse. Programmes such as mindfulness-based relapse prevention, which focus on emotional states and craving, may be especially effective (Bowen et al., 2009). Further study is needed to evaluate the effect of protracted withdrawal on emotional involvement in pathological alcohol craving.
Supplementary material
Supplementary material is available at Alcohol and Alcoholism online.
Funding
This work was supported by the National Research Foundation of Korea Grant funded by the Korean Government (KRF-2008-E00181), Korea Healthcare technology R&D Project, Ministry for Health, Welfare & Family Affairs, Republic of Korea (No. A090537) and a faculty research grant from Yonsei University College of Medicine (6-2008-0101).
Acknowledgements
We thank Ms. Ji Won Chun and Mr. Won Ho Lee for enthusiastic technical assistance.
References
Author notes
These authors contributed equally in the conception of the study and the writing of this paper.
