


Abstract
Rates of hypertension, high low density lipoprotein (LDL) cholesterol, and diabetes mellitus awareness, treatment, and control for persons with a history of myocardial infarction and stroke were compared by using two nationally representative samples of the US population: the Third National Health and Nutrition Examination Survey in 1988–1994 (n = 1,004) and the National Health and Nutrition Examination Survey in 1999–2002 (n = 512). Estimated numbers of adult myocardial infarction and stroke survivors increased from 6.32 to 6.78 million and from 3.85 to 4.96 million, respectively. Among such survivors, awareness of a previous diagnosis of hypertension and prevalence of self-reported diabetes mellitus remained stable while awareness of high LDL cholesterol increased from 43.3% to 60.2% (p < 0.01). Among those aware of their diagnosis, pharmacologic treatment for high LDL cholesterol increased from 33.1% to 78.4% and pharmacologic treatment for diabetes mellitus increased from 80.0% to 93.6% during this time (each p < 0.01), while pharmacologic treatment for hypertension increased nonsignificantly. Among those receiving pharmacologic treatment, hypertension and high LDL cholesterol control increased from 48.9% to 59.3% (p = 0.05) and from 5.1% to 33.1% (p < 0.01), respectively. In contrast, glycemic control among diabetics decreased from 45.0% to 33.2% (p = 0.20). The number of US myocardial infarction and stroke survivors increased between 1988–1994 and 1999–2002, and substantial improvements occurred in the awareness, treatment, and control of high LDL cholesterol in this population.
National US vital statistics indicate that the age-adjusted rate of coronary heart disease mortality declined 52.1 percent (from 503/100,000 to 241/100,000) between 1970 and 2002 (1). Over the same time period, age-adjusted stroke mortality declined 63 percent (from 152/100,000 to 56/100,000). The decline in cardiovascular disease (CVD) mortality in the United States has been reported to be due, in part, to improvements in short-term case fatality (2). While clearly a medical triumph, the consequence of improvements in myocardial infarction and stroke case-fatality rates is a larger pool of persons in need of targeted secondary prevention (3). The continued aging and growth of the US population also is expected to translate into a higher number of myocardial infarction and stroke survivors in the United States in the future.
Previous studies have shown a high prevalence of CVD risk factors in patients with established CVD (4–7). For example, Qureshi et al. (6) reported that 42 percent of patients with a history of myocardial infarction and stroke had poorly controlled or undiagnosed hypertension, 18 percent were current smokers, 43 percent had a body mass index of ≥27.3 kg/m2 (≥27.8 kg/m2 for men), 28 percent had a total cholesterol level of ≥240 mg/dl, and 11 percent had uncontrolled diabetes mellitus. Additionally, Khot et al. (7) pooled data from 14 randomized controlled trials (n = 122,458 participants) of secondary coronary heart disease prevention to study the prevalence of conventional CVD risk factors. Of the men and women in these trials, 38.4 percent and 55.9 percent had hypertension, 41.6 percent and 29.5 percent were current smokers, 34.1 percent and 39.6 percent had hyperlipidemia, and 15.3 percent and 23.2 percent had diabetes mellitus, respectively.
Because treatment guidelines for patients with established CVD have been published and widely disseminated over the past decade, we sought to determine temporal trends in the prevalence, awareness, treatment, and control of traditional CVD risk factors among patients with established CVD. These trends were investigated over an interval of nearly a decade by using data from two nationally representative samples of the US population: the Third National Health and Nutrition Examination Survey (NHANES III) conducted in 1988–1994 and the National Health and Nutrition Examination Survey (NHANES) conducted in 1999–2002.
MATERIALS AND METHODS
The surveys
NHANES III and NHANES 1999–2002 were nationally representative, cross-sectional surveys of the civilian noninstitutionalized population of the United States (8, 9). The procedures involved in these studies have been published in detail and are available online (8, 9).
Each NHANES survey consisted of an in-home interview followed by a medical evaluation at a mobile examination center. The respective participation rates for the questionnaire and examination components were 86 percent and 78 percent for NHANES III and 85 percent and 81 percent for NHANES 1999–2002. Of relevance to the current analysis, information on the following variables was collected during the in-home interview: age, race-ethnicity, gender, cigarette smoking, history of myocardial infarction and stroke, and previous diagnosis of and treatment for hypertension, high cholesterol, and diabetes mellitus. For the current study, participants who reported having been previously told by a physician or other health professional that they had a “heart attack, also called myocardial infarction” or “stroke” were defined as having a history of myocardial infarction and stroke, respectively. Participants who reported having smoked ≥100 cigarettes during their lifetime were classified as current smokers if they answered affirmatively to the question, “Do you smoke cigarettes now?” For all adult study participants, each NHANES examination procedure involved a standardized physical examination that included measurements of height, weight, waist circumference, and blood pressure and a blood sample collection. Body mass index was calculated as weight in kilograms divided by height in meters squared. Overweight and obesity were defined as a body mass index of ≥25 kg/m2 and ≥30 kg/m2, respectively.
In NHANES III and NHANES 1999–2002, up to three blood pressure measurements were taken by a physician using the standard protocol of the American Heart Association during a single visit to a mobile examination center (10). Although three additional blood pressure measurements were taken during the NHANES III home interview, for comparability, only the three blood pressure measurements from the mobile examination center were used in the current analysis. On the basis of the average of all three blood pressure measurements, hypertension was defined as systolic blood pressure of ≥140 mmHg or diastolic blood pressure of ≥90 mmHg and/or self-reported current use of blood pressure–lowering medication. Awareness of hypertension was defined as a self-report of any prior diagnosis of hypertension by a health-care professional. Treatment of hypertension was defined as self-reported current use of pharmacologic medication to manage high blood pressure. Control of hypertension was defined as having an average systolic blood pressure of <140 mmHg and an average diastolic blood pressure of <90 mmHg in the context of pharmacologic treatment of hypertension.
Detailed descriptions of blood collection and processing are provided in the NHANES Laboratory/Medical Technologists Procedures Manual (8, 9). For the subsample of NHANES participants who attended the morning examination session, fasted ≥8 hours prior to their NHANES visit, and had a serum triglyceride level of <400 mg/dl (n = 393 and n = 290 with a history of myocardial infarction and stroke for NHANES III and NHANES 1999–2002, respectively), low density lipoprotein (LDL) cholesterol was calculated by using the Friedewald equation (11): LDL cholesterol (mg/dl) = total cholesterol (mg/dl) – high density lipoprotein cholesterol (mg/dl) – triglycerides (mg/dl)/5.
For the current analysis, participants were classified as having high LDL cholesterol if their LDL cholesterol concentration was ≥100 mg/dl and/or they reported using cholesterol-lowering medication within 2 weeks of their NHANES study visit (12). Awareness of high LDL cholesterol was defined as a self-report of any prior diagnosis of hypercholesterolemia by a health-care professional. Treatment of high LDL cholesterol was defined as self-reported current use of cholesterol-lowering medication. Controlled LDL cholesterol was defined as an LDL cholesterol concentration of <100 mg/dl in the context of pharmacologic treatment.
Per the study protocol, plasma glucose was not measured in approximately 50 percent of NHANES 1999–2002 participants. The number of patients with a history of myocardial infarction and stroke as well as concurrent diabetes mellitus was too low to assess awareness, treatment, and control in the current study when limited to the subset of participants for whom fasting plasma glucose measurements were available. To garner the power from the full study sample of NHANES III and NHANES 1999–2002, diabetes mellitus was defined as a previous diagnosis by a health-care provider while the patient was not pregnant. Although this definition results in participants unaware of their diabetes diagnosis being classified as nondiabetic, it provided greater statistical power to compare rates of diabetes treatment and control between NHANES 1988–1994 and NHANES 1999–2002. Treatment of diabetes mellitus was defined as self-reported current use of insulin or antidiabetic pills. Glycohemoglobin was measured by using the Boronate Affinity High Performance Liquid Chromatography system at the Diabetes Diagnostic Laboratory at the University of Missouri at Columbia, and glycemic control was defined as a glycated hemoglobin reading of <7.0 percent.
The protocols for NHANES III and NHANES 1999–2002 were approved by the National Center for Health Statistics of the Centers for Disease Control and Prevention's Institutional Review Board.
Statistical analysis
Crude, age-standardized, and age-specific (20–39, 40–59, 60–74, and ≥75 years) prevalence of myocardial infarction and stroke was calculated for each time period. The number of persons in the United States with a history of myocardial infarction and stroke was also estimated for each time period by using the US Census weights provided in the NHANES data sets. Differences in prevalence and count estimates across the two surveys were compared by using t tests and the Wald chi-square test, taking into account the complex survey design used in NHANES III and NHANES 1999–2002.
Data on persons with a history of myocardial infarction and stroke were pooled for the remainder of the analyses because the treatment recommendations for risk factors in both settings were similar and pooling of data increased the statistical power of the analyses (n = 1,004 for NHANES III and n = 512 for NHANES 1999–2002). Demographic characteristics (age, gender, and race-ethnicity) and the prevalence of CVD risk factors (current smoking, overweight and obesity, hypertension, high LDL cholesterol, and diabetes mellitus) and the metabolic syndrome and its components (abdominal obesity, elevated blood pressure, low high density lipoprotein cholesterol, high triglycerides, and impaired fasting glucose) were calculated for participants with a history of myocardial infarction and stroke in NHANES III and NHANES 1999–2002 after standardization to the age distribution of myocardial infarction and stroke survivors in NHANES 1999–2002.
Next, we calculated the age-standardized proportion of myocardial infarction and stroke survivors with hypertension for NHANES III and NHANES 1999–2002 who 1) were aware of their diagnosis of hypertension, 2) were treated with pharmacologic antihypertensive medication, and 3) had achieved blood pressure control. Analogous calculations were performed for those with high LDL cholesterol or with diabetes mellitus. Awareness of diabetes mellitus was not calculated because the definition of diabetes mellitus used was based on self-report of a previous diagnosis. The proportion of the population aware of their hypertension and high LDL cholesterol was restricted to those with hypertension and high LDL cholesterol, respectively, while the proportion of persons on treatment was limited to those aware of each diagnosis. Hypertension, high LDL cholesterol, and diabetes mellitus control was assessed among all participants with each condition, separately, and among those participants receiving treatment for each respective condition. Analyses of awareness, treatment, and control rates were repeated for subgroups defined by race-ethnicity and sex. Finally, the clustering of no, one, two, and three or more uncontrolled CVD risk factors (cigarette smoking, obesity, and uncontrolled hypertension, high LDL cholesterol, and diabetes mellitus) was determined and compared between NHANES III and NHANES 1999–2002.
Sample weights that account for the unequal probabilities of selection, oversampling, and nonresponse were applied for all analyses by using SUDAAN software (version 8.0; Research Triangle Institute, Research Triangle Park, North Carolina). Standard errors were estimated by using the Taylor series linearization method (13).
RESULTS
In NHANES 1999–2002, a history of myocardial infarction and stroke was reported by 3.29 percent and 2.41 percent, respectively, of adults in the United States (table 1). Before and after age standardization and within-age groupings, the prevalences of myocardial infarction and stroke were similar in 1988–1994 and 1999–2002. Overall, there were 6.777 million persons with a history of myocardial infarction and 4.959 million persons with a history of stroke in the United States during 1999–2002 (table 2). Between 1988–1994 and 1999–2002, the estimated number of persons with a history of myocardial infarction increased by 454,000 (p = 0.516), and the estimated number with a history of stroke increased by 1,113,000 (p = 0.033; figure 1). There were 1.495 million more myocardial infarction and/or stroke survivors in the United Stated during 1999–2002 than in 1988–1994 (p = 0.108).
NHANES III (1988–1994) | NHANES 1999–2002 | p value | |
|---|---|---|---|
| Prevalence of myocardial infarction | |||
| Crude | 3.44 (0.21) | 3.29 (0.22) | 0.622 |
| Age adjusted | 3.43 (0.18) | 3.03 (0.21) | 0.148 |
| Age specific (years) | |||
| 20–39 | 0.24 (0.09) | 0.35 (0.14)‡ | 0.509 |
| 40–59 | 2.78 (0.31) | 2.63 (0.42) | 0.774 |
| 60–74 | 10.29 (0.76) | 8.40 (0.74) | 0.075 |
| ≥75 | 14.07 (0.84) | 13.67 (1.13) | 0.776 |
| Prevalence of stroke | |||
| Crude | 2.09 (0.15) | 2.41 (0.16) | 0.145 |
| Age adjusted | 2.12 (0.13) | 2.00 (0.19) | 0.602 |
| Age specific (years) | |||
| 20–39 | 0.24 (0.10) | 0.46 (0.13)‡ | 0.180 |
| 40–59 | 1.45 (0.27) | 1.67 (0.29) | 0.579 |
| 60–74 | 5.23 (0.49) | 5.36 (0.58) | 0.864 |
| ≥75 | 11.36 (0.68) | 11.68 (0.98) | 0.788 |
Standardized to the age distribution of the US population in 2000.
NHANES III, Third National Health and Nutrition Examination Survey; NHANES, National Health and Nutrition Examination Survey.
Fewer than 20 people reported myocardial infarction and stroke, resulting in a potentially unstable estimate.
NHANES III (1988–1994) | NHANES 1999–2002 | p value | |
|---|---|---|---|
| Prevalence of myocardial infarction | |||
| Crude | 3.44 (0.21) | 3.29 (0.22) | 0.622 |
| Age adjusted | 3.43 (0.18) | 3.03 (0.21) | 0.148 |
| Age specific (years) | |||
| 20–39 | 0.24 (0.09) | 0.35 (0.14)‡ | 0.509 |
| 40–59 | 2.78 (0.31) | 2.63 (0.42) | 0.774 |
| 60–74 | 10.29 (0.76) | 8.40 (0.74) | 0.075 |
| ≥75 | 14.07 (0.84) | 13.67 (1.13) | 0.776 |
| Prevalence of stroke | |||
| Crude | 2.09 (0.15) | 2.41 (0.16) | 0.145 |
| Age adjusted | 2.12 (0.13) | 2.00 (0.19) | 0.602 |
| Age specific (years) | |||
| 20–39 | 0.24 (0.10) | 0.46 (0.13)‡ | 0.180 |
| 40–59 | 1.45 (0.27) | 1.67 (0.29) | 0.579 |
| 60–74 | 5.23 (0.49) | 5.36 (0.58) | 0.864 |
| ≥75 | 11.36 (0.68) | 11.68 (0.98) | 0.788 |
Standardized to the age distribution of the US population in 2000.
NHANES III, Third National Health and Nutrition Examination Survey; NHANES, National Health and Nutrition Examination Survey.
Fewer than 20 people reported myocardial infarction and stroke, resulting in a potentially unstable estimate.
Myocardial infarction | Stroke | Either | |
|---|---|---|---|
| NHANES III (1988–1994) | 6,323 (466) | 3,846 (312) | 9,184 (604) |
| NHANES 1999–2002 | 6,777 (522) | 4,959 (396) | 10,679 (709) |
Myocardial infarction | Stroke | Either | |
|---|---|---|---|
| NHANES III (1988–1994) | 6,323 (466) | 3,846 (312) | 9,184 (604) |
| NHANES 1999–2002 | 6,777 (522) | 4,959 (396) | 10,679 (709) |
Numbers and standard errors are expressed in thousands.
p = 0.033 comparing number of persons with a history of stroke between the Third National Health and Nutrition Examination Survey (NHANES III) and the National Health and Nutrition Examination Survey (NHANES 1999–2002).
Myocardial infarction | Stroke | Either | |
|---|---|---|---|
| NHANES III (1988–1994) | 6,323 (466) | 3,846 (312) | 9,184 (604) |
| NHANES 1999–2002 | 6,777 (522) | 4,959 (396) | 10,679 (709) |
Myocardial infarction | Stroke | Either | |
|---|---|---|---|
| NHANES III (1988–1994) | 6,323 (466) | 3,846 (312) | 9,184 (604) |
| NHANES 1999–2002 | 6,777 (522) | 4,959 (396) | 10,679 (709) |
Numbers and standard errors are expressed in thousands.
p = 0.033 comparing number of persons with a history of stroke between the Third National Health and Nutrition Examination Survey (NHANES III) and the National Health and Nutrition Examination Survey (NHANES 1999–2002).
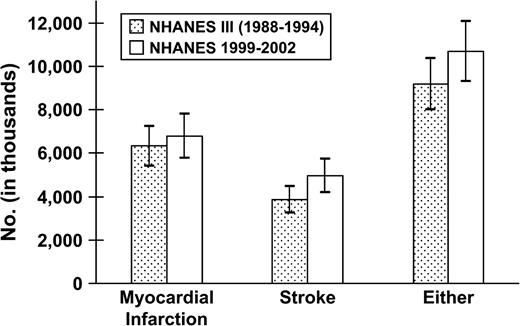
Estimated number of persons with a history of myocardial infarction, stroke, or either in the United States during 1988–1994 (Third National Health and Nutrition Examination Survey (NHANES III)) and 1999–2002 (NHANES 1999–2002). p = 0.033 comparing the prevalence of stroke between NHANES III and NHANES 1999–2002. Bars represent point estimates, and lines are 95% confidence intervals.
The age, gender, and race-ethnicity composition of persons with a history of myocardial infarction and stroke did not change significantly between 1988–1994 and 1999–2002 (table 3). The prevalence of cigarette smoking among myocardial infarction and stroke survivors was nonsignificantly lower in 1999–2002 than in 1988–1994. In contrast, the prevalence of overweight, obesity, and high LDL cholesterol increased significantly among persons with a history of myocardial infarction and stroke between 1988–1994 and 1999–2002. The prevalence of hypertension and diabetes mellitus did not change substantially between 1988–1994 and 1999–2002. The prevalence of high triglycerides declined, while the prevalence of abdominal obesity and impaired fasting glucose increased nonsignificantly. Overall, the prevalence of metabolic syndrome was 49.2 in 1999–2002 compared with 51.0 in 1988–1994 (p = 0.710).
NHANES III (1988–1994) | NHANES 1999–2002 | p value | ||||
|---|---|---|---|---|---|---|
| Demographic characteristics (mean or percentage (standard error)) | ||||||
| Age (years) | 66.0 (0.8) | 63.8 (0.9) | 0.068 | |||
| Gender: men (%) | 59.3 (2.2) | 57.0 (2.3) | 0.470 | |||
| Race-ethnicity (%) | ||||||
| Non-Hispanic White | 87.7 (1.8) | 85.7 (1.8) | 0.432 | |||
| Non-Hispanic Black | 9.9 (1.5) | 11.5 (1.8) | 0.495 | |||
| Mexican American | 2.4 (0.6) | 2.8 (0.6) | 0.637 | |||
| Cardiovascular disease risk factors (% (standard error)) | ||||||
| Current smoking | 30.6 (2.4) | 23.3 (3.1) | 0.063 | |||
| Overweight | 67.3 (2.5) | 78.1 (2.0) | <0.001 | |||
| Obese | 30.9 (2.7) | 42.1 (3.5) | 0.011 | |||
| Hypertension | 55.6 (2.8) | 60.1 (3.5) | 0.315 | |||
| High low density lipoprotein cholesterol | 79.3 (3.1) | 87.1 (2.5) | 0.050 | |||
| Diabetes mellitus | 21.1 (1.7) | 18.9 (2.2) | 0.429 | |||
| Components of the metabolic syndrome†(% (standard error)) | ||||||
| Abdominal obesity | 54.5 (2.7) | 60.3 (3.3) | 0.174 | |||
| Elevated blood pressure | 68.1 (2.8) | 69.7 (4.1) | 0.747 | |||
| Low high density lipoprotein cholesterol | 53.4 (2.9) | 51.7 (3.4) | 0.704 | |||
| High triglycerides | 57.2 (2.4) | 45.0 (4.1) | 0.010 | |||
| Impaired fasting glucose | 27.2 (2.1) | 34.5 (3.2) | 0.056 | |||
| Metabolic syndrome | 51.0 (2.6) | 49.2 (4.1) | 0.710 | |||
NHANES III, Third National Health and Nutrition Examination Survey; NHANES, National Health and Nutrition Examination Survey.
Metabolic syndrome and each of its components was defined by using the National Cholesterol Education Program's Adult Treatment Panel III guidelines (11).
NHANES III (1988–1994) | NHANES 1999–2002 | p value | ||||
|---|---|---|---|---|---|---|
| Demographic characteristics (mean or percentage (standard error)) | ||||||
| Age (years) | 66.0 (0.8) | 63.8 (0.9) | 0.068 | |||
| Gender: men (%) | 59.3 (2.2) | 57.0 (2.3) | 0.470 | |||
| Race-ethnicity (%) | ||||||
| Non-Hispanic White | 87.7 (1.8) | 85.7 (1.8) | 0.432 | |||
| Non-Hispanic Black | 9.9 (1.5) | 11.5 (1.8) | 0.495 | |||
| Mexican American | 2.4 (0.6) | 2.8 (0.6) | 0.637 | |||
| Cardiovascular disease risk factors (% (standard error)) | ||||||
| Current smoking | 30.6 (2.4) | 23.3 (3.1) | 0.063 | |||
| Overweight | 67.3 (2.5) | 78.1 (2.0) | <0.001 | |||
| Obese | 30.9 (2.7) | 42.1 (3.5) | 0.011 | |||
| Hypertension | 55.6 (2.8) | 60.1 (3.5) | 0.315 | |||
| High low density lipoprotein cholesterol | 79.3 (3.1) | 87.1 (2.5) | 0.050 | |||
| Diabetes mellitus | 21.1 (1.7) | 18.9 (2.2) | 0.429 | |||
| Components of the metabolic syndrome†(% (standard error)) | ||||||
| Abdominal obesity | 54.5 (2.7) | 60.3 (3.3) | 0.174 | |||
| Elevated blood pressure | 68.1 (2.8) | 69.7 (4.1) | 0.747 | |||
| Low high density lipoprotein cholesterol | 53.4 (2.9) | 51.7 (3.4) | 0.704 | |||
| High triglycerides | 57.2 (2.4) | 45.0 (4.1) | 0.010 | |||
| Impaired fasting glucose | 27.2 (2.1) | 34.5 (3.2) | 0.056 | |||
| Metabolic syndrome | 51.0 (2.6) | 49.2 (4.1) | 0.710 | |||
NHANES III, Third National Health and Nutrition Examination Survey; NHANES, National Health and Nutrition Examination Survey.
Metabolic syndrome and each of its components was defined by using the National Cholesterol Education Program's Adult Treatment Panel III guidelines (11).
Awareness of hypertension among persons with a history of myocardial infarction and stroke declined from 87.8 percent in 1988–1994 to 84.5 percent in 1999–2002 (table 4; p = 0.264). In contrast, high LDL cholesterol awareness increased from 43.3 percent in 1988–1994 to 60.2 percent in 1999–2002 (p = 0.005). Among those aware of their diagnosis, hypertension treatment rates increased from 87.7 percent to 91.4 percent (p = 0.375). Between 1988–1994 and 1999–2002, treatment of high LDL cholesterol increased from 33.1 percent to 78.4 percent (p < 0.001) and treatment of diabetes mellitus from 80.0 percent to 93.6 percent (p = 0.009). Achievement of blood pressure control increased between 1988–1994 and 1999–2002 from 48.9 percent to 59.3 percent among treated hypertensives (p = 0.049) and from 37.9 percent to 46.5 percent among all hypertensives (p = 0.089). High LDL cholesterol control increased between 1988–1994 and 1999–2002 from 5.1 percent to 33.1 percent among treated patients and from 1.0 percent to 15.5 percent among all patients with high LDL cholesterol (each p < 0.001). In contrast, glycemic control among treated and all persons with diabetes mellitus was lower in 1999–2002 (33.2 percent and 36.0 percent, respectively; p = 0.196) compared with 1988–1994 (45.0 percent and 51.9 percent, respectively; p = 0.066).
Age-standardized† prevalence (% (standard error)) of hypertension, high low density lipoprotein cholesterol, and diabetes mellitus awareness, treatment, and control among patients with a history of myocardial infarction and stroke in the United States during 1988–1994 (NHANES III‡) and 1999–2002 (NHANES 1999–2002)
Awareness§ | Treatment¶ | Control# | Control§ | |
|---|---|---|---|---|
| Hypertension | ||||
| NHANES III (1988–1994) | 87.8 (1.4) | 87.7 (3.0) | 48.9 (4.2) | 37.9 (4.1) |
| NHANES 1999–2002 | 84.5 (2.6) | 91.4 (2.2) | 59.3 (3.2)* | 46.5 (3.1) |
| High low density lipoprotein cholesterol | ||||
| NHANES III (1988–1994) | 43.3 (4.9) | 33.1 (5.9) | 5.1 (4.6)†† | 1.0 (1.0)†† |
| NHANES 1999–2002 | 60.2 (3.6)** | 78.4 (4.8)*** | 33.1 (6.6)*** | 15.5 (3.1)*** |
| Diabetes mellitus | ||||
| NHANES III (1988–1994) | N/A‡ | 80.0 (4.7) | 45.0 (6.2) | 51.9 (5.8) |
| NHANES 1999–2002 | N/A | 93.6 (2.2)** | 33.2 (6.7) | 36.0 (6.4) |
p < 0.05; **p < 0.01; ***p < 0.001.
Standardized to the age distribution of the US population with a history of myocardial infarction and stroke from the National Health and Nutrition Examination Survey (NHANES) 1999–2002.
NHANES III, Third National Health and Nutrition Examination Survey; N/A, not applicable (the definition of diabetes mellitus was based on self-report of a previous diagnosis).
Among patients with a history of heart attack and stroke with hypertension, high cholesterol, and diabetes mellitus.
Among patients with a history of heart attack and stroke aware of their diagnosis of hypertension and high low density lipoprotein cholesterol and of diabetes mellitus.
Among patients with a history of heart attack and stroke receiving treatment for hypertension, high low density lipoprotein cholesterol, and diabetes mellitus.
Estimate may be unstable because of a small number of NHANES participants achieving control.
Only minor differences in hypertension and in diabetes awareness, treatment, and control were noted across subgroups defined by race-ethnicity and sex. Hypertension awareness was significantly higher but control rates lower among non-Hispanic Blacks (95.5 percent and 37.5 percent, respectively) compared with non-Hispanic Whites (80.2 percent and 69.2 percent, respectively; each p < 0.001 comparing non-Hispanic Blacks and Whites). Hypertension awareness was higher among women (92.6 percent) compared with men (80.0 percent; p < 0.001), although hypertension control rates were higher among men (68.7 percent) compared with women (43.0 percent; p < 0.001). No differences in diabetes awareness, treatment, and control were noted across subgroups defined by race-ethnicity and sex. Too few persons with a history of myocardial infraction and stroke had valid LDL cholesterol measurements to assess high LDL cholesterol awareness, treatment, and control stratified by gender and race-ethnicity.
Figure 2 shows the age-adjusted prevalence of no, one, two, and three or more uncontrolled risk factors (cigarette smoking, obesity, uncontrolled hypertension, high LDL cholesterol, and diabetes mellitus) among persons with a history of myocardial infraction and stroke in 1988–1994 and 1999–2002. The age-adjusted percentage of this population with no uncontrolled risk factors increased from 3.0 percent to 10.6 percent between 1988–1994 and 1999–2002 (p < 0.001). In contrast, the percentage of persons with two uncontrolled risk factors was lower in 1999–2002 than in 1988–1994 (p = 0.015).
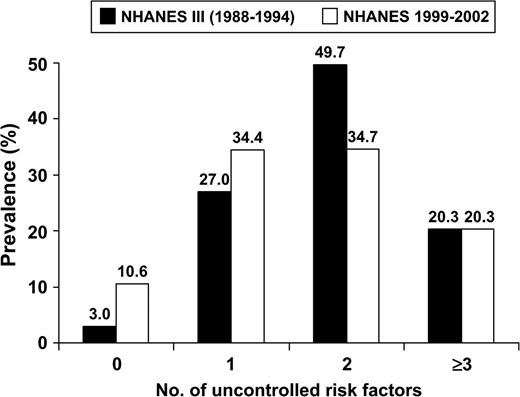
Age-standardized prevalence of 0, 1, 2, and ≥3 uncontrolled cardiovascular disease risk factors among persons with a history of myocardial infarction and stroke in the United States during 1988–1994 (Third National Health and Nutrition Examination Survey (NHANES III)) and 1999–2002 (NHANES 1999–2002). Uncontrolled risk factors: 1) hypertension (systolic blood pressure ≥140 mmHg or diastolic blood pressure ≥90 mmHg), 2) diabetes (glycated hemoglobin ≥7.0%), 3) high low density lipoprotein cholesterol (≥100 mg/dl), 4) obesity (body mass index ≥30 kg/m2), and 5) current cigarette smoking. p < 0.001 comparing the prevalence of zero risk factors in NHANES III and NHANES 1999–2002. Prevalence was standardized to the age distribution of the population in NHANES 1999–2002 with a history of myocardial infarction and stroke.
DISCUSSION
Over the past 10 years, a large body of clinical trial evidence has documented the benefits of treating and controlling hypertension, high LDL cholesterol, and diabetes mellitus. This evidence is reflected in statements and guidelines from the National Institutes of Health, American Diabetes Association, American Heart Association, and American College of Cardiology (12, 14–17). The current analysis documents a positive trend of increasing control of hypertension and awareness and control of high LDL cholesterol among myocardial infarction and stroke survivors, suggesting that the evidence from clinical trials is being translated into clinical practice.
Although mortality from CVD in the United States has declined over the past several decades, the population with a history of myocardial infarction and stroke has increased substantially (18–21). The current study documents an increase of 454,000 and 1.1 million myocardial infarction and stroke survivors, respectively, in the United States between 1988–1994 and 1999–2002. It is interesting to note that this increase occurred in the setting of an age-adjusted prevalence of stroke and myocardial infarction that did not change substantially between 1988–1994 and 1999–2002. As such, the increase in the number of persons with a history of myocardial infarction and stroke appears to be due to the increased size and aging of the US population. Reducing morbidity and mortality in this large and growing segment of the US population should be a key priority for the health-care community.
Convincing evidence has demonstrated that reductions in blood pressure decrease morbidity and mortality from coronary heart disease and stroke (14, 22–24). For example, in a meta-analysis of secondary prevention in persons with a history of CVD, beta blockers were estimated to result in 9- and 5-mmHg reductions in systolic and diastolic blood pressures, respectively (25). The summary relative risk comparing beta blockers with placebo was 0.78 for both fatal and nonfatal ischemic heart disease. The benefits of antihypertensive therapy are not limited to beta blockers; meta-analyses comparing angiotensin-converting enzyme inhibitors and calcium-channel blockers with placebos have reported these treatments to be associated with 19 percent and 21 percent reductions in reinfarction, respectively (25). In a separate meta-analysis of secondary prevention limited to participants with a history of stroke or transient ischemic attack, the rates of coronary heart disease and stroke incidence for persons randomly assigned to receive low-dose diuretics versus placebo were reduced 21 percent and 24 percent, respectively (26). Among the high-risk population of myocardial infarction and stroke survivors in the current study, hypertension awareness and treatment was substantially higher, 84.5 percent and 91.4 percent, respectively, than awareness and treatment rates, 68.9 percent and 58.4 percent, respectively, reported previously for the general population. Furthermore, hypertension control rates were higher for both treated (59.3 percent) and all hypertensives (46.5 percent) with a history of myocardial infarction and stroke compared with the general US population of treated (53.1 percent) and all hypertensives (31.0 percent) (27).
Several large, randomized controlled trials published during the 1990s provided irrefutable evidence of the benefits of hepatic hydroxymethylglutaryl coenzyme A reductase inhibitors (statin) therapy in lowering the risk of coronary heart disease (28–31). In a recent prospective meta-analysis including 14 randomized controlled trials, a 22 percent (95 percent confidence interval: 16 percent, 26 percent) risk reduction in the incidence of major coronary events was observed for participants with established CVD randomly assigned to statin therapy compared with their counterparts randomly assigned to placebo (32). On the basis of these findings, the National Cholesterol Education Program of the National Heart, Lung, and Blood Institute issued guidelines in 1995 and 2001 recommending the use of hepatic hydroxymethylglutaryl coenzyme A reductase inhibitors to lower LDL cholesterol levels to <100 mg/dl in patients with clinical CVD (12, 33). More recently, high-dose versus moderate-dose statin therapy, aimed at lowering LDL cholesterol to <70 mg/dl in patients with coronary disease was shown to result in a 16 percent (95 percent confidence interval: 5 percent, 26 percent) reduction in the risk of the composite endpoint of death from any cause, myocardial infarction, documented unstable angina requiring rehospitalization, revascularization (performed at least 30 days after randomization), or stroke (34). Data from the general US population for 1999–2000 indicate low rates of high total cholesterol awareness (35.0 percent), treatment (12.0 percent), and control (5.4 percent) (35). In the current study of myocardial infarction and stroke survivors, the rates of awareness, treatment, and control of high LDL cholesterol were 60.2 percent, 78.4 percent, and 33.1 percent, respectively. The remarkable increase in high cholesterol awareness, use of pharmacotherapy, and high-cholesterol control in the context of patients with CVD should be considered a major achievement.
In 1995, the American Diabetes Association recommended that patients with diabetes mellitus maintain a glycated hemoglobin level of <7.0 percent (36). A recent meta-analysis of observational studies showed that lower glycated hemoglobin levels are associated with a lower CVD risk (37). However, the benefits of pharmacologic treatment from randomized controlled trials are less convincing, with little data available from studies including patients with established CVD (38). In one study, the Diabetes Mellitus Insulin-Glucose Infusion in Acute Myocardial Infarction (DIGAMI) trial, patients with diabetes mellitus were randomly assigned to receive an insulin-glucose infusion during the initial 24 hours of hospitalization for myocardial infarction followed by subcutaneous insulin four times daily for a minimum of 3 months or to a usual-care control group (39). The net decline in glycated hemoglobin level was only 0.3 percent greater in the treatment compared with the control group. Although myocardial infarction rates were not lower in the treatment, compared with the control, group (relative risk = 0.99, 95 percent confidence interval: 0.68, 1.44), the risk of cardiovascular mortality was reduced by 53 percent (relative risk = 0.47, 95 percent confidence interval: 0.24, 0.92). However, a follow-up study did not support this intensive treatment (40). Despite the dearth of evidence from randomized controlled trials, given the large body of epidemiologic data, tight glycemic control remains a recommendation for the primary and secondary prevention of CVD. The diabetes mellitus control rates were low in the current study, with only 36.0 percent of patients with diabetes mellitus achieving the recommended glycemic levels. In addition, a potentially important decline in glycemic control rates occurred between 1988–1994 and 1999–2002.
Findings in the current study must be considered within the context of the study's limitations. First, the prevalence of CVD may be overestimated because history of myocardial infarction and stroke was based on self-report. However, because hypertension, high cholesterol, and diabetes awareness, treatment, and control rates are lower in the general population, such misclassification, if present, indicates that rates of awareness, treatment, and control among persons with established CVD may be even higher than we report. Second, the number of participants with a history of myocardial infarction and stroke in NHANES 1999–2002 was limited. We pooled the experience in these groups for the analyses of awareness, treatment, and control of hypertension, high LDL cholesterol, and diabetes mellitus. After pooling data on these groups, the available sample size satisfied the NHANES analytic guidelines of 20 or more participants in each cell, except for the prevalence estimates for myocardial infarction and stroke survivors less than 40 years of age (41). Finally, we relied on self-report to define diabetes. The impact of this decision is underestimation of the prevalence of diabetes among myocardial infarction/stroke survivors because undiagnosed diabetes cases were categorized as nondiabetic. In contrast, using self-report to define diabetes may have resulted in overestimation of the percentage of patients receiving treatment and controlling their diabetes. Nonetheless, there is little reason to suspect that these effects are different for NHANES III and NHANES 1999–2002.
The current study documents that an increased US population size has resulted in a large increase in the number of myocardial infarction and stroke survivors—from 9.2 million in 1988–1994 to 10.7 million in 1999–2002. In addition to improvements in hypertension control, substantial increases in the treatment and control of high LDL cholesterol were observed over this same time period. Despite these improvements, only 10.6 percent of US adults with a history of myocardial infarction and stroke have achieved control of their risk factors. Continued updating and intensive dissemination of evidence-based guidelines for the prevention, awareness, treatment, and control of risk factors in the context of patients with CVD are warranted as part of efforts aimed at delaying morbidity and mortality.
Conflict of interest: none declared.
References
Jemal A, Ward E, Hao Y, et al. Trends in the leading causes of death in the United States, 1970–2002.
Ergin A, Muntner P, Sherwin R, et al. Secular trends in cardiovascular disease mortality, incidence, and case fatality rates in adults in the United States.
Goldberg RJ. Monitoring trends in severity of acute myocardial infarction: challenges for the next millennium.
McBride P, Schrott HG, Plane MB, et al. Primary care practice adherence to National Cholesterol Education Program guidelines for patients with coronary heart disease.
Schrott HG, Bittner V, Vittinghoff E, et al. Adherence to National Cholesterol Education Program treatment goals in postmenopausal women with heart disease. The Heart and Estrogen/Progestin Replacement Study (HERS). The HERS Research Group.
Qureshi AI, Suri MF, Guterman LR, et al. Ineffective secondary prevention in survivors of cardiovascular events in the US population: report from the Third National Health and Nutrition Examination Survey.
Khot UN, Khot MB, Bajzer CT, et al. Prevalence of conventional risk factors in patients with coronary heart disease.
National Center for Health Statistics. Plan and operation of the Third National Health and Nutrition Examination Survey,
National Center for Health Statistics. NHANES current data files. Available at http://www.cdc.gov/nchs/about/major/nhanes/nhanes99-02.htm. Accessed September 7,
Perloff D, Grim CE, Flack JM, et al. Human blood pressure determination by sphygmomanometry.
Friedewald WT, Levy RI, Fredrickson DS. Estimation of the concentration of low-density lipoprotein cholesterol in plasma, without use of the preparative ultracentrifuge.
Expert Panel on Detection, Evaluation, and Treatment of High Blood Cholesterol in Adults. Executive Summary of The Third Report of The National Cholesterol Education Program (NCEP) Expert Panel on Detection, Evaluation, and Treatment of High Blood Cholesterol in Adults (Adult Treatment Panel III).
Chobanian AV, Bakris GL, Black HR, et al. The Seventh Report of the Joint National Committee on Prevention, Detection, Evaluation, and Treatment of High Blood Pressure: the JNC 7 report.
Expert Committee on the Diagnosis and Classification of Diabetes Mellitus. American Diabetes Association: clinical practice recommendations 2002.
Smith SC Jr, Blair SN, Criqui MH, et al. AHA consensus panel statement. Preventing heart attack and death in patients with coronary disease. The Secondary Prevention Panel.
Smith SC Jr, Blair SN, Bonow RO, et al. AHA/ACC scientific statement: AHA/ACC guidelines for preventing heart attack and death in patients with atherosclerotic cardiovascular disease: 2001 update: a statement for healthcare professionals from the American Heart Association and the American College of Cardiology.
Muntner P, Garrett E, Klag MJ, et al. Trends in stroke prevalence between 1973 and 1991 in the US population 25 to 74 years of age.
Muntner P, Coresh J, Powe NR, et al. The contribution of increased diabetes prevalence and improved myocardial infarction and stroke survival to the increase in treated end-stage renal disease.
Kovar MG, Pokras R, Collins JG. Trends in medical care and survival from stroke.
Ford ES, Giles WH, Croft JB. Prevalence of nonfatal coronary heart disease among American adults.
Effects of treatment on morbidity in hypertension: results in patients with diastolic blood pressures averaging 115 through 129 mmHg.
Prevention of stroke by antihypertensive drug treatment in older persons with isolated systolic hypertension. Final results of the Systolic Hypertension in the Elderly Program (SHEP). SHEP Cooperative Research Group.
Herbert P, Moser M, Mayer J, et al. Recent evidence on drug therapy of mild to moderate hypertension and decreased risk of coronary heart disease.
Law M, Wald N, Morris J. Lowering blood pressure to prevent myocardial infarction and stroke: a new preventive strategy.
Rashid P, Leonardi-Bee J, Bath P. Blood pressure reduction and secondary prevention of stroke and other vascular events: a systematic review.
Hajjar IM, Kotchen TA. Trends in prevalence, awareness, treatment, and control of hypertension in the United States, 1988–2000.
Randomised trial of cholesterol lowering in 4444 patients with coronary heart disease: the Scandinavian Simvastatin Survival Study (4S).
Prevention of cardiovascular events and death with pravastatin in patients with coronary heart disease and a broad range of initial cholesterol levels. The Long-Term Intervention with Pravastatin in Ischaemic Disease (LIPID) Study Group.
Sacks FM, Pfeffer MA, Moye LA, et al. The effect of pravastatin on coronary events after myocardial infarction in patients with average cholesterol levels. Cholesterol and Recurrent Events Trial investigators.
Downs JR, Clearfield M, Weis S, et al. Primary prevention of acute coronary events with lovastatin in men and women with average cholesterol levels: results of AFCAPS/TexCAPS. Air Force/Texas Coronary Atherosclerosis Prevention Study.
Baigent C, Keech A, Kearney PM, et al. Efficacy and safety of cholesterol-lowering treatment: prospective meta-analysis of data from 90,056 participants in 14 randomised trials of statins.
Summary of the second report of the National Cholesterol Education Program (NCEP) Expert Panel on Detection, Evaluation, and Treatment of High Blood Cholesterol in Adults (Adult Treatment Panel II).
Cannon CP, Braunwald E, McCabe CH, et al. Intensive versus moderate lipid lowering with statins after acute coronary syndromes.
Ford ES, Mokdad AH, Giles WH, et al. Serum total cholesterol concentrations and awareness, treatment, and control of hypercholesterolemia among US adults: findings from the National Health and Nutrition Examination Survey, 1999 to 2000.
Harris MI. Diabetes in America. National Diabetes Data Group. Bethesda, MD: National Institutes of Health,
Selvin E, Marinopoulos S, Berkenblit G, et al. Meta-analysis: glycosylated hemoglobin and cardiovascular disease in diabetes mellitus.
Huang ES, Meigs JB, Singer DE. The effect of interventions to prevent cardiovascular disease in patients with type 2 diabetes mellitus.
Malmberg K, Ryden L, Hamsten A, et al. Effects of insulin treatment on cause-specific one-year mortality and morbidity in diabetic patients with acute myocardial infarction. DIGAMI Study Group. Diabetes Insulin-Glucose in Acute Myocardial Infarction.
Malmberg K, Ryden L, Wedel H, et al. Intense metabolic control by means of insulin in patients with diabetes mellitus and acute myocardial infarction (DIGAMI 2): effects on mortality and morbidity.
NHANES

