


Abstract
Arsenic exposure is a likely cause of blackfoot disease and a potential risk factor for atherosclerosis. The authors performed a systematic review of the epidemiologic evidence on the association between arsenic and cardiovascular outcomes. The search period was January 1966 through April 2005. Thirteen studies conducted in general populations (eight in high-arsenic areas in Taiwan, five in other countries) and 16 studies conducted in occupational populations were identified. Exposure was assessed ecologically in most studies. In Taiwan, relative risks comparing the highest arsenic exposure category with the lowest ranged from 1.59 to 4.90 for coronary disease, from 1.19 to 2.69 for stroke, and from 1.66 to 4.28 for peripheral arterial disease. In other general populations, relative risks ranged from 0.84 to 1.54 for coronary disease, from 0.69 to 1.53 for stroke, and from 0.61 to 1.58 for peripheral arterial disease. In occupational populations, relative risks ranged from 0.40 to 2.14 for coronary disease mortality and from 0.30 to 1.33 for stroke mortality. Methodologic limitations, however, limited interpretation of the moderate-to-strong associations between high arsenic exposure and cardiovascular outcomes in Taiwan. In other populations or in occupational settings, the evidence was inconclusive. Because of the high prevalence of arsenic exposure, carefully performed studies of arsenic and cardiovascular outcomes should be a research priority.
INTRODUCTION
Cardiovascular disease is the leading cause of mortality worldwide (1). Atherosclerosis is the most common pathologic process underlying cardiovascular disease, and it often manifests clinically as coronary disease, stroke, or peripheral arterial disease. Environmental toxicants have been suggested to play a role in atherogenesis (2). In particular, long-term exposure to arsenic, a documented poison and carcinogen, has been implicated as a risk factor for cardiovascular disease (3, 4).
Arsenic is likely to cause blackfoot disease, a severe form of peripheral arterial disease in southwestern Taiwan that is characterized by thromboangiitis obliterans, severe arteriosclerosis, and high arsenic levels in the arterial wall (3, 5–7). While epidemiologic studies conducted in Taiwan support a role for high chronic arsenic exposure in atherosclerosis (8, 9), data on other populations are scarce and results are inconclusive (8, 9). Because of the limited quantity and quality of the epidemiologic evidence, the US Environmental Protection Agency considered cardiovascular outcomes only qualitatively in risk analyses to establish the maximum contaminant level of arsenic in drinking water (10). To our knowledge, no systematic reviews or meta-analyses have summarized the evidence on the relation between arsenic and cardiovascular disease.
Our objective was to perform a systematic review and a meta-analysis of the epidemiologic evidence on the association of arsenic with cardiovascular disease. Because of the substantial heterogeneity in and methodologic limitations of the available evidence, we present a qualitative systematic review without quantitative pooling of study results.
METHODS
Search strategy and study selection
We searched MEDLINE and TOXNET for epidemiologic studies investigating the relation of arsenic with cardiovascular disease by using free text and the following Medical Subject Headings: arsenic, arsenite, arsenate, arsenicals, atherosclerosis, cardiovascular disease, myocardial infarction, stroke, peripheral vascular disease, peripheral arterial disease, and mortality. The search period was January 1966 through April 2005. There were no language restrictions. In addition, we manually reviewed the reference lists from relevant original research and review articles, as well as the investigators' files.
We aimed to identify all studies assessing the relation between arsenic exposure determined using environmental measures (drinking water or airborne arsenic levels), biomarkers, or indirect measures (job titles or living in arseniasis-endemic areas) and clinical cardiovascular disease outcomes (including coronary disease, stroke, and peripheral arterial disease). Our exclusion criteria were: 1) publications containing no original research (reviews, editorials, nonresearch letters); 2) studies not carried out in humans (experimental studies); 3) case reports and case series; 4) studies lacking a clinical cardiovascular outcome (e.g., a study of subclinical atherosclerosis (11)); and 5) studies lacking data on arsenic exposure during adulthood (e.g., persons who had lived within 4 km of a smelter during childhood (12)) or studies of arsenic compounds for which human exposure is uncommon (e.g., lewisite (13)). Four case-control studies were excluded because cases and controls were selected on the basis of prior history of arsenic exposure (14–17). We also excluded a cohort of patients who had taken Fowler's solution (potassium arsenite) between 1945 and 1969 in Lancashire, England (18).
When several papers had been published on the same population, the publication with the longest follow-up period was selected; when follow-up periods were equivalent, we selected the study with the largest number of cases, the study using internal comparisons, or the most recent publication. Figure 1 summarizes the study selection process.
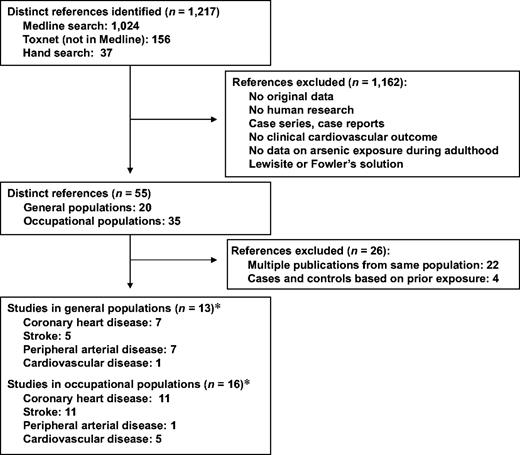
Selection process used in a systematic review of studies on the relation between arsenic and cardiovascular disease, 1966–2005. (*Categories under the main headings do not total 13 and 16, respectively, because a single study may have included more than one cardiovascular disease outcome.)
In nonoccupational populations, arsenic exposure occurs mainly through drinking water, while in occupational settings, exposure usually occurs via inhalation. In addition to differences in the route of exposure, occupational studies usually also differ methodologically from nonoccupational studies. For this reason, we separated the analyses of studies conducted in general populations from those of studies conducted in occupational cohorts.
Data abstraction
Two investigators independently abstracted data from the articles that met the selection criteria. They resolved discrepancies by consensus. The following fatal and nonfatal cardiovascular outcomes were defined a priori: coronary disease (myocardial infarction and ischemic heart disease); stroke (cerebrovascular disease, ischemic and hemorrhagic stroke); and peripheral arterial disease (lower-extremity peripheral arterial disease, diseases of peripheral arteries, and blackfoot disease). We also included five occupational studies (19–23) and one general population study (24) that reported only total cardiovascular disease mortality.
To assess study quality, we adapted the criteria used by Longnecker et al. (25) for observational studies (figure 2).
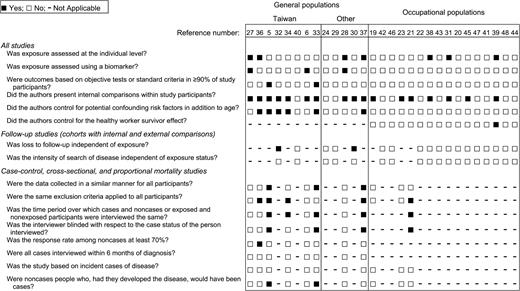
Quality criteria applied and evaluation of the design and data analysis used in epidemiologic studies on the relation between arsenic and cardiovascular disease, 1966–2005. For reference numbers, see reference list in text.
Statistical analysis
Measures of association (odds ratios, prevalence ratios, standardized mortality ratios, relative risks, relative hazards, comparisons of means) and their standard errors were abstracted or were derived using data reported in the publications (26). Adjustment did not substantially modify the conclusions of individual studies. In the studies by Lin and Yang (27) and Ruiz-Navarro et al. (28), we used the linear discriminant function method to estimate relative risks from mean arsenic levels in cases and noncases (26). In the studies by Varsanyi et al. (24), Engel and Smith (29), Lewis et al. (30), and Xuan et al. (31), we estimated the within-cohort relative risks by comparing standardized mortality ratios in the highest category of exposure with those in the lowest.
Because drinking water arsenic levels were much higher in studies carried out in Taiwan than in other studies, we present data from Taiwan separately from data from other countries. For descriptive purposes, we report the range of relative risk estimates and the unweighted median values. For studies carried out in general populations (5, 14, 29, 30, 32–37) or occupational populations (38, 39) with published results for at least three exposure categories, we graphically present the dose-response trend in relative terms. A dose-response meta-analysis was considered inappropriate because of the heterogeneity in and methodologic limitations of the available studies.
STUDIES IN GENERAL POPULATIONS
Study characteristics
Thirteen studies conducted in general populations (figure 1 and table 1) met our inclusion criteria. Eight studies were from Taiwan, three were from the United States, one was from Hungary, and one was from Spain. Of the cohort studies, two studies used internal comparisons (30, 32) and three used external comparisons (24, 29, 40). The remaining studies used cross-sectional (5, 33, 34, 37) or case-control (6, 27, 28, 36) designs. Studies ascertaining coronary disease used death certificates (29, 30, 32, 40), electrocardiographic criteria (33), and self-reported bypass surgery, angina, or heart attack (37). In one study, the diagnostic criteria for myocardial infarction were not specified (28). Studies ascertaining stroke used death certificates (29, 30, 40), self-reported stroke followed by review of medical records (34), or self-reported stroke exclusively (37). Studies ascertaining peripheral arterial disease used criteria for blackfoot disease (6, 27, 36), death certificates (29, 30, 40), or the ankle-brachial blood pressure index (5). One study ascertained total cardiovascular disease mortality (24).
Studies of arsenic exposure and cardiovascular outcomes in general populations
Location and study (authors, year, and ref. no.) | Design | Population | % men | Age range (years) | Arsenic assessment | Comparison (exposed vs. reference) | Endpoint ascertainment | Outcome(s) studied | No. of cases | No. of noncases | Relative risk | 95% confidence interval | Factors adjusted for |
|---|---|---|---|---|---|---|---|---|---|---|---|---|---|
| Taiwan | |||||||||||||
| Lin and Yang, 1988 (27) | Case-control | HAA* | NR* | NR | Urine (hydride AAS*) | 75th percentile vs. 25th percentile | NR | BFD* prevalence | 20 | 20 | 1.66 | 0.78, 3.51 | Age, sex |
| Chen et al., 1988 (36) | Case-control | HAA | 49 | <50–≥60 | Years of well-water consumption | ≥30 years vs. 0 years | Clinical examination | BFD prevalence | 241 | 759 | 3.47 | 2.20, 5.48 | Age, sex, diet, family history of BFD |
| Tseng et al., 1996 (5) | Cross-sectional | HAA | 45 | Mean = 53 | CEI*,† from village drinking water | ≥20 mg/liter- year vs. 0 mg/liter- year | Ankle- brachial blood pressure index | PAD* prevalence | 69 | 513 | 4.28 | 1.26, 14.5 | Age, sex, smoking, BMI,* lipids, hypertension, DM* |
| Chen et al., 1996 (32) | Cohort (internal comparisons) | HAA | 52 | 40−≥70 | CEI from village drinking water | ≥20 mg/liter- year vs. 0 mg/liter- year | Death certificate | CHD* mortality | 39 | 2,517 | 4.90 | 1.36, 17.7 | Age, sex, smoking, BFD, BMI, lipids, hypertension, DM |
| Chiou et al., 1997 (34) | Cross-sectional | HAA | 50 | 40−≥70 | CEI from village drinking water | ≥5 mg/liter- year vs. <0.1 mg/liter- year | Self-report + medical records | Stroke prevalence | 139 | 7,963 | 2.69 | 1.35, 5.38 | Age, sex, smoking, alcohol, hypertension, DM |
| Wu et al., 1989 (35); Tsai et al., 1999 (40) | Cohort (external comparisons) | HAA | 35 | All ages | Village drinking water level | HAA vs. general population | Death certificate | CHD mortality | 728 deaths | 1.59 | 1.32, 1.93 | Age, sex | |
| Stroke mortality | 2,638 deaths | 1.19 | 1.10, 1.29 | ||||||||||
| PAD mortality | 175 deaths | 2.88 | 1.88, 4.42 | ||||||||||
| Wang and Chang, 2001 (6) | Case-control | HAA | 67 | Mean = 63 | Arterial tissue (AAS) | 75th percentile vs. 25th percentile | Surgery | BFD prevalence | 31 | 30 | 2.40 | 2.00, 2.89 | (Crude) |
| Tseng et al., 2003 (33) | Cross-sectional | HAA | 44 | 30–≥60 | CEI from village drinking water | ≥15 mg/liter- year vs. 0 mg/liter- year | Electrocardio gram | CHD prevalence | 78 | 384 | 3.60 | 1.11, 11.7 | Age, sex, smoking, BMI, lipids, hypertension, DM |
| Other countries | |||||||||||||
| Varsanyi et al., 1991 (24) | Cohort (external comparisons) | 12 villages (Hungary) | 49 | All ages | Village drinking water level | >50 μg/liter vs. <40 μg/liter | Death certificate | Cardiovascular disease mortality | NR | NR | Men: 1.19 | Age | |
| Women: 0.82 | |||||||||||||
| Engel and Smith, 1994 (29) | Cohort (external comparisons) | 30 counties (United States) | 43 | 0−≥65 | County drinking water level | >20 μg/liter vs. 5–10 μg/liter | Death certificate | CHD mortality | 63,831 | ∼1.7 million | 0.84 | 0.76, 0.93 | Age, sex |
| Stroke mortality | 20,963 | ∼1.7 million | 0.91 | 0.74. 1.10 | |||||||||
| PAD mortality | 7,203 | ∼1.7 million | 1.58 | 1.34, 1.88 | |||||||||
| Ruiz-Navarro et al., 1998 (28) | Case-control | Hospital- based (Spain) | 39 | NR | Urinary levels | 75th percentile vs. 25th percentile | NR | Myocardial infarction prevalence | 29 | 49 | 0.97 | 0.50, 1.89 | (Crude) |
| Lewis et al., 1999 (30) | Cohort (internal comparisons) | Mormons (United States) | 52 | >1 | CEI from community drinking water | ≥5 mg/liter- year vs. <1 mg/liter- year | Death certificate | CHD mortality | 411 | 3,647 | 0.86 | 0.68, 1.10 | Age, sex |
| Stroke mortality | 176 | 3,882 | 0.69 | 0.47, 0.99 | |||||||||
| PAD mortality | 47 | 4,011 | 0.61 | 0.28, 1.31 | |||||||||
| Zierold et al., 2004 (37) | Cross-sectional | Survey participants with private wells (United States) | NR | Mean = 62 | Subject drinking water level | >10 μg/liter vs. <2 μg/liter | Self-report | CHD prevalence | 128 | 1,057 | 1.54 | 0.90, 2.68 | Age, sex, smoking, BMI |
| Stroke prevalence | 31 | 1,154 | 1.53 | 0.60, 4.07 |
HAA, high-arsenic area; NR, not reported; AAS, atomic absorption spectrometry; BFD, blackfoot disease; CEI, cumulative exposure index; PAD, peripheral arterial disease; BMI, body mass index; DM, diabetes mellitus; CHD, coronary heart disease.
Cumulative exposure index = Σ arsenic level in drinking water × time of exposure (i = specific village).
Arsenic exposure was assigned on the basis of drinking water levels in most general population studies. Four studies from Taiwan (5, 32–34) and one study from the United States (30) created a cumulative arsenic exposure index (mg/liter-year) by multiplying the number of years of living in a specific village/area by the average arsenic level in drinking water in that village/area (usually measured at a single point in time). Other studies conducted in Taiwan assigned exposure on the basis of residence in an area with high arsenic levels in water (40) or number of years of drinking artesian well water (36). Three studies used village (24), county (29), or individual (37) drinking water arsenic levels. Only three studies used biomarkers of exposure: Two of them measured total urinary arsenic (27, 28) and the third measured arsenic in arterial tissue (6).
Quality assessment
Most of the 13 general population studies failed to fulfill important quality criteria (figure 2). Only four studies carried out in general populations assessed arsenic exposure at the individual level, and only three studies used biomarkers. Thus, arsenic exposure in most of these studies was based on geographic or other grouped or ecologic measurements. Furthermore, only two studies used standard criteria to diagnose cardiovascular disease, and only six studies had information on established cardiovascular disease risk factors.
For cohort studies, losses to follow-up were clearly independent of exposure in only two studies, and in no study was the intensity of the search for disease clearly independent of exposure status. For case-control and cross-sectional studies, data were collected in a similar manner in all study participants, with interviewers blinded to the case or exposure status of the participants in only three studies. Because of the lack of objective criteria, in only two studies was it possible to be certain that noncases would have been classified as cases if they had developed the disease. Finally, none of the case-control studies were based on incident cases of disease.
Relative risk estimates
The relative risk estimates comparing the highest category of exposure with the lowest in each individual study for different cardiovascular outcomes are shown in table 1. Relative risks were higher in studies conducted in Taiwan than in studies conducted in other countries. In Taiwan, relative risks ranged from 1.59 to 4.90 (median, 3.60) for coronary disease, from 1.19 to 2.69 (median, 1.94) for stroke, and from 1.66 to 4.28 (median, 2.40) for peripheral arterial disease. In studies conducted outside of Taiwan, the ranges of relative risk estimates for coronary disease, stroke, and peripheral arterial disease were 0.84–1.54 (median, 0.92), 0.69–1.53 (median, 0.91), and 0.61–1.58 (median, 1.10), respectively.
Figure 3 presents the relative risk estimates for studies reporting results for three or more categories of arsenic exposure. The risks of coronary disease, stroke, and peripheral arterial disease generally increased with increasing exposure in studies from Taiwan (32–35). Risk trends in studies from the United States were inconsistent.
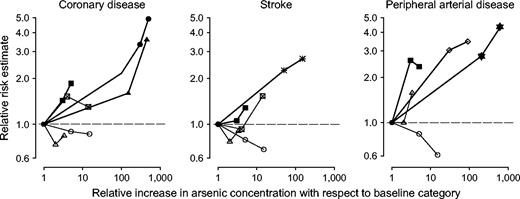
Dose-response relations between arsenic exposure in drinking water and cardiovascular disease outcomes in general population studies. The thick lines represent studies conducted in Taiwan (▪ Wu et al., 1989 (35); • Chen et al., 1996 (32); ▴ Tseng et al., 2003 (33);  Chiou et al., 1997 (34); ⋄ Chen et al., 1988 (36);
  Tseng et al., 1996 (5)). The thin lines represent studies conducted in the United States (△ Engel and Smith, 1994 (29); ○ Lewis et al., 1999 (3); ⊠ Zierold et al., 2004 (37)). The reference categories were as follows: Wu et al., 1989 (35): <300 μg/liter; Chen et al., 1996 (32), Tseng et al., 2003 (33), and Tseng et al., 1996 (5): 0 mg/liter-year; Chiou et al., 1997 (34): <0.1 mg/liter-year; Chen et al., 1988 (36): 0 years of well-water consumption; Engel and Smith, 1994 (29): 5–10 μg/liter; Lewis et al., 1999 (30): <1 mg/liter-year; Zierold et al., 2004 (37): <2 μg/liter.
STUDIES IN OCCUPATIONAL POPULATIONS
Study characteristics
Sixteen studies carried out in occupational populations (figure 1 and table 2) met our inclusion criteria. The studies were conducted in copper smelters in the United States (39, 41), Japan (42), and Sweden (38); in mines and refineries in Japan (43), China (31), France (20), and the United Kingdom (44); in a power plant in the Czech Republic (23); in pesticide/insecticide industries in the United States (22, 45, 46); in a factory handling inorganic arsenic in the United Kingdom (19); and in the glass industry in Sweden (21) and Italy (47). In the mine/refinery study carried out in Japan (43), residents were also included because of evidence that arsenic contamination of soil, ambient air, and water had existed for at least 28 years. Similarly, the study by Nakadaira et al. (48) included mostly residents living close to a dye factory that had contaminated drinking water for 5 years (1954–1959) with arsenic levels of 3,000 μg/liter (48).
Studies of arsenic exposure and cardiovascular disease mortality in occupational populations
Study (authors, year, and ref. no.) | Country | Design (type of comparison) | Occupational population | % men | Age range (years) | Arsenic assessment (compound(s)) | Comparison (exposed vs. reference) | Mortality outcome(s) studied | No. of cases | Duration of follow-up (years) | Age-adjusted relative risk | 95% confidence interval |
|---|---|---|---|---|---|---|---|---|---|---|---|---|
| Bradford Hill and Faning, 1948 (19) | United Kingdom | Proportional mortality | Factory with inorganic arsenic | 100 | >20 at death | Job title (inorganic arsenic) | Workers vs. other workers | CVD* | 393 | 33 | 0.73 | 0.45, 1.19† |
| Tokudome and Kuratsune, 1976 (42) | Japan | Cohort (external) | Copper smelter, Ooita | 100 | 42–76 at death | Job title (NS*) | Workers vs. general population | CHD* | 7 | 22 | 0.47 | 0.22, 0.99 |
| Stroke | 26 | 0.76 | 0.52, 1.12 | |||||||||
| Mabuchi et al., 1980 (46) | United States | Cohort (external) | Pesticide manufacturer, Maryland | 75 | <20–≥40 at time of hiring | Job title (lead arsenate, arsenic trioxide, sodium arsenite) | Workers vs. general population | CHD | 76 | 31 | 0.90 | 0.72, 1.13 |
| Stroke | 15 | 1.33 | 0.80, 2.21 | |||||||||
| Bencko et al., 1980 (23) | Czech Republic | Proportional mortality | Coal- burning power plant | 100 | 30–80 at death | Job title (NS) | Workers vs. other workers | CVD | 101 | 18 | 0.88 | 0.58, 1.33† |
| Wingren and Axelson, 1987 (21) | Sweden | Case-control | Glass industry area | 100 | 45–≥75 at death | Job title (NS) | Workers vs. general population | CVD | 2,029 | 32 | 1.20 | 1.10, 1.40 |
| Sobel et al., 1988 (22) | United States | Cohort (external) | Insecticide manufacturer, Michigan | 100 | NR* | Job title (lead arsenate, calcium arsenate, magnesium arsenate, copper acetoarsenite) | Workers vs. general population | CVD | 96 | 8 | 0.80 | 0.65, 0.98 |
| Jarup et al., 1989 (38) | Sweden | Cohort (internal) | Copper smelter, Ronskar | 100 | <20–≥80 at death | CEI*,‡ (μg/m3-year) with air monitoring and employee work history (NS) | >100 mg/m3-year vs. <0.25 mg/ m3-year | CHD | 437 | 39 | 1.12 | 0.72, 1.74 |
| Stroke | 123 | 0.64 | 0.24, 1.71 | |||||||||
| Tsuda et al., 1990 (43) | Japan | Cohort (external) | Mine/refinery, Toruku (workers/ residents) | 50 | Mean = 61 | Compensated for arsenic poisoning (arsenic trioxide) | Workers vs. general population | CHD | 7 | 17 | 2.14 | 1.00, 4.37 |
| Stroke | 8 | 0.77 | 0.36, 1.53 | |||||||||
| Xuan et al., 1993 (31) | China | Cohort (internal) | Tin mine | 86 | Mean = 19 at time of hiring | CEI (mg/m3-year) with air monitoring (NS) | >75th percentile vs. <25th percentile | CHD | 47 | 11 | 0.40 | 0.17, 0.92 |
| Stroke | 302 | 0.30 | 0.15, 0.61 | |||||||||
| Simonato et al., 1994 (20) | France | Cohort (external) | Gold mine/ refinery | 100 | NR | Job title (NS) | Workers vs. general population | CVD | 43 | 32 | 0.54 | 0.39, 0.73 |
| Tollestrup et al., 1995 (45) | United States | Cohort (internal) | Orchard workers | 66 | 8–≥55 at time of hiring | Job title (lead arsenate) | Workers vs. general population | CHD | NR | 45 | 1.27 | 0.72, 2.23 |
| Stroke | NR; total N = 1,097 | 0.82 | 0.31, 2.12 | |||||||||
| Bartoli et al., 1998 (47) | Italy | Cohort (external) | Glass industry | 100 | <40–≥65 at death | Job title (NS) | Workers vs. general population | CHD | 53 | 35 | 0.67 | 0.53, 0.84 |
| Stroke | 41 | 0.77 | 0.58, 1.00 | |||||||||
| Lubin et al., 2000 (41) | United States | Cohort (external) | Copper smelter, Montana | 100 | <10–≥30 at time of hiring | Job title (arsenic trioxide) | Workers vs. general population | CHD | 1,574 | 32 | 1.05 | 0.99, 1.10 |
| Stroke | 335 | 1.03 | 0.93, 1.15 | |||||||||
| Hertz-Picciotto et al., 2000 (39) | United States | Cohort (internal) | Copper smelter, Tacoma, Washington | 100 | NR | CEI (μg/m3- year) with air monitoring and employee work history (arsenic trioxide) | >20 mg/m3- year vs. <0.75 mg/ m3-year | CHD | 394 | 36 | 1.50 | 0.95, 2.50§ |
| Stroke | 91 | 0.67 | 0.23, 1.90§ | |||||||||
| Peripheral arterial disease | 18 | 3.46 | 0.77, 15.5† | |||||||||
| Nakadaira et al., 2002 (48) | Japan | Cohort (external) | Dye factory (residents) | 45 | Mean = 30 | Living in a contaminated village (inorganic arsenic) | Residents vs. general population | CHD | 2 | 33 | 0.58 | 0.14, 2.31 |
| Stroke | 4 | 0.67 | 0.25, 1.78 | |||||||||
| Binks et al., 2005 (44) | United Kingdom | Cohort (external) | Tin smelter | 100 | 40–≥70 at death | Job title (NS) | Workers vs. general population | CHD | 104 | 34 | 0.83 | 0.68, 1.01 |
| Stroke | 32 | 1.07 | 0.73, 1.51 |
CVD, cardiovascular disease; NS, not specified; CHD, coronary heart disease; NR, not reported; CEI, cumulative exposure index.
Not adjusted for age.
Cumulative exposure index = Σ arsenic level in air × time of exposure (i = job title).
Adjusted for the healthy worker survivor effect.
All occupational studies reported only mortality data. The studies used death certificates to identify coronary and stroke deaths (11 studies), peripheral arterial disease deaths (one study), and overall cardiovascular disease mortality (five studies). Most occupational studies used external comparisons to derive standardized mortality ratios; the exceptions were one proportional mortality study (19), one case-control study (21), and four cohort studies with internal comparisons (31, 38, 39, 45). Exposure was ascertained mostly on the basis of job titles. Two studies assigned exposure on the basis of receipt of compensation for arsenic poisoning (43) and residence in a village with water contaminated by an industrial source (48). Several studies measured arsenic in urine or air to confirm exposure, but this information was not linked to cardiovascular outcomes (20, 22, 41, 45, 46). Only three studies created a cumulative exposure index (mg/m3-year) for each worker (31, 38, 39). Arsenic trioxide was the main chemical form of arsenic exposure in at least three studies (39, 41, 43), and it was also mentioned among other arsenicals in a fourth study (46).
Quality assessment
The occupational studies did not fulfill most of the prespecified quality criteria (figure 2). With the exception of four studies (31, 38, 39, 49), the reported effect estimates were based on age-adjusted standardized mortality ratios comparing the study sample with the general population. None of the studies adjusted for cardiovascular disease risk factors or other exposures. Only one study adjusted for the “healthy worker” survivor effect (39).
Relative risk estimates
Findings in the occupational studies were heterogeneous, with increased, decreased, and null relative risks (table 2). The relative risk estimates ranged from 0.40 to 2.14 (median, 0.83) for coronary disease and from 0.30 to 1.33 (median, 0.76) for stroke. Studies in the three copper smelters with a large number of cases (38, 39, 41) showed an increased relative risk for coronary disease, although the confidence intervals overlapped the null value. The study by Hertz-Picciotto et al. (39) also reported mortality data for peripheral arterial disease. The crude relative risk of peripheral arterial disease mortality for workers exposed to ≥20 mg/m3-year compared with workers exposed to less than 2 mg/m3-year was 3.46 (95 percent confidence interval (CI): 0.77, 15.5) (39).
The dose-response relation for coronary disease by cumulative airborne arsenic exposure was available in two studies (38, 39) (figure 4). Coronary disease mortality tended to increase with increasing cumulative exposure to arsenic, particularly after adjustment for the healthy worker survivor effect in the study by Hertz-Picciotto et al. (39). No clear trends were observed for stroke.
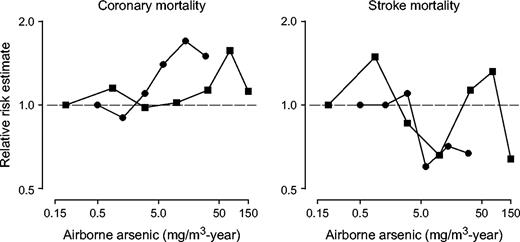
Dose-response relations between cumulative arsenic exposure in ambient air and cardiovascular disease outcomes in occupational studies. Cumulative airborne arsenic exposure = Σ arsenic levels in ambient airi × time of exposurei (i = job position, with different levels assigned to each position in different periods). • Hertz-Picciotto et al., 2000 (39); ▪ Jarup et al., 1989 (38).
One study controlled for the healthy worker survivor effect by introducing a 20-year lag and adjusting for employment status in each year of follow-up (39). The relative risk of coronary disease mortality comparing copper smelter workers with ambient air cumulative exposure of ≥20 mg/m3-year with those with exposure of less than 0.75 mg/m3-year was 1.3 (95 percent CI: 0.87, 2.1) before adjustment for the healthy worker survivor effect and 1.5 (95 percent CI: 0.95, 2.5) after adjustment. After adjustment, the trend of increasing coronary disease mortality risk with increasing arsenic exposure was statistically significant (p trend = 0.003; figure 4). The corresponding relative risks for stroke mortality were 0.45 (95 percent CI: 0.18, 1.1) before adjustment and 0.67 (95 percent CI: 0.23, 1.9) after adjustment, with no consistent trend with increasing arsenic exposure.
DISCUSSION
Summary of findings
This systematic review revealed common limitations in the epidemiologic literature on arsenic and cardiovascular outcomes, including the use of indirect indicators of exposure rather than direct measurements, the uncertain comparability between exposed and unexposed participants, and the use of nonstandardized outcome definitions. These limitations added uncertainty to the association of high chronic arsenic exposure in drinking water with peripheral arterial disease and other cardiovascular outcomes identified in Taiwan. Moreover, in populations outside of Taiwan or in occupational populations, the epidemiologic evidence on the association between low-to-moderate arsenic concentrations and cardiovascular outcomes was inconclusive because of methodologic limitations.
General population studies
Taiwan.
The association between arsenic in drinking water in southwestern Taiwan and blackfoot disease is probably causal (3, 7). This association is most evident at very high cumulative doses of arsenic, typically above 10 mg/liter-year (equivalent, for instance, to continuous exposure to 500 μg/liter of arsenic in drinking water for 20 years). A causal role of arsenic in peripheral arterial disease and angiitis is also supported by early reports from outside of Taiwan. From the 1930s to the 1950s, peripheral arterial disease and amputations were described among German vintners exposed to inorganic arsenic through the application of arsenical pesticides and intake of arsenic-contaminated wine (3, 49–52), including pathology reports of a combination of endangiitis and atheromatosis (52). In addition, long-term arsenic inhalation in occupational settings was associated with the Raynaud phenomenon (53, 54), an intermittent form of vasculitis characterized by digital paleness and low finger blood pressure on cooling that also occurs in thromboangiitis obliterans. Similarly, persons exposed to high levels of arsenic in drinking water (up to 1,790 μg/liter) in Inner Mongolia, China, showed an improved vascular response to cold stress 13 months after an intervention providing lower-arsenic drinking water (37 μg/liter).
To our knowledge, the pathologic characteristics of coronary disease and stroke associated with high arsenic exposure in southwestern Taiwan have not been described in the accessible literature. In Antofagasta, Chile, researchers who conducted histopathologic studies of children and young adults exposed to high levels of arsenic in drinking water (∼600 μg/liter (55)) described fibrous intimal thickening of small and medium-sized arteries (56–58). Some of these children had electrocardiographic signs of myocardial infarction before death (57). In Taiwan, a dose-response pattern has also been reported associating arsenic exposure with carotid plaques and intima-media thickness, which are subclinical markers of atherosclerosis (11).
While high arsenic exposure in Taiwan may relate to cardiovascular disease, the magnitude of the associations is uncertain. The use of average drinking water levels and the lack of individual measures of arsenic make it possible to systematically underestimate exposure due to other sources in these areas, such as contaminated food and cooking water (8). In addition, other methodologic limitations may have a substantial impact on the magnitude of the associations. Because arsenic exposure was assessed at the village level, this ecologic association could be related to unmeasured confounders.
Other factors may limit the generalizability of the Taiwan findings even to high-arsenic areas. Exposure to high arsenic levels in drinking water in Taiwan occurred over a long period of time. Moreover, there may be differences in arsenic species to which populations were exposed (59), in other coexposures (7, 59), in socioeconomic development, or in dietary deficiencies (such as carotenoids, selenium, or zinc (27, 60)) that may interact with arsenic. Differences among populations in the prevalence of functional polymorphisms in genes related to arsenic metabolism may also play a role (61–65).
Other countries.
The cardiovascular effects of low chronic arsenic exposure are unknown. Studies from Taiwan are inadequate to address this question, because few subjects were exposed to low or intermediate levels in drinking water. Furthermore, studies from other populations with likely lower exposures, including the United States, are scarce and inconclusive (24, 28–30, 37).
Important common limitations include the uncertain comparability of exposure groups in terms of cardiovascular disease risk factors, socioeconomic development, and access to care; the use of cross-sectional or case-control designs based on prevalent cases; the lack of individual exposure assessment; and the lack of standardized criteria for diagnosing cardiovascular endpoints. The inconsistent associations between arsenic and cardiovascular outcomes in these studies cannot be interpreted as evidence of a lack of effect of arsenic. Because of the methodologic limitations of these studies, it is possible that even a substantial effect could have been undetected. High-quality prospective studies evaluating the association between long-term arsenic exposure and cardiovascular endpoints in populations with a varied range of exposures should be a public health research priority.
Occupational studies
The methodologic limitations of the occupational studies reviewed precluded our reaching conclusions in favor of or against an association. Most of these studies reported only results from external comparisons. These comparisons are of questionable validity, because workers are likely to have substantially different cardiovascular risks than the general population. The two studies that used internal comparisons showed dose-response relations compatible with increased coronary disease mortality with increasing airborne arsenic concentrations (38, 39). Additional limitations include uncertainties in exposure and outcome assessment, possible changes in arsenic exposure in the workplace over time, lack of information on concomitant exposures (such as metals in copper smelters), and lack of information on established cardiovascular disease risk factors. Finally, only one study adjusted for the healthy worker survivor effect (39). After adjustment, the association of arsenic with coronary disease mortality was stronger and the increasing trend was statistically significant. It is known that the healthy worker survivor effect attenuates the observed effect of arsenic on lung cancer (66), and it is possible that not accounting for it might have produced underestimation of the association with coronary disease mortality in other studies (41, 67).
Possible mechanisms for arsenic-related cardiovascular disease
The possibility that arsenic causes cardiovascular disease is supported by several biologic mechanisms. Arsenic can increase the production of reactive oxygen species like hydrogen peroxide (68, 69), hydroxyl radicals (70), and others (68). Lipid peroxidation increased significantly after 6 months of arsenic feeding in mice (71). Persons exposed to high arsenic in drinking water in Inner Mongolia had higher levels of lipid peroxides (72), and in Taiwanese subjects, blood arsenic was positively correlated with levels of superoxide radicals (73). The production of reactive oxygen species has been implicated as the initial step in arsenic-induced endothelial cell proliferation (68) and apoptosis (69, 74), two mechanisms proposed for arsenic-related atherosclerosis (73).
Arsenic may also induce alterations in nitric oxide metabolism and endothelial function (75, 76). Persons exposed to high-arsenic drinking water in Inner Mongolia had decreased serum and urine concentrations of nitric oxide metabolites (75, 76), and this association was reversed after an intervention provided lower-arsenic drinking water (76). In Mexican children from Región Lagunera, urinary arsenic levels were inversely associated with nitric oxide production in activated monocytes (77). In human endothelial cells, arsenite at concentrations of 1–25 μM inhibited endothelial nitric oxide synthase activity (78, 79), resulting in decreased cell growth. At concentrations below 1 μM, however, arsenite up-regulated the expression of constitutive nitric oxide synthase 3, and this mechanism was proposed as a possible explanation for arsenic-induced cell growth and angiogenesis (79).
In addition, inorganic arsenic up-regulates inflammatory signals (80, 81), releases tumor necrosis factor α from mononuclear cells (81), and stimulates cyclooxygenase-2 expression (82). An inflammatory component was also reported in studies exposing apolipoprotein E-deficient mice to arsenite in drinking water at 10,000–20,000 μg/liter for 18–24 weeks (83, 84). At these very high doses, arsenic accumulated in vessel walls, and plaques covering the intima were increased in size in comparison with unexposed mice (83, 84). Arsenic-treated mice had higher serum levels of leukotriene E4 and prostacyclin (prostaglandin I2) (84), and in vitro, arsenic induced the expression of genes coding inflammatory mediators, including interleukin-8 (83).
Arsenic may also induce atherosclerosis by enhancing arterial thrombosis and platelet aggregation (85, 86). Finally, arsenic exposure has been related to diabetes (87–89) and hypertension (90, 91), but these studies have often had significant methodologic limitations, and their findings have been inconsistent (37, 41).
While experimental studies suggest potential mechanisms for arsenic atherogenicity, their relevance to low or moderate arsenic exposures is uncertain, because these experimental studies were typically performed using high arsenic concentrations. Experimental studies using lower concentrations of arsenic are needed to identify mechanistic pathways for arsenic-induced atherosclerosis.
Quality of the evidence and limitations
Limitations in the assessment of exposure (often performed in an ecologic manner) and cardiovascular outcomes, the cross-sectional or retrospective nature of many studies, and the lack of adjustment for potential confounders, among other methodologic limitations, make it impossible to establish firm conclusions regarding the effects of arsenic on cardiovascular outcomes at concentrations lower than those observed in Taiwan. Similar methodologic limitations make it difficult to quantify the magnitude of the association in Taiwan. Unfortunately, the evidence on the association between arsenic and cardiovascular outcomes that is available from other areas with high arsenic levels in drinking water (in Chile, Argentina, Mexico, Bangladesh, and Inner Mongolia) is limited to uncontrolled case reports on cardiovascular endpoints (56, 58, 92), even though there are case-control studies of arsenic and cancer from these areas (93, 94). The lack of epidemiologic reports from these populations could be related to publication bias, but it could also reflect a lack of investigation.
Conclusion
The evidence from Taiwan is consistent with a role for high arsenic exposure in atherosclerosis, although the magnitude of the association is uncertain because of the methodologic limitations of the available studies. These cardiovascular effects, together with cancer, developmental and reproductive effects, and skin lesions, provide strong support for widespread efforts to reduce arsenic exposure (8). The cardiovascular effects of chronic low-dose exposure to arsenic are unknown, and current epidemiologic studies are inadequate to answer this question. It is becoming increasingly evident, however, that low-level chronic exposure to environmental pollutants may have important cardiovascular effects (2, 95–99), and it is plausible that low-level arsenic exposure also increases cardiovascular risk. Since low or moderate arsenic exposure is widely prevalent, even a small effect of arsenic on cardiovascular risk is potentially important. Carefully planned prospective studies in populations exposed to a wide range of arsenic levels, using individual biomarkers of arsenic exposure and standardized information on cardiovascular disease risk factors and outcomes, is a public health research priority.
This work was supported by grant 1R01 ES012673 from the National Institute of Environmental Health Sciences. Drs. Ana Navas-Acien and Eliseo Guallar were supported by the Johns Hopkins Center for Excellence in Environmental Public Health Tracking. Dr. Eliseo Guallar was also supported by grant 0230232N from the American Heart Association.
Conflict of interest: none declared.
References
Murray CJ, Lopez AD. Mortality by cause for eight regions of the world: Global Burden of Disease Study.
Weinhold B. Environmental cardiology: getting to the heart of the matter.
Engel RR, Hopenhayn-Rich C, Receveur O, et al. Vascular effects of chronic arsenic exposure: a review.
Tseng CH, Chong CK, Chen CJ, et al. Dose-response relationship between peripheral vascular disease and ingested inorganic arsenic among residents in blackfoot disease endemic villages in Taiwan.
Wang CT, Chang WT. Arterial tissue of arsenic, selenium and iron in blackfoot disease patients.
Yu HS, Lee CH, Chen GS. Peripheral vascular diseases resulting from chronic arsenical poisoning.
National Research Council, Subcommittee on Arsenic in Drinking Water. Arsenic in drinking water. Washington, DC: National Academy Press,
National Research Council, Subcommittee on Arsenic in Drinking Water. Arsenic in drinking water: 2001 update. Washington, DC: National Academy Press,
Environmental Protection Agency. National primary drinking water regulations: arsenic and clarifications to compliance and new source contaminants monitoring. Final rule.
Wang CH, Jeng JS, Yip PK, et al. Biological gradient between long-term arsenic exposure and carotid atherosclerosis.
Tollestrup K, Frost FJ, Harter LC, et al. Mortality among children residing near the American Smelting and Refining Company (ASARCO) copper smelter in Ruston, Washington.
Nishimoto Y, Yamakido M, Shigenobu T, et al. Long-term observation of poison gas workers with special reference to respiratory cancers.
Ch'i IC, Blackwell RQ. A controlled retrospective study of blackfoot disease, an endemic peripheral gangrene disease in Taiwan.
Wang CT. Concentration of arsenic, selenium, zinc, iron and copper in the urine of blackfoot disease patients at different clinical stages.
Pan TC, Huang KC, Lin TH, et al. Determination of arsenic and mercury concentrations in urine of patients with blackfoot disease.
Lin TH, Huang YL, Wang MY. Arsenic species in drinking water, hair, fingernails, and urine of patients with blackfoot disease.
Cuzick J, Evans S, Gillman M, et al. Medicinal arsenic and internal malignancies.
Bradford Hill A, Faning EL. Studies in the incidence of cancer in a factory handling inorganic compounds of arsenic: mortality experience in the factory.
Simonato L, Moulin JJ, Javelaud B, et al. A retrospective mortality study of workers exposed to arsenic in a gold mine and refinery in France.
Wingren G, Axelson O. Mortality in the Swedish glassworks industry.
Sobel W, Bond GG, Baldwin CL, et al. An update of respiratory cancer and occupational exposure to arsenicals.
Bencko V, Symon K, Stalnik L, et al. Rate of malignant tumor mortality among coal burning power plant workers occupationally exposed to arsenic.
Varsanyi I, Fodre Z, Bartha A. Arsenic in drinking-water and mortality in the Southern Great Plain, Hungary.
Longnecker MP, Berlin JA, Orza MJ, et al. A meta-analysis of alcohol consumption in relation to risk of breast cancer.
Greenland S. Quantitative methods in the review of epidemiologic literature.
Lin SM, Yang MH. Arsenic, selenium, and zinc in patients with blackfoot disease.
Ruiz-Navarro ML, Navarro-Alarcon M, Lopez Gonzalez-de la Serrana H, et al. Urine arsenic concentrations in healthy adults as indicators of environmental contamination: relation with some pathologies.
Engel RR, Smith AH. Arsenic in drinking water and mortality from vascular disease: an ecologic analysis in 30 counties in the United States.
Lewis DR, Southwick JW, Ouellet-Hellstrom R, et al. Drinking water arsenic in Utah: a cohort mortality study.
Xuan XZ, Lubin JH, Li JY, et al. A cohort study in southern China of tin miners exposed to radon and radon decay products.
Chen CJ, Chiou HY, Chiang MH, et al. Dose-response relationship between ischemic heart disease mortality and long-term arsenic exposure.
Tseng CH, Chong CK, Tseng CP, et al. Long-term arsenic exposure and ischemic heart disease in arseniasis-hyperendemic villages in Taiwan.
Chiou HY, Huang WI, Su CL, et al. Dose-response relationship between prevalence of cerebrovascular disease and ingested inorganic arsenic.
Wu MM, Kuo TL, Hwang YH, et al. Dose-response relation between arsenic concentration in well water and mortality from cancers and vascular diseases.
Chen CJ, Wu MM, Lee SS, et al. Atherogenicity and carcinogenicity of high-arsenic artesian well water. Multiple risk factors and related malignant neoplasms of blackfoot disease.
Zierold KM, Knobeloch L, Anderson H. Prevalence of chronic diseases in adults exposed to arsenic-contaminated drinking water.
Jarup L, Pershagen G, Wall S. Cumulative arsenic exposure and lung cancer in smelter workers: a dose-response study.
Hertz-Picciotto I, Arrighi HM, Hu SW. Does arsenic exposure increase the risk for circulatory disease?
Tsai SM, Wang TN, Ko YC. Mortality for certain diseases in areas with high levels of arsenic in drinking water.
Lubin JH, Pottern LM, Stone BJ, et al. Respiratory cancer in a cohort of copper smelter workers: results from more than 50 years of follow-up.
Tokudome S, Kuratsune M. A cohort study on mortality from cancer and other causes among workers at a metal refinery.
Tsuda T, Nagira T, Yamamoto M, et al. An epidemiological study on cancer in certified arsenic poisoning patients in Toroku.
Binks K, Doll R, Gillies M, et al. Mortality experience of male workers at a United Kingdom tin smelter.
Tollestrup K, Daling JR, Allard J. Mortality in a cohort of orchard workers exposed to lead arsenate pesticide spray.
Mabuchi K, Lilienfeld AM, Snell LM. Cancer and occupational exposure to arsenic: a study of pesticide workers.
Bartoli D, Battista G, De Santis M, et al. Cohort study of art glass workers in Tuscany, Italy: mortality from non-malignant diseases.
Nakadaira H, Endoh K, Katagiri M, et al. Elevated mortality from lung cancer associated with arsenic exposure for a limited duration.
Grobe VJ. Peripheral circulatory disorders and acrocyanosis in arsenic exposed Moselle wine-growers. (In German).
Butzengeiger KH. Uber periphere zirkulationsstorungen bei chronischer arsenvergiftung.
Lagerkvist B, Linderholm H, Nordberg GF. Vasospastic tendency and Raynaud's phenomenon in smelter workers exposed to arsenic.
Lagerkvist BE, Linderholm H, Nordberg GF. Arsenic and Raynaud's phenomenon: vasospastic tendency and excretion of arsenic in smelter workers before and after the summer vacation.
Zaldivar R. Arsenic contamination of drinking water and foodstuffs causing endemic chronic poisoning.
Zaldivar R. A morbid condition involving cardio-vascular, broncho-pulmonary, digestive and neural lesions in children and young adults after dietary arsenic exposure.
Rosenberg HG. Systemic arterial disease and chronic arsenicism in infants.
Moran S, Maturana G, Rosenberg H, et al. Coronary occlusions associated with chronic arsenic poisoning. Apropos of 2 operated cases. (In French).
Chen SL, Yeh SJ, Yang MH, et al. Trace element concentration and arsenic speciation in the well water of a Taiwan area with endemic blackfoot disease.
Hsueh YM, Wu WL, Huang YL, et al. Low serum carotene level and increased risk of ischemic heart disease related to long-term arsenic exposure.
Marnell LL, Garcia-Vargas GG, Chowdhury UK, et al. Polymorphisms in the human monomethylarsonic acid (MMA V) reductase/hGSTO1 gene and changes in urinary arsenic profiles.
Yu L, Kalla K, Guthrie E, et al. Genetic variation in genes associated with arsenic metabolism: glutathione S-transferase omega 1-1 and purine nucleoside phosphorylase polymorphisms in European and indigenous Americans.
Chiou HY, Hsueh YM, Hsieh LL, et al. Arsenic methylation capacity, body retention, and null genotypes of glutathione S-transferase M1 and T1 among current arsenic-exposed residents in Taiwan.
Loffredo CA, Aposhian HV, Cebrian ME, et al. Variability in human metabolism of arsenic.
Li J, Waters SB, Drobna Z, et al. Arsenic (+3 oxidation state) methyltransferase and the inorganic arsenic methylation phenotype.
Arrighi HM, Hertz-Picciotto I. Controlling the healthy worker survivor effect: an example of arsenic exposure and respiratory cancer.
Lubin JH, Fraumeni JF Jr. Re: “Does arsenic exposure increase the risk for circulatory disease?” (Letter).
Barchowsky A, Klei LR, Dudek EJ, et al. Stimulation of reactive oxygen, but not reactive nitrogen species, in vascular endothelial cells exposed to low levels of arsenite.
Chen YC, Lin-Shiau SY, Lin JK. Involvement of reactive oxygen species and caspase 3 activation in arsenite-induced apoptosis.
Wang TS, Kuo CF, Jan KY, et al. Arsenite induces apoptosis in Chinese hamster ovary cells by generation of reactive oxygen species.
Santra A, Maiti A, Das S, et al. Hepatic damage caused by chronic arsenic toxicity in experimental animals.
Pi J, Yamauchi H, Kumagai Y, et al. Evidence for induction of oxidative stress caused by chronic exposure of Chinese residents to arsenic contained in drinking water.
Wu MM, Chiou HY, Wang TW, et al. Association of blood arsenic levels with increased reactive oxidants and decreased antioxidant capacity in a human population of northeastern Taiwan.
Waalkes MP, Fox DA, States JC, et al. Metals and disorders of cell accumulation: modulation of apoptosis and cell proliferation.
Pi J, Kumagai Y, Sun G, et al. Decreased serum concentrations of nitric oxide metabolites among Chinese in an endemic area of chronic arsenic poisoning in inner Mongolia.
Pi J, Yamauchi H, Sun G, et al. Vascular dysfunction in patients with chronic arsenosis can be reversed by reduction of arsenic exposure.
Pineda-Zavaleta AP, Garcia-Vargas G, Borja-Aburto VH, et al. Nitric oxide and superoxide anion production in monocytes from children exposed to arsenic and lead in region Lagunera, Mexico.
Lee MY, Jung BI, Chung SM, et al. Arsenic-induced dysfunction in relaxation of blood vessels.
Kao YH, Yu CL, Chang LW, et al. Low concentrations of arsenic induce vascular endothelial growth factor and nitric oxide release and stimulate angiogenesis in vitro.
Wu MM, Chiou HY, Ho IC, et al. Gene expression of inflammatory molecules in circulating lymphocytes from arsenic-exposed human subjects.
Yu HS, Liao WT, Chang KL, et al. Arsenic induces tumor necrosis factor alpha release and tumor necrosis factor receptor 1 signaling in T helper cell apoptosis.
Tsai SH, Liang YC, Chen L, et al. Arsenite stimulates cyclooxygenase-2 expression through activating IκB kinase and nuclear factor κB in primary and ECV304 endothelial cells.
Simeonova PP, Hulderman T, Harki D, et al. Arsenic exposure accelerates atherogenesis in apolipoprotein E(-/-) mice.
Bunderson M, Brooks DM, Walker DL, et al. Arsenic exposure exacerbates atherosclerotic plaque formation and increases nitrotyrosine and leukotriene biosynthesis.
Lee MY, Bae ON, Chung SM, et al. Enhancement of platelet aggregation and thrombus formation by arsenic in drinking water: a contributing factor to cardiovascular disease.
Kumar SV, Bhattacharya S. In vitro toxicity of mercury, cadmium, and arsenic to platelet aggregation: influence of adenylate cyclase and phosphodiesterase activity.
Tseng CH, Tseng CP, Chiou HY, et al. Epidemiologic evidence of diabetogenic effect of arsenic.
Rahman M, Tondel M, Ahmad SA, et al. Diabetes mellitus associated with arsenic exposure in Bangladesh.
Rahman M, Wingren G, Axelson O. Diabetes mellitus among Swedish art glass workers—an effect of arsenic exposure?
Chen CJ, Hsueh YM, Lai MS, et al. Increased prevalence of hypertension and long-term arsenic exposure.
Rahman M, Tondel M, Ahmad SA, et al. Hypertension and arsenic exposure in Bangladesh.
Xia YJ, Ma HZ, Yu GJ, et al. Arsenic poisoning and diseases of small arteries. (In Chinese).
Bates MN, Rey OA, Biggs ML, et al. Case-control study of bladder cancer and exposure to arsenic in Argentina.
Ferreccio C, Gonzalez C, Milosavjlevic V, et al. Lung cancer and arsenic concentrations in drinking water in Chile.
Guallar E, Sanz-Gallardo MI, van't Veer P, et al. Mercury, fish oils, and the risk of myocardial infarction.
Navas-Acien A, Selvin E, Sharrett AR, et al. Lead, cadmium, smoking, and increased risk of peripheral arterial disease.
Stern AH. A review of the studies of the cardiovascular health effects of methylmercury with consideration of their suitability for risk assessment.

