


Abstract
The diagnosis of primary central nervous system lymphoma (PCNSL) can be challenging. PCNSL lesions are frequently located deep within the brain, and performing a cerebral biopsy is not always feasible. The aim of this study was to investigate the diagnostic value of CSF neopterin, a marker of neuroinflammation, in immunocompetent patients with suspected PCNSL.
We retrospectively reviewed the characteristics of 124 patients with brain tumor (n = 82) or an inflammatory CNS disorder (n = 42) in whom CSF neopterin levels were assessed. Twenty-eight patients had PCNSL, 54 patients had another type of brain tumor (glioma n = 36, metastasis n = 13, other n = 5), and 13 patients had a pseudotumoral inflammatory brain lesion.
CSF neopterin levels were significantly higher in the patients with PCNSL than in those with other brain tumors (41.8 vs 5.1 nmol/L, P < .001), those with pseudotumoral inflammatory brain lesions (41.8 vs 4.3 nmol/L, P < .001), and those with nontumefactive inflammatory CNS disorders (41.8 vs 3.8 nmol/L, P < .001). In the 95 patients with space-occupying brain lesions, at a cutoff of 10 nmol/L, the sensitivity of this approach was 96% and the specificity was 93% for the diagnosis of PCNSL. The positive and negative predictive values were 84% and 98%, respectively.
Assessing CSF neopterin levels in patients with a suspected brain tumor might be helpful for the positive and differential diagnosis of PCNSL. A prospective study is warranted to confirm these results.
Primary central nervous system lymphomas (PCNSLs) are extranodal non-Hodgkin lymphomas affecting the brain, the leptomeninges, the spinal cord, and the eye1 in the absence of systemic lymphoma at the time of diagnosis. These lymphomas account for 3% to 5% of primary brain tumors. Diffuse large B-cell lymphoma (DLBCL) is the most common histopathological PCNSL subtype. PCNSLs are aggressive tumors, and prompt diagnosis is needed to rapidly initiate appropriate treatment.
PCNSL MRI characteristics are frequently suggestive of the diagnosis, showing unique or multiple periventricular, homogeneously enhancing lesions. In addition, magnetic resonance spectroscopy and perfusion MRI can show suspicious abnormalities, such as low regional cerebral blood volume ratios and very high lipid resonances.2 Yet, MRI characteristics are not specific, and neuropathological examination is mandatory to establish the diagnosis. In ∼10%–30% of cases, lymphoma cells can be identified in the cerebrospinal fluid (CSF) or in a vitreous body biopsy (if a vitreoretinal lymphoma is diagnosed on slit-lamp examination). However, in the majority of cases, a cerebral biopsy needs to be performed. Nevertheless, performing a cerebral biopsy can be technically challenging and potentially dangerous as PCNSL lesions are frequently located deep within the brain and can involve all CNS regions, including the brainstem. Therefore, biomarkers that would allow the diagnosis of PCNSL when histological examination is not feasible would be very helpful.
Neopterin is a nonspecific marker of the type 1 T-helper cell–related cellular immune response. Its concentration in different biological fluids such as serum, urine, and CSF has been suggested to be a marker of disease activity in a wide range of infectious and inflammatory diseases. Elevated neopterin levels in the CSF have been reported in CNS infectious diseases (such as HIV,3 human T-cell lymphotropic virus type 1–associated spastic paraparesis,4 and Lyme neuroborreliosis5) and CNS inflammatory disorders (inconsistently elevated in multiple sclerosis6,7 and high in neurosarcoidosis and neuro-Behçet8). Moderately increased levels have also been reported in advanced Parkinson disease9 and traumatic brain injuries.10 In our center, CSF neopterin levels are routinely assessed in patients suspicious for Creutzfeldt-Jakob disease (CJD) to allow for the differential diagnosis of inflammatory or infectious neurological conditions. Over the years, we have observed the cases of several patients suspicious for CJD who yet had elevated CSF neopterin levels and in whom the final diagnosis was PCNSL.11,12 These observations prompted us to study the diagnostic value of CSF neopterin levels in patients with space-occupying brain lesions.
Materials and Methods
Patients
Between December 2007 and June 2014, we retrospectively identified patients from our department with brain tumor or who were suspicious for brain tumor or with an inflammatory CNS disorder in whom neopterin levels were assessed in the CSF. In patients with a space-occupying brain lesion, CSF analysis was generally performed to identify potential leptomeningeal dissemination (at diagnosis or at recurrence) or because of the suspicion of a tumefactive, nonneoplastic neurological disorder. The list of patients with available CSF neopterin levels was obtained from the records of the neurochemistry department and matched with the records of the neuro-oncology department. A definite neuropathological diagnosis was available for all patients with a brain tumor.
The medical and radiological files of all patients were reviewed. This study has been approved by our institutional ethical committee on human experimentation.
CSF Neopterin Analysis
After collection, the CSF was immediately transported to the laboratory to be centrifuged at 2000 g at 12° ± 3°C for 10 min, after which supernatants were frozen at −80°C until analysis. The maximum delay between CSF sampling and supernatant freezing was 2 h. The maximum delay between freezing and analysis was 15 days. CSF neopterin levels were obtained as previously reported5 using high-performance liquid chromatography coupled with fluorimetric detection (all tests were supervised by A.P.-L.). Using pools of CSF samples prepared each year as an internal quality control, the ranges of yearly interassay coefficients and variability during the period of patient inclusion were 5.9% and 7% at 7.5 and 1.8 nmol/L of CSF neopterin, respectively. The upper normal reference value was previously determined to be 5 nmol/L (upper limit of the 99% confidence interval).13
Statistical Analysis
Differences between the groups of patients were analyzed using the Mann–Whitney U-test and the Kruskal–Wallis test, and P < .05 was considered to be statistically significant. The diagnostic accuracy of CSF neopterin levels was assessed using receiver operating characteristic (ROC) curve analysis. Correlations were assessed using Spearman's rank test. All statistical analysis and graphs were performed using SPSS, version 21.0 (IBM).
Results
Patient Characteristics
We identified 82 patients with brain tumors, 13 patients with pseudotumoral inflammatory brain lesions, and 29 patients with nontumefactive inflammatory CNS disorders in whom CSF neopterin levels were assessed (Table 1). Twenty-eight patients had PCNSL (all were immunocompetent) and 54 patients had another type of brain tumor.
Demographic and patient CSF characteristics
| PCNSL, n = 28 | Other Brain Tumor Types, n = 54 | Pseudotumoral Inflammatory Lesions, n = 13 | Pa | Nontumefactive Inflammatory CNS Disorders, n = 29 | Pb | |
|---|---|---|---|---|---|---|
| Demographics | ||||||
| Female, n (%) | 12 (43) | 23 (43) | 5 (38) | ns | 17 (59) | ns |
| Age, y, avg (range) | 69 (29–84) | 62 (21–84) | 55 (19–79) | .015 | 51 (18–78) | <.001 |
| CSF characteristics | ||||||
| Cell count, n, median (range) | 11.5 (1–2300) | 3 (1–55) | 2.0 (1–18) | <.001 | 1 (1–12) | <.001 |
| Protein, g/L, median (range) | 0.93 (0.40–8.5) | 0.57 (0.23–11.48) | 0.51 (0.23–1.38) | .001 | 0.35 (0.20–0.65) | <.001 |
| Glucose, mmol/L, median (range) | 3.45 (1.60–7.15) | 3.45 (0.60–7.60) | 3.50 (2.5–6.2) | ns | 3.6 (2.9–4.7) | ns |
| Neopterin, nmol/L, median (range) | 41.8 (7.70–135.00) | 5.1 (1.90–16.90) | 4.3 (1.9–29.2) | <.001 | 3.8 (1.7–26.5) | <.001 |
Abbreviation: ns, not significant.
aP-value for PCNSL vs tumoral and pseudotumoral groups.
bP-value for PCNSL vs control group.
The histology of PCNSL cases was DLBCL in 24 patients, T-cell lymphoma in 1 patient, and unclassified lymphoma in 3 patients. Diagnosis was established using a cerebral biopsy in 26 patients and CSF cytology in 2 patients. The median number of lesions was 2 (data available for 23 patients, range: 1–6) according to MRI analysis. The posterior fossa was involved in 13 of 23 cases (56%), and the mean cumulative lesion volume (sum of all discrete lesion volumes) was 3.7 cm3 (range: 0.53–17.2 cm3). None of the patients had received steroids at the time of CSF analysis.
Among the 54 patients with other brain tumor types, 16 patients had a newly diagnosed glioma (glioblastoma n = 11, anaplastic glioma n = 3, brainstem glioma n = 1, and low-grade glioma n = 1), 20 patients had a recurrent glioma (glioblastoma n = 15, anaplastic glioma n = 5), 13 patients had brain metastasis (from breast cancer n = 5, lung cancer n = 5, head and neck cancer n = 1, and unknown origin n = 2), and 5 patients had another type of intracranial tumor (hemangioblastoma n = 1, germinoma n = 1, anaplastic meningioma n = 1, medulloblastoma n = 1, and pinealoblastoma n = 1). Sixteen patients had received steroids at the time of CSF analysis.
Among the 13 patients with pseudotumoral inflammatory brain lesions, 8 patients had demyelinating disease (multiple sclerosis n = 5, neuromyelitis optica n = 1, acute disseminated encephalomyelitis [ADEM] n = 1, progressive multifocal leukoencephalopathy n = 1), 2 patients had a neurosarcoidosis, 2 patients had dysimmune encephalitis (anti–N-methyl-d-aspartate receptor [NMDAR] encephalitis n = 1, and anti–leucine-rich glioma inactivated 1 encephalitis n = 1), and 1 patient had cerebral amyloid angiopathy–related inflammation. In 5 patients (3 patients with demyelinating disease and 2 patients with dysimmune encephalitis) the diagnosis was histologically proven; in the other patients it was based on clinical and biological criteria.
The group of patients with nontumefactive inflammatory CNS disorders consisted of 10 patients with a paraneoplastic neurological syndrome associated with or without onconeural antibodies (anti-Hu n = 4, anti-Yo n = 2, anti–gamma-aminobutyric acidB receptor n = 1, no antibodies n = 3), 14 patients with a dysimmune encephalitis (anti-NMDAR n = 7, anti–glutamic acid decarboxylase n = 4, no antibodies n = 3), and 5 patients with demyelinating disease (multiple sclerosis n = 4, ADEM n = 1).
The CSF cell count and CSF protein level were higher in the patients with PCNSL than in the other groups of patients (P < .01; Table 1).
Neopterin CSF Levels Are Higher in PCNSL Patients Than in Patients With Other Types of Brain Tumors
As illustrated in Fig. 1, the median CSF neopterin levels were significantly higher in the patients with PCNSL than in the patients with other types of brain tumors (41.8 vs 5.1 nmol/L, P < .001), the 13 patients with pseudotumoral inflammatory brain lesions (41.8 vs 4.3 nmol/L, P < .001), and the 29 patients with nontumefactive inflammatory CNS disorders (41.8 vs 3.8 nmol/L, P < .001). In the whole series, regardless of the diagnosis, CSF neopterin levels were positively correlated with CSF cell count (rho = 0.57, P < .01) and with CSF protein levels (rho = 0.49, P < .01). Yet, in the PCNSL patient group, or in the other patients' groups, no significant correlation between CSF neopterin levels and clinical, CSF, imaging, or histological characteristics could be identified. None of the PCNSL patients exhibited a normal CSF neopterin value (<5 nmol/L), whereas 52% (28/54) of the patients with another type of brain tumor exhibited normal values (P < .001). Two patients with positive CSF cytology had CSF neopterin levels within the higher range (100 and 134 nmol/L, one patient had a T-cell lymphoma). In the non-PCNSL tumor patients, a CSF neopterin level >10 nmol/L was observed in only 4 patients (10.7, 10.9, 13.2, and 16.9 nmol/L). Three of these patients had a glioblastoma without particular characteristics compared with the other glioblastoma patients in the series; the fourth patient had a pinealoblastoma. Within the subgroups of non-PCNSL tumors, no significant difference was observed regarding CSF neopterin levels. CSF neopterin levels were similar in patients who had and had not received steroids at the time of CSF analysis and in newly diagnosed and recurrent gliomas. Among patients with inflammatory CNS disorders, a CSF neopterin level >10 nmol/L was observed in 3 patients with anti-NMDAR encephalitis, in 1 patient with ADEM, and in 1 patient with anti-Yo cerebellitis.
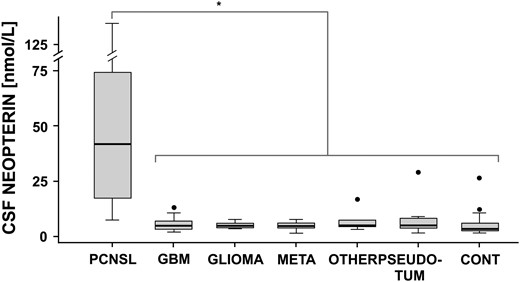
Box plot representation of CSF neopterin levels in PCNSL patients versus other subgroups. Difference between CSF neopterin levels in PCNSL versus different subgroups was statistically significant (asterisk bar, P < 0.001). No significant difference was observed within subgroups. PCNSL: primary central nervous system lymphoma. GBM: glioblastoma, GLIOMA: other gliomas, OTHER: other brain tumors, PSEUDO-TUM: pseudotumoral inflammatory lesions, CONT: nontumefactive inflammatory CNS disorders. Black dots indicate outliers.
In the 95 patients with space-occupying brain lesions (82 patients with brain tumors and 13 patients with tumefactive inflammatory brain lesions), ROC curve analysis demonstrated that with a cutoff value of 10 nmol/L, CSF neopterin had a sensitivity of 96%, a specificity of 93%, a positive predictive value of 84%, and a negative predictive value of 98% for the diagnosis of PCNSL (Fig. 2). In the whole series of 124 patients, at a cutoff value of 10 nmol/L, CSF neopterin had a sensitivity of 96%, a specificity of 92%, a positive predictive value of 77%, and a negative predictive value of 99% for the diagnosis of PCNSL.
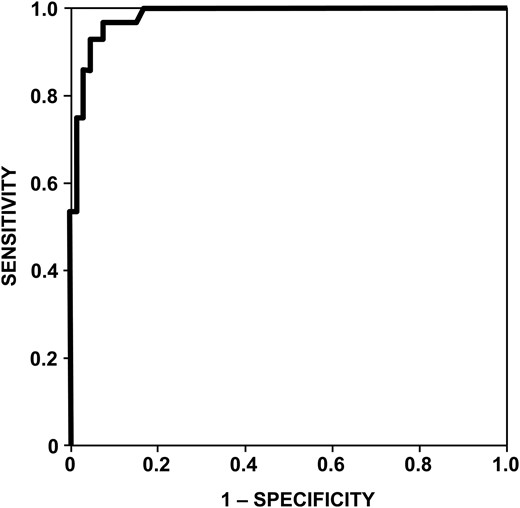
CSF neopterin level values receiver-operator characteristic (ROC) curve in patients with space occupying brain lesions. Area under the curve is 0.982 (confidence interval: 0.961–1). For a cut-off value of 10 nmol/L, the sensitivity was 96% and the specificity 93%.
Discussion
To our knowledge, this is the first study showing that CSF neopterin might be an interesting diagnostic biomarker for PCNSL in patients with a suspected brain tumor. Neopterin is a pyrazino-pyrimidine compound that is biosynthesized from guanosine triphosphate by cells and produced mostly by monocytes and activated macrophages during interferon-gamma stimulation. Neopterin is a sensitive marker of cellular immunity activation and has been shown to induce the expression of several pro-inflammatory cytokines and other mediators.14–16 CSF neopterin levels have been shown to be elevated in a wide range of infectious and inflammatory CNS disorders but not in PCNSL until now. High neopterin levels have been reported in the serum and urine of patients with systemic hematologic malignancies.17–20 Serum and urinary neopterin levels are elevated in ∼90% of patients with hematologic cancers17,18 (lymphomas and leukemias21), and elevated CSF neopterin levels have been reported in children with meningeal relapse of a systemic hematologic malignancy. Our results are consistent with these reports and suggest a strong association between neopterin levels and hematologic malignancies. Whether neopterin in PCNSL is secreted by accompanying inflammatory cells, tumor cells, or both is unknown. PCNSL is usually characterized by a high degree of microglial infiltration,22 which might be explained by the secretion of high levels of monocyte chemoattractants by tumor cells.23 Yet, in certain circumstances, B cells have also been shown to produce neopterin, and therefore neopterin could also be secreted by PCNSL tumor cells.24,25
As CSF neopterin is a nonspecific marker of CNS inflammation, its diagnostic value can be interpreted only within a given clinical and radiological context. As shown in the present study, high CSF neopterin levels can be observed in some patients with demyelinating disease or with dysimmune encephalitis. Yet, our study suggests that assessing CSF neopterin levels in patients with a suspected brain tumor could help differentiate PCNSL from other types of brain neoplasms. The CSF neopterin levels were also higher in PCNSL than in the group of pseudotumoral inflammatory brain lesions; however, the sample size of this group was too limited to conclude on the diagnostic value of neopterin in this setting. In the future it will be important to determine the diagnostic value of CSF neopterin in a larger number of patients with pseudotumoral inflammatory brain lesions (especially in patients with demyelinating disease, neurosarcoidosis, or neuro-Behçet) as well as in patients with pseudotumoral infectious lesions. It remains to be determined whether CSF neopterin might be of diagnostic value when PCNSL does not present as a brain tumor—for example, in cases presenting as leukoencephalopathy or as isolated leptomeningeal involvement.
Several potential CSF diagnostic biomarkers for PCNSL have been previously reported. CSF levels of soluble cluster of differentiation (sCD)27,26 β2-microglobulin,27 anti–thrombin III,28 free light chain immunoglobulins,29 a specific set of microRNAs,30 interleukin (IL)-10,31 IL-6,31 sIL2-R,31 and CXCL1332 have been shown to be elevated in PCNSL. Yet only CSF levels of IL-10, IL-6, CXCL13, β2-microglobulin, and sCD27 seem to be higher in PCNSL patients than in patients with other types of brain tumors (for the other biomarkers, either no comparison with other tumor types was performed or the sample size was too small to allow for robust conclusions). As shown in Table 2, the 96% sensitivity and 93% specificity of CSF neopterin in our series compare favorably with the reported diagnostic values of these biomarkers. IL-10 and CXCL13 seem the most promising biomarkers. IL-10 is implicated in B-cell growth and differentiation, and a recent study has shown that IL-10 might also be of prognostic value in PCNSL.31 CXCL13 is a CXC chemokine ligand responsible for B-cell migration. Elevation of both CXCL13 and IL-10 has been shown to be highly specific for PCNSL diagnosis.32 In the future, it might be interesting to combine the analysis of CSF neopterin levels with one or more of these CSF biomarkers.31 Coupling the diagnostic value of CSF neopterin analysis with the diagnostic value of advanced MRI techniques, such as perfusion MRI and MRI spectroscopy, could be another promising strategy. As for all CSF biomarkers, one limitation of CSF neopterin analysis is that it cannot be performed in patients with large tumors and an important mass effect. However, performing a cerebral biopsy is usually not a problem in these patients. To circumvent this problem, neopterin could be assessed in the serum. However, neopterin serum levels are more complicated to interpret than CSF levels, since high serum levels can be observed in systemic infections and in kidney disease in which the serum levels follow those of creatinine (which is not the case for CSF levels). This is the reason why in our laboratory, neopterin levels were assessed in the CSF but not in the serum until now. Another important question is whether serial CSF neopterin values would aid in monitoring therapy and in diagnosing recurrence, as demonstrated for IL-10.31
Summary of previously reported potential CSF biomarkers for PCNSL diagnosis
| CSF Biomarker | Biomarker Potential Role in PCNSL | Sensitivity | Specificity | Groups | Technique | Reference |
|---|---|---|---|---|---|---|
| sCD27 | Secreted by malignant B cells and activated lymphocytes | 100% | 82% | 4 PCNSL, 45 SCNSL, 3 BT, 21 MET, 165 O (165 CNS staging) | ELISA | Kersten et al, 199626 |
| β2-microglobulin | Component of the MHC-1; related to lymphocytes turnover | 68–100% | Moderate | 6 PCNSL, 4 SCNSL, 12 BT, 7 MET, 79 O (mostly neuro-inflammatory disorders) | ELFA | Caudie et al, 200527 |
| Anti–thrombin III | Modulation of tumor angiogenesis | 75% | 98% | 20 PCNSL, 3 SCNSL, 3 BT, 8 MET, 77 O (various) | ELISA | Roy et al, 200828 |
| FLC | Excess secretion of kappa and lambda free immunoglobulin light chains | Moderate | High | 17 PCNSL, 4 SCNSL, 5 BT, 0 MET, 9 O (various) | FLCA | Schroers et al, 201029 |
| miRNA | Deregulated expression of those posttranscriptional gene regulators | 96% | 97% | 39 PCNSL, 0 BT, 0 MET, 30 O (various) | miRNA extraction kit | Baraniskin et al, 201130 |
| IL-10 | Cytokine implicated in B-cell growth and differentiation | 71% | 100% | 31 PCNSL, 49 BT, 8 MET, 2 O (MS) | ELISA | Sasayama et al, 201231 |
| IL-6 | Cytokine involved in lymphoid growth and differentiation | 77% | 63% | CLEIA | ||
| sIL2-R | Marker of T-cell activation | 57% | 81% | ELISA | ||
| CXCL13 (+IL-10) | CXC chemokine ligand responsible for B-cell migration | 71% (50%) | 91% (99.3%) | 60 PCNSL, 23 SCNSL, 8 BT, 12 MET, 117 O (71 neuro-inflammatory disorders and 46 CNS staging) | ELISA | Rubenstein et al, 201332 |
| Neopterin | Marker of Th1-related cellular immune response activation | 96% | 93% | 28 PCNSL, 41 BT, 13 MET, 13 PSD-T, 29 NON-T | HPLC/FD | Present study |
Abbreviations: BT, brain tumors; CLEIA, chemiluminescent enzyme immunoassay; CNS staging, CSF analysis performed for the staging of systemic lymphomas or leukemias; ELFA, enzyme-linked fluorescent assay; ELISA, enzyme-linked immunosorbent assay; FLC, free light chain immunoglobulin; FLCA, free light chain assay; HPLC/FD, high-performance liquid chromatography coupled with fluorimetric detection; MET, metastasis; miRNA, microRNA; MHC, major histocompatibility complex; MS, multiple sclerosis; n.a., not available, NON-T, nontumefactive inflammatory CNS disorders; O, other nontumoral neurological disorders; PSD-T, pseudotumoral inflammatory brain lesions; SCNSL, secondary central nervous system lymphomas; Th1, type 1 T-helper cell.
In conclusion, the present study suggests that CSF neopterin might be an interesting diagnostic biomarker in patients with suspected PCNSL. High CSF neopterin levels could allow the diagnosis of PCNSL in patients for whom histological examination is not feasible or is dangerous. In contrast, low CSF neopterin levels could circumvent the need for a cerebral biopsy in patients for whom histological examination is performed with only the aim of ruling out a PCNSL (Fig. 3). A prospective study is warranted to confirm these results.
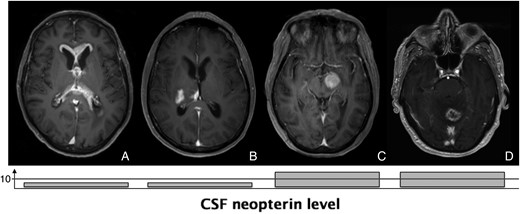
MRI scans from 3 patients with biopsy-proven final diagnosis and corresponding CSF neopterin levels with cut-off value at 10 nmol/L. A and B: glioblastoma with atypical MRI, suggestive of PCNSL and with low CSF neopterin level. C: deep located PCNSL and high CSF neopterin level. D: PCNSL with atypical MRI and high CSF neopterin level.
Funding
No targeted funding reported.
Conflict of interest statement. All authors report no disclosures relevant to the manuscript.


