


Abstract
With this study, we provide a comprehensive reference dataset of detailed miRNA expression profiles from seven types of human peripheral blood cells (NK cells, B lymphocytes, cytotoxic T lymphocytes, T helper cells, monocytes, neutrophils and erythrocytes), serum, exosomes and whole blood. The peripheral blood cells from buffy coats were typed and sorted using FACS/MACS. The overall dataset was generated from 450 small RNA libraries using high-throughput sequencing. By employing a comprehensive bioinformatics and statistical analysis, we show that 3′ trimming modifications as well as composition of 3′ added non-templated nucleotides are distributed in a lineage-specific manner—the closer the hematopoietic progenitors are, the higher their similarities in sequence variation of the 3′ end. Furthermore, we define the blood cell-specific miRNA and isomiR expression patterns and identify novel cell type specific miRNA candidates. The study provides the most comprehensive contribution to date towards a complete miRNA catalogue of human peripheral blood, which can be used as a reference for future studies. The dataset has been deposited in GEO and also can be explored interactively following this link: http://134.245.63.235/ikmb-tools/bloodmiRs.
INTRODUCTION
MicroRNAs (miRNAs) are fundamental regulators in many cell biological processes. They represent a class of short (∼22 nucleotides long), non-coding RNAs that regulate gene expression at the post-transcriptional level by predominantly targeting the 3′ UTR region of target messenger RNAs (1). To date, >2500 miRNA sequences are known in humans (miRBase v21 (2)) and it has been predicted that 30–80% of human genes are influenced by at least one miRNA (3,4). Numerous mature miRNAs have been implicated in a wide range of physiologic and pathologic processes. Since the deregulation of miRNAs has been demonstrated in a range of diseases, including several types of cancer (5–8) and heart disease (9), there is a significant focus on miRNAs in biomarker research to utilize them in the prediction and early detection of diseases.
In recent years, the long-standing theory that each miRNA precursor (more precisely each arm of the hairpin molecule) produces one constant mature miRNA sequence, was disproved by results from high-throughput sequencing and subsequent bioinformatics analyses. It has been shown that a single miRNA hairpin arm can give rise to multiple distinct isoforms (isomiRs) that are now referred to as the mature miRNA transcripts and that can differ in their length and sequence composition (10). The term ‘miRNA-arm’ is used to define the set of all mature transcripts deriving from one arm (5p or 3p) of the miRNA hairpin molecule (11). IsomiRs are categorized into three main classes: 5′ isomiRs, 3′ isomiRs, and polymorphic isomiRs. Additionally, 5′ and 3′ isomiRs are sub-classified into templated or non-templated modifications (12). Several studies have shown that isomiR expression profiles depend on tissue type, gender, population, ethnicity, disease type and subtype (13–16), and most importantly, that isomiRs exhibit functional differences in comparison to their archetype miRNAs (the miRNA sequences listed in public database) (17,18). These findings provide solid evidence that isomiRs have functional relevance and cannot be dismissed as experimental artefacts.
In 2008, miRNAs were first characterized in blood and described as circulating miRNAs (19–21). The detection of miRNAs in circulation provided an opportunity to use miRNAs as non-invasive biomarkers for the distinction of biological/clinical conditions. Since then numerous studies have reported circulating miRNAs as biomarkers for a variety of cancers and other diseases (22–24). However, the origin and especially the sequence variation of these miRNAs has been poorly investigated. In a recent study, Pritchard et al. (25) examined 79 solid tumor circulating miRNA biomarkers reported in the literature and showed that 46 of 79 are highly expressed in different blood cells. This provided first insights that blood cells substantially contribute to circulating miRNA levels, be it because of contamination by hemolysis or regular physiological processes. Since then, only a few research projects focused on the miRNA transcriptomes of either several or single separated blood cell types (26–29) and even fewer focused on the miRNA sequence variations in distinct cell types (30,31). Yet, there is still only scarce knowledge about the blood cell origin of circulating miRNAs, their expression pattern with respect to different cell types and especially about their sequence variations in different blood compounds. Therefore, it is important to further study miRNA expression of different blood cells in order to identify cell type specificity.
Because of its high availability in clinical practice, peripheral blood is also the most commonly collected body fluid. The majority of non-invasive miRNA biomarker studies, thus, currently focus on the measurement of blood miRNAs, although numerous other fluid compounds are also under investigation. Methodologically, besides quantitative PCR (qPCR) and array-based technologies, small RNA sequencing (sRNA-Seq) has become a popular technology to establish miRNA-based transcriptional profiles. Interpretation of results gained from those blood-based sRNA-Seq studies, however, remains a challenging task (32–34). Most sRNA-Seq protocols are PCR-based and depend on adapter-ligation steps and often suffer from the limitation that the measurement of a particular miRNA is not independent from other miRNAs. The resulting introduction of biases towards certain miRNAs may lead to discrepancies in the overall abundance of sequenced miRNAs. In addition to the above-described technological problems, blood as liquid tissue has only a relatively low abundance of miRNAs compared to solid tissues, which decreases the signal-to-noise ratio and renders the measurement of rare miRNAs difficult. Moreover, due to the differential miRNA expression in different blood cell types and the uneven distribution of cell types based on different conditions, e.g. diseases, it is difficult to distinguish between true positive, false positive but also potential false negative signals in sRNA-Seq datasets. Finally, depending on the treatment of the sample material, hemolysis can occur and introduce another source for altered measurements (34).
Given the above-described difficulties, when studying sRNA-Seq-based miRNA profiles, it is crucial to first understand how miRNAs and their isoforms are distributed in human blood before interpreting a deregulated state, e.g. in the context of a disease. For this purpose, a comprehensive reference dataset for miRNA expression in the different components of healthy human blood (cell types, vesicles and fluid) is urgently needed but currently only fragmentary in the public domain. The results presented here thus summarize our (still non-exhaustive, but substantial) contribution towards such a reference dataset. We report the transcriptional profiles of miRNAs and isomiRs from seven distinct peripheral blood cell populations of 43 healthy donors using sRNA-Seq. In addition, we also examined whole blood profiles (n = 77) as well as circulating miRNAs from serum (n = 38) and blood-borne exosomes (n = 38). The results can be interactively browsed at http://134.245.63.235/ikmb-tools/bloodmiRs.
MATERIALS AND METHODS
Study samples
A total of 162 blood samples from healthy volunteers (routine blood donors from transfusion medicine) were included in this study. Of the 162 samples, 43 buffy coats remaining from plasma donation were collected. Forty two serum samples were collected into serum collection tubes (BD Vacutainer 366643) and 77 whole blood samples were collected into PAXgene RNA blood tubes (Qiagen). All donors signed a written informed consent form. Approval for the study was received from the Ethics Committee of the Medical Faculty, University, Kiel.
Isolation and purification of cell types
Human peripheral blood cells were isolated from leukocyte concentrates (buffy coats) of healthy donors by Ficoll density gradient centrifugation. Briefly, buffy coats (∼50 ml) were dissolved in 100 ml phosphate-buffered saline (PBS) and 15 ml lymphocyte separation medium/Ficoll (d = 1.077 g/ml) were carefully added and centrifuged at 2000 rpm for 20 min (divided in four separate 50 ml tubes, without using the brake function). After centrifugation, peripheral blood mononuclear cells (PBMCs) enriched in the interface between plasma and Ficoll were carefully gathered. After washing three times with PBS (1 × 5 min, 1600 rpm; 2 × 10 min, 1000 rpm), cells were resuspended and an aliquot counted by fluorescence-activated cell sorting (FACS). Granulocytes and RBCs, which are not within the PBMC fraction, were extracted separately by pipetting 1000 μl from the interface between Ficoll and red blood cells (RBCs) or 100 μl from the bottom of the tube, respectively.
Magnetic activated cell sorting (MACS, Miltenyi Biotec, Bergisch-Gladbach, Germany) was used to purify CD56+ (NK cell), CD19+ (B cell), CD8+ (cytotoxic T cell), CD4+ (T helper cell), CD14+ (monocyte), CD15+ (neutrophil) and CD235a+ (erythrocyte) cell populations, following the manufacturer's instructions. CD14+, CD15+, CD19+ and CD235a+ cells were isolated by positive selection, whereas CD4+, CD8+ and CD56+ cells were isolated by negative selection. Purity of the individual cell populations was assessed using FACS.
Total RNA isolation and sRNA-Seq
Total RNA including small RNA from sorted cell types was extracted using the mirVana RNA Isolation Kit (Ambion). For whole blood, we used the PAXgene Blood miRNA Kit (Qiagen). For serum samples miRNeasy Serum and Plasma kit (Qiagen) was used and exosomes were processed using the Total Exosome Isolation Reagent and the Total Exosome RNA and Protein Isolation Kit (Life Technologies). All isolation protocols were conducted according to the manufacturers’ instructions, without further modifications.
Extracted total RNAs were combined with a spike-in cocktail (except whole blood samples) as previously described by Hafner et al. (35). The products were then subjected to Illumina TruSeq Small RNA Sample Preparation protocol to generate small RNA libraries for each sample. Subsequently, the libraries were randomized and pooled with six samples per lane for serum and exosomes, and 24 samples per lane for cell types and whole blood. Sequencing was conducted on an Illumina HiSeq 2500 (1 × 50 bp SR, v3). Raw sequencing reads and quantified read-count data have been deposited at NCBI Gene Expression Omnibus (GEO) (36) under the accession number GSE100467.
Data analysis
Obtained raw reads were subjected to exhaustive adapter trimming using cutadapt v1.3 (37). Low quality 3′ ends of reads falling below Q20 (Phred score) were discarded. Only the quality trimmed reads that were longer than 18 bp were retained. Subsequently, the reads mapping to viral genomes, viral miRNA precursors and human non-miRNA short RNAs were filtered out. The remaining reads were mapped to miRNA sequences from miRBase v21 (2) using mirAligner (38) with default parameters (1 mismatch, 3 nt in the 3′ or 5′ trimming variants and the 3 nt in 3′-addition variants) and to spike-in sequences. As the latter were not available for all samples analysed, the respective read counts were neglected for further analysis. The R package isomiRs (38) was used to generate counts of miRNA-arms (read count sums of all isomiRs including archetype miRNA which align to the same miRBase entry) and isomiRs. Samples with fewer than one million of initial reads and those for which the number of expressed miRNA reads on a logarithmic scale was falling below Q1 − 1.5 IQR were excluded from further analysis. miRNA-arm and isomiR sequences that were expressed (expression value ≥ 5) in at least 85% of the samples in at least one of the cell types were normalized using DESeq2 (39). Normalized counts were checked for potential confounding effects such as age, gender, cell counts, cell purity, levels of hematocrit, number of leukocytes and erythrocytes. The counts were then subjected to pairwise comparisons between different cell types or combined cell type groups. The P-values resulting from Wald tests were corrected for multiple testing according to Benjamini and Hochberg (40). The miRNAs with a corrected P-value ≤ 0.001 and |log2FC| > 1 were considered to be significantly differentially expressed. The miRNAs which were uniquely significantly upregulated in one of the cell types when compared to every other cell type were called as being cell type specific miRNAs. In order to determine the genomic context of cell type specific miRNAs, the Ensembl API was used to retrieve annotated features (introns, exons and UTRs of coding and non-coding transcripts) that overlapped miRNA precursors. The miRNAs that did not intersect any transcript features were considered as intergenic. Furthermore, miRNA profiles from cell types were qualitatively compared with those from whole blood samples, serum and exosomes.
Statistical analyses and data processing were done in R version 3.3.3 (41). Visualization of graphs and heatmaps was performed with ggplot2 (42) and ComplexHeatmap (43) packages, respectively.
Detection of novel miRNAs
In order to detect novel miRNAs, raw sequencing reads from all samples were pooled into a single file to increase the power of prediction (44). Subsequently, pooled data were trimmed for adapters using cutadapt v1.3 and collapsed to obtain unique sequences while saving the information about read counts. The resulting data were mapped and filtered against spike-ins, viral genomes (RefSeq (45)), viral miRNA precursors (miRBase v21 (2)) and other human small RNAs (rRNAs, tRNAs, snRNAs and sRNAs (Rfam (46)) using BLASTN v2.2.30 (47). The remaining reads were mapped to the human genome (version hg19) using Bowtie v1.1.1 (48) and only those reads that mapped to the reference genome were passed down for novel miRNA prediction employing miRDeep2 v2.0.07 (49) with default parameters and as input for related species using known miRNAs from Hominidae family (miRBase v21). In order to reduce the number of false positively predicted miRNAs, several filtering steps were applied to remove: (a) novel miRNA candidates with miRDeep2 score < 1; (b) predicted precursors, which overlapped with human coding sequences (CDS) and non-coding RNAs (ncRNAs) (reference genome version hg38, Ensembl (50)); (c) novel miRNA precursors which were enriched with repetitive DNA element sequences from Dfam (51); and d) predicted miRNAs, which had outlying values based on quantiles (lower quantile = 0.01, upper quantile = 0.99) of GC content of known miRNA mature sequences belonging to Hominidae family (miRBase 21). Filtered novel miRNA candidates were ranked according to their distance to the features in the early miRBase (v1–v7) versions using novo-miRank (52).
Sample-wise quantification of candidate novel miRNAs was performed using quantifier.pl module from mirDeep2 v2.0.07 with default parameters. Normalization and statistical analysis of novel miRNA candidate count dataset was performed as described in the previous section.
Web-page implementation
To make our results easily accessible to researchers in the field, we implemented a web-tool for interactive browsing of miRNA expression results of peripheral blood cell populations. It contains miRNA-arm and isomiR expression data which can be explored by cell type or by miRNA of interest. The differential expression analysis can be performed in real time by selecting different cell types or combined cell type groups for pairwise comparisons. The web-tool was implemented using shiny web application framework for R (53), as well as R packages such as DESeq2 (39), dplyr (54), plotly (54) and iheatmapr and is available at http://134.245.63.235/ikmb-tools/bloodmiRs.
RESULTS
Overview of the small RNA transcriptome data
Illumina deep sequencing was conducted to profile miRNA expression in major peripheral blood cell populations, as well as serum, exosomes and whole blood of healthy individuals. We used magnetic activated cell sorting (MACS) to purify blood cells (see Figure 1) from the lymphoid lineage (CD56+ (NK cells), CD19+ (B cells), CD8+ (cytotoxic T cells), CD4+ (T helper cells)) and the myeloid lineage (CD14+ (monocytes), CD15+ (neutrophils) and CD235a+ (erythrocytes)). Purity of the sorted cells was tested using FACS analysis. Most cell populations were rather homogeneous with purity over 90%. Neutrophils, however, displayed considerable heterogeneity with a mean sorting purity of 79% (see Supplementary Figure S1A). Overall, 298 samples were sorted; however, we failed to sort erythrocytes for three samples, and T helper cells for one sample.
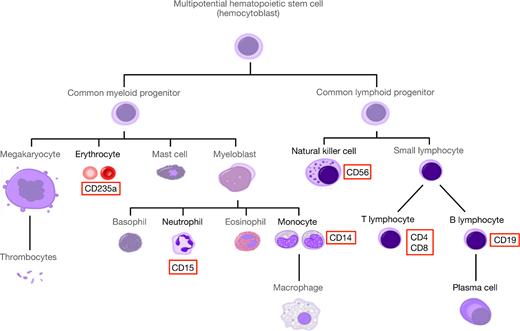
Simplified human hematopoietic tree of different cell compounds (modified from Häggström (69)). The miRNA expression profiles were generated for natural killer (NK) cell (CD56+), B lymphocyte (CD19+), cytotoxic T cell (CD8+), T helper cell (CD4+), monocyte (CD14+), neutrophil (CD15+) and erythrocyte (CD235a+) populations (highlighted in red).
Subsequent total RNA isolation and small RNA sequencing of the above-mentioned cell fractions and blood compounds resulted in approximately 2.56 billion (B) raw sequencing reads, ranging from 212.7 thousand (K) to 32.7 million (M) reads per sample (Supplementary Figure S1B). This wide range in the raw sequences was expected and could occur due to individual variability (health, blood counts etc. of the donor) and due to variability in experimental factors such as different RNA isolation methods (i.e. mirVana, PAXgene, miRNeasy etc.), and/or different amounts of small RNAs in distinct blood compounds, which lead to unequal adapter dimer contamination and unequal spike-in distribution when preparing libraries (55).
After the adapter and quality trimming step, we retained 91.3% (2.34B) of the initial sequencing reads, which shows the high quality of the dataset. The bulk of those reads were 19–24 nt length which corresponds to the length range of mature miRNA sequences (Supplementary Figure S1C). The filtering steps (see Methods section for details) retained 81.4% (2.09B) of the initial sequencing reads. The majority of filtered reads belonged to human non-miRNA short RNAs from Rfam database (Supplementary Figure S1D). The remaining high quality reads were mapped to known miRNA (miRBase v21) and spike-in sequences (see Materials and Methods section for details). The overall composition of the initial reads per sample in distinct blood compounds is presented in Supplementary Figure S1E. Quantification of filtered reads yielded 719.4M sequences to be mapped to 2106 unique known miRNA sequences from miRBase v21. As expected, the lowest numbers of miRNA counts were observed in transcriptionally non-active blood compounds such as RBCs, exosomes and serum (Supplementary Figure S1F). However, low miRNA read counts were also observed in neutrophils (CD15+) which was probably due to the lower cell sorting purity. After applying our QC threshold, 19 low read and/or outlying samples were removed, leaving 431 samples for downstream analysis. On average, we mapped 540 unique miRNA species per peripheral blood cell type, 162, 267 and 645 unique miRNA species per exosomes, serum and whole blood, respectively (Supplementary Figure S1F).
Sequencing and mapping statistics for all libraries used in this study can be found in Supplementary Table S1.
Anucleate blood harbors a substantial miRNA repertoire
Triggered by earlier reports about miRNAs being also present in RBCs (25, 27), we first qualitatively characterized the RBC miRNA content. Only miRNAs having at least five reads in at least 85% of the samples were considered in our analysis. Surprisingly, as anucleate cells should not be transcriptionally active, we identified 271 miRNA species within RBCs—several of them with considerable read counts (>1000/sample, see also Figure 2). In addition, we generated miRNA data from serum samples (n = 38) and exosomal vesicle preparations for 38 samples (34 of which are paired samples) of healthy donors, which resulted in another 90 and 51 miRNA species, respectively. When comparing the miRNA content of RBCs to those of serum and exosomes, we found a considerable overlap between all three fractions pointing towards a common miRNA repertoire of those blood compounds. We found 38 miRNA species present commonly in serum, exosomes and RBCs, whereas 19 miRNA species were found to be uniquely present in serum, 2 and 21 miRNA species in exosomes and RBCs, respectively (Figure 2). In total, we were thus able to detect 93 unique miRNA species outside the transcriptionally active cellular components of healthy human blood.
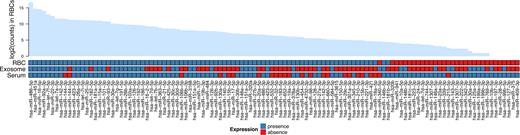
The presence of miRNAs in erythrocytes (RBCs), exosomes and serum. The barplot shows the log2 transformed median read counts of the most abundant miRNAs in RBCs. The heatmap represents presence (blue) or absence (red) of miRNAs in specific blood compounds. Only the miRNAs which were detected (expression value > 5) in at least 85% of the samples in at least one of the blood compound were considered as being present.
Sequence variation analysis reveals lineage specific 3′ end modification patterns of isomiRs
The growing evidence of constitutive variability in miRNA biogenesis across human tissues encouraged us to examine the sequence variation patterns of mature miRNAs within different peripheral blood compounds. Accordingly, we used mirAligner to identify trimming variations at the 5′ and 3′ ends, nucleotide (nt) substitutions and non-templated 3′ additions in miRNA sequences. In order to avoid sequencing errors, we consider a mismatch as a real substitution, when the fraction of reads having that substitution was >2% within the mapped reads to a certain miRNA sequence. Additionally, we only kept those substitutions which mapped uniquely to one miRNA molecule.
By comparing miRNA sequences obtained from our dataset to the archetype sequences deposited in miRBase, we identified sequence variations in 69.0% (1454/2106) of detected miRNAs. The most common miRNA sequence variation types were non-templated 3′ addition and 3′ trimming, which were observed in 77.0% (27539/35769) and in 75.6% (27032/35769) of isomiR sequences, respectively. Conversely, 5′ trimming (33.6%, 12025/35769) and nt-substitutions (6.2%, 2229/35 769) within the mature miRNA sequence were the least common variants. About one third (33.9%, 755/2229) of nt-substitutions occurred in the seed sites of miRNAs. More than one type of sequence variation was observed in 74.0% (26482/35769) of isomiRs.
To get deeper insights into isomiR variation preferences, we looked at variation distributions in our investigated blood compounds. The unique miRNA sequences having 5′ trimming variations were similarly distributed across the blood compounds, except that in neutrophils (CD15+), serum and exosomes this variation at position –1 with respect to reference sequences was more prevalent than in other cell types (Figure 3A). Surprisingly, 3′ trimming distributions showed clear lineage-specific patterns across the cell types. The frequency of unique sequences having 3′ trimming modification at positions –3 and –2 was higher in lymphoid than in myeloid lineage, whereas from position –1 to 3 it changed, and unique sequences having 3′-trimming variation became more abundant in the myeloid lineage. Meanwhile, the 3′ trimming distributions in serum and exosomes showed similar patterns, and in most of the positions were distinct from RBCs and whole blood samples (Figure 3B). The nt-substitutions were distributed similarly across the blood compounds, except for serum at positions 1 and 4 and for exosomes from position 12 to 14. Interestingly, the overall distribution of substitutions within miRNA sequences revealed a consistent pattern of positions in which nucleotides are less frequently substituted, pointing toward the nucleotides which are the most important in the base-pairing during miRNA–target interaction, i.e. the ones within the seed site (2–8 nt) of miRNAs (Figure 3C). The fractions of unique sequences having 3′ non-templated nucleotides were similar in neutrophils (CD15+), RBCs, serum and exosomes. Unique sequences having this modification were highly frequent at position 1 and vice versa at position 2 of the above-mentioned compounds when compared to all the others (Figure 3D).
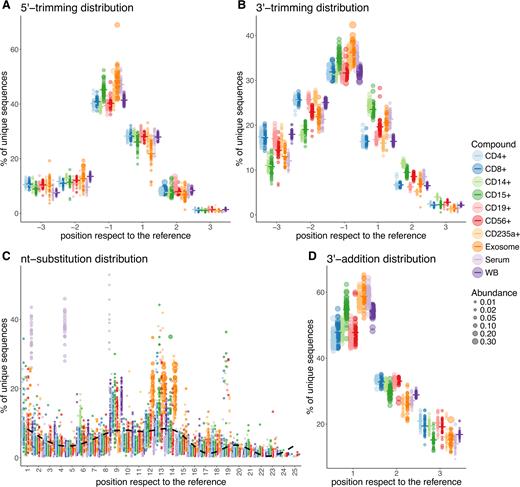
The distributions of isomiR modification types across different blood compounds. (A) 5′ end trimming modification distribution; (B) 3′ end trimming modification distribution; (C) nucleotide substitution modification distribution; (D) 3′ end addition modification distribution. Each dot represents individual sample colored by group. The size of dots indicates the abundance which corresponds to the relative number of molecule copies per modification type and position present in a given sample. The dash (–) symbol indicates the mean frequency of unique sequences per group. The smoothing in figure C was performed using the generalized additive model (GAM) method.
We were interested to further explore whether the anucleate compounds such as RBCs, serum and exosomes could also share the similar composition of the added nucleotides, therefore we decided to look at the non-templated 3′ additions more closely. Remarkably, the composition of 3′ added nucleotides, the same as 3′ trimming preference, was lineage-specific. The composition of non-templated nucleotide additions clustered into three distinct groups, corresponding to myeloid lineage, lymphoid lineage and non-cellular blood compounds, including serum and exosomes (Figure 4). These results suggest that most of the RBC-miRNAs probably originate from RBCs (or their progenitors) and that the majority of miRNAs found in serum and exosomes are not the products of hemolysis.
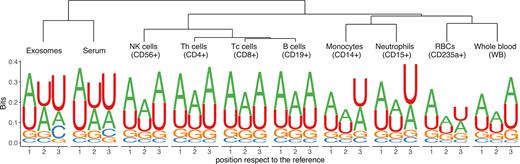
The composition of 3′ added nucleotides across the blood compounds. A hierarchical average linkage clustering was used to generate a dendrogram based on relative frequencies of bases per position of the unique sequences, which then were visualized as sequence logos.
Differential expression analysis identifies blood cell specific miRNA transcription signatures
To determine whether miRNA expression profiles (precisely miRNA-arms) could distinguish cell types, we first performed multidimensional scaling analysis which revealed a consistent clustering within and between cell types with only a very small proportion of outliers (see Figure 5). Even the distinction of lymphoid and myeloid blood cells is clearly visible with the red blood cell fraction forming a separated cluster. Also, the already mentioned heterogeneous neutrophil cells form a consistent cluster pointing towards a consistent sorting result.
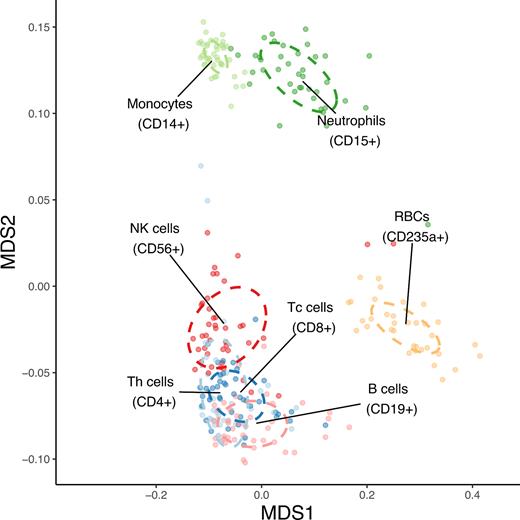
The similarity structure of human blood cell miRNA transcriptomes. MDS plot showing three clearly resolved clusters corresponding to lymphoid cells (NK cells, B cells, T cells and Th cells), myeloid cells (monocytes and neutrophils) and anucleate erythrocytes. The analysis was performed on miRNA count data using Spearman's correlation distance (1 – correlation coefficient). The dots represent samples coloured by group, while the centre of ellipses corresponds to the group mean and the shapes are defined by the covariance within group.
Analysing the repertoire of previously known miRNAs listed in miRBase v21, 382 of the currently annotated 2578 miRNAs were found to be expressed in >85% of the samples in at least one of the cell types. Pairwise differential expression analysis between different cell types revealed 224 of the 382 arms being significantly differentially expressed (FDR corrected P-value < 0.001; |log2FC| > 1) between the two major blood cell lineages (lymphoid versus myeloid). We excluded the RBC data from this expression analysis, as RBCs per definition are anucleate and do not express genes. As depicted in Figure 6A, 77 out of 224 differentially expressed miRNAs are up-regulated in lymphoid cells, whereas 167 miRNAs are up-regulated in the myeloid lineage. Furthermore, by focusing on the subtypes of lymphoid and myeloid cells, we found that 149 miRNAs were significantly different between natural killer cells (CD56+) and small lymphocytes (CD4+, CD8+ and CD19+), 119 miRNAs between T-lymphocytes (CD4+ and CD8+) and B-lymphocytes (CD19+) and 193 between CD14+ and CD15+ cells. For more details reference is made to http://134.245.63.235/ikmb-tools/bloodmiRs.
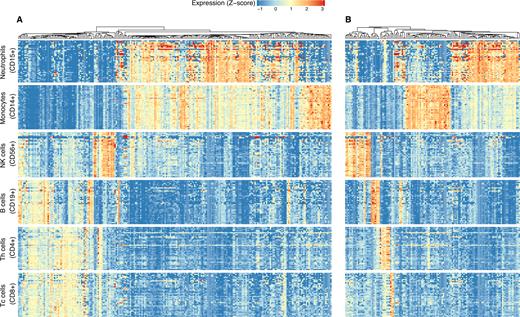
(A) Differentially expressed miRNAs between lymphoid and myeloid cell lineage; (B) expression levels of blood cell lineage-specific miRNAs. Each row of the heatmaps represents a sample corresponding to the one of the blood cell types, and each column represents an individual miRNA-arm. All miRNAs were statistically differentially expressed (FDR ≤ 0.001 and |log2FC| > 1). The Z-score in the heatmaps represents standardized normalized expression values. The unsupervised (agglomerative) hierarchical clustering of miRNAs was performed using Spearman's correlation distance (1 – correlation coefficient) as metric and average linkage clustering as linkage criterion.
We next focused on miRNAs that were significantly higher expressed in one given cell type when compared to every other cell type (see Figure 6B). Those miRNAs could be considered part of the cell type-specific miRNA-arm expression signature. Of the 382 miRNAs that were expressed in at least one of the investigated cell types, 136 miRNAs followed the above pattern (FDR corrected P-value < 0.001 and log2FC > 1). For CD4+ (T helper cells), CD8+ (cytotoxic T cells), CD19+ (B cells) and CD56+ (NK cells) we identified 9, 3, 10 and 18 specific miRNAs, respectively, whereas for CD14+ (monocytes) and CD15+ (neutrophils) we detected 25 and 50 specific miRNAs, respectively. The majority of these miRNAs were derived from intronic regions of protein coding genes. Genomic context and miRNA family information of cell type specific miRNA-arms can be found in Supplementary Table S2.
To get an overview on miRNAs that are present in human blood but have not been covered by our cell sorting approach, we additionally generated miRNA expression data for whole blood samples. We found 417 miRNAs that were expressed in 85% of the samples in at least one of the cell types or whole blood samples. Compared to the above-mentioned 382 miRNA species of the cell type specific datasets, we detected additional 35 miRNAs which are either specific for other blood cell types or originate from other sources (Supplementary Table S3).
Distinct isomiRs yield higher cell type specificity than miRNA-arms
Taking into consideration that isomiRs can make a significant contribution to miRNA representation, we repeated the pairwise differential expression analysis between different cell types and/or cell type groups by using isomiR counts. Applying the previously described threshold, we identified 2538 expressed isomiRs arising from 309 distinct miRNA-arms. Pairwise comparison between lymphoid and myeloid lineages revealed 1862 differentially expressed isomiRs deriving from 281 arms, 912 of those isomiRs being up-regulated and 950 being down-regulated. Analogous comparisons of the subtypes of lymphoid and myeloid cells displayed 1204 (derived from 211 miRNA-arms) differentially expressed isomiRs between natural killer cells (CD56+) and small lymphocytes (CD4+, CD8+ and CD19+), 773 (from 179 arms) isomiRs between T-lymphocytes (CD4+ and CD8+) and B-lymphocytes (CD19+) and 1420 (from 246 arms) between CD14+ and CD15+ cells. For detailed information reference is made to http://134.245.63.235/ikmb-tools/bloodmiRs.
As expected, when looking at higher resolution we were able to detect considerably higher number of cell type specific isomiRs than by looking only at the miRNA-arms. In total, we identified 800 isomiRs which were uniquely significantly up-regulated in one of the cell types when compared to every other cell type. For lymphoid lineage CD4+ (T helper cells), CD8+ (cytotoxic T cells), CD19+ (B cells) and CD56+ (NK cells) we identified 31, 5, 57 and 212 cell type specific isomiRs, respectively, whereas for myeloid lineage CD14+ (monocytes) and CD15+ (neutrophils) cells we detected 206 and 289 cell type specific isomiRs, respectively (Supplementary Figure S2). The number of identified isomiRs per cell type was highly correlated with the number of identified cell type specific miRNA-arms (Pearson's r = 0.9).
Modification types of cell type specific isomiRs were similarly distributed as in the general population of identified isomiRs. The most common were 3′ trimming and 3′ addition modifications, and the least common were 5′ trimming and nucleotide substitutions (Table 1). Interestingly, on average, only ∼56% of isomiRs per cell type were arising from previously identified cell type specific miRNAs, meaning that the rest were not captured when only looking at the miRNA-arm level. The complete list of cell type specific miRNA-arms and isomiRs identified in this study is provided in Supplementary Table S4.
Summary of cell type specific isomiRs modification types
| Cell type | Number of isomiRs | 5′-trimming isomiRs | Seed substituted isomiRs | 3′-trimming isomiRs | 3′ nt-added isomiRs | nt-substituted isomiRs | Multi-modified isomiRs |
|---|---|---|---|---|---|---|---|
| Monocytes (CD14+) | 206 | 44 (21.4%) | 1 (0.5%) | 112 (54.4%) | 82 (39.8%) | 1 (0.5%) | 70 (34%) |
| Neutrophils (CD15+) | 289 | 52 (18%) | 0 (0%) | 166 (57.4%) | 142 (49.1%) | 4 (1.4%) | 99 (34.3%) |
| B cells (CD19+) | 57 | 7 (12.3%) | 0 (0%) | 42 (73.7%) | 39 (68.4%) | 0 (0%) | 32 (56.1%) |
| T helper cells (CD4+) | 31 | 0 (0%) | 0 (0%) | 26 (83.9%) | 15 (48.4%) | 0 (0%) | 14 (45.2%) |
| NK cells (CD56+) | 212 | 52 (24.5%) | 0 (0%) | 161 (75.9%) | 135 (63.7%) | 0 (0%) | 136 (64.2%) |
| Cytotoxic T cells (CD8+) | 5 | 0 (0%) | 0 (0%) | 4 (80%) | 1 (20%) | 0 (0%) | 1 (20%) |
| Total | 800 | 155 (19.4%) | 1 (0.1%) | 511 (63.9%) | 414 (51.7%) | 5 (0.6%) | 352 (44%) |
Identification of novel, blood cell specific miRNAs
In addition to measuring the expression of known miRNAs, we also investigated whether novel miRNAs are hidden in the generated sRNA-Seq data. For that purpose, pooled data for each blood cell type were analyzed using the de novo prediction functionality of miRDeep2. Overall, we obtained 716 novel miRNA candidates predicted by miRDeep2. After removing false positives and performing several filtering steps (Supplementary Figure S3), we retained 413 most probable novel miRNA candidates and ranked the sequences according to their similarity of known miRNA features using novo-miRank. Of these 413 novel miRNA candidates, 52 molecules shared the same seed sequence with known miRNAs from the taxonomic family of primates (Hominidae). Characteristics such as genome context (intronic, UTR or intergenic), nucleotide composition, minimum free energy (MFE) structure etc. of the novel candidates are provided in the Supplementary Table S5. Additionally, precursor structures, read signatures and prediction scores of novel candidates are provided in the Supplementary File S1. Moreover, 50 out of 197 common novel miRNAs were validated by the hybridization method in recent study by Fehlmann et al. (56).
Next, we focused on differential expression of novel miRNAs in cell types and quantified novel miRNA candidates in a sample-wise manner. We detected 76 out of 413 candidates in at least 85% of the samples in at least one cell type, and 26 of those were identified as cell type specific (Supplementary Figure S4). Interestingly, with our thresholds, unlike in previous reports, we were not able to identify novel miRNA candidates within the RBC fraction.
DISCUSSION
Most sRNA-based biomarker studies today investigate archetype miRNA or miRNA-arm expression in either serum, exosomes or whole blood, while only a small number of studies focus on sub-compartments of blood, such as the peripheral mononuclear cell fraction (PBMCs) or even single cell types. Moreover, even fewer studies are focusing on isomiR expression in the aforementioned compounds. Nearly all studies, including our own, report differentially expressed miRNAs characteristic for a certain condition or a disease, but in most of the cases it is not further investigated what are the variations in their sequences, and which tissues or cell types contribute to the expression pattern. The herein presented detailed miRNA expression catalogue for different cellular and non-cellular components of healthy human peripheral blood enables the researcher to assign expression-signatures of single or groups of miRNAs and isomiRs to cell types and, thus, gather hypotheses about putative functionality of the respective miRNA (or its predicted target genes) in the study context. While previous reports on miRNAs in sorted human blood cells are mostly based on very few samples (n ≤ 5, see below) or focused on developmental aspects such as hematopoiesis (57), a comprehensive miRNA expression catalogue for a broad range of mature blood cell types currently only exist for mice (58). Moreover, all of the mentioned studies were focusing only on archetype miRNAs and did not explore the sequence variations and modifications of mature miRNAs.
Given our data, we were able to detect a substantial number of miRNAs outside transcriptionally active blood compounds. We identified 271 known miRNA species within RBCs. The results of a paper by Doss et al. (27) are nicely mirrored in our RBC profiles, although we are able to expand the catalogue of highly abundant miRNAs in RBCs with the most abundant miRNAs being present with median read counts >1000 reads per sample.
Analysis of miRNA sequence heterogeneity showed that a vast majority of mature miRNAs, which were found to be expressed in the peripheral blood compounds, are carrying different and often composite sequence modifications. Within our dataset, we identified sequence variations in 69.0% of detected miRNAs. As already indicated by previous studies in various human tissues, 3′-end modifications were the predominant category (10,13,59–61).
Comparing the distributions of different types of miRNA modifications across the studied blood compounds, we found that 3′ trimming modifications were distributed in a lineage-specific manner – the closer the hematopoietic progenitors are, the higher are their similarities in the preference of 3′ trimming modification. This phenomenon was not observed in 5′ trimming distributions of isomiRs sequences, where the frequencies of modification were distributed similarly across the cell types, except for neutrophils (CD15+) and RBCs (CD235a+) in which the isomiRs having earlier trimmed nucleotide were more frequent than in another cell types. Similar findings of 5′ trimming preference were observed in serum and exosomes. These results support the assumption that, in contrast to isomiRs with 3′ variability, 5′ isomiRs because of seed-shifting have effects on target selection and the choice of miRNA-5p/-3p strand for AGO binding (12,18), and possibly due to that, the intra-group variability of 5′ sequence variation is lower than in the 3′ end.
One particularly interesting finding is that the overall distribution of nt-substitution modification within isomiR sequences showed a consistent pattern of positions in which the nucleotides are less frequently substituted, thus, highlighting the nucleotides at positions 2–8 (seed site) and 15–19, respectively, which are known to be important for target site recognition (62,63). All together this explains the reduced heterogeneity at those sites.
Another surprising observation relates to our finding that compositions of 3′ added non-templated nucleotides in the blood compounds are also lineage-specific. The frequencies of non-templated nucleotides clustered into three main groups, corresponding to myeloid, lymphoid and non-cellular compartments (serum and exosomes). Non-templated additions of isomiRs found in whole blood clustered together with RBCs, which is meaningful because RBCs are the most abundant cells in blood. It is worth pointing out that 3′ end uridylated isomiRs are relatively more common in serum and exosomes than in cells—this finding is consistent with results by Koppers-Lalic et al., where they showed that 3′ end adenylated miRNAs are relatively enriched in B-lymphocytes, whereas 3′ end uridylated isoforms appear overrepresented in exosomes (30). Another study by Gutiérrez-Vázquez et al. demonstrated that 3′ addition of uridine promotes degradation of these uridylated miRNAs after T-lymphocytes activation (31). Moreover, it has been reported that non-templated nucleotide additions can affect miRNA stability, target identification and targeting power (30,60).
Several recent studies already reported miRNA expression data on single blood cell types, such as natural killer cells (64), B-lymphocytes (65), T-lymphocytes (29) and RBCs (27). Two other projects screened the miRNA-transcriptome using microarray technology in several blood cell types (26,28). Comparing the results of both studies to our miRNA-arm expression data, the previously reported cell type specific miRNA signatures could only be partially confirmed, as many miRNAs previously reported to be cell type specific are actually found in other blood cell types in our data. All of six cell type specific miRNAs from Allantaz et al. were confirmed within our dataset (26). The miRNA profile of monocytes and B-cells reported by Leidinger et al. were also completely verified by our findings. The other profiles (T-cells, NK-cells and granulocytes), however, contained only about half of cell type specific miRNAs that could be confirmed in our data. These differences most probably arise from distinct miRNA profiling platforms (66) or even different blood cell purification techniques (67). In addition, our data complements the already known miRNA profiles with numerous other miRNAs, previously unknown to be specific for certain blood cell types. The same holds true for studies investigating only a single blood cell type. Although these reports do not compare different cellular blood compounds, but rather cells in activated and resting states, thus, they do not report cell type specific miRNAs; however, a considerable fraction of the named miRNAs is reflected by our cell type specific profiles. As nearly one half of miRNAs that have previously been reported to be cell type specific are actually present in more than one cell type in our data, the best explanation for these discrepancies is the sample size and profiling platform. All recent studies were conducted on n ≤ 5 samples using microarrays compared to n > 40 samples using NGS in our case, which increases the statistical power substantially and overcomes possible inter-individual variability.
Finally, we determined cell type specific isomiRs of the human peripheral blood cells. In comparison to miRNA-arms, we found a substantially higher number of cell type specific isomiRs. The modification types of these molecules were commonly distributed as in the general isomiR population. An interesting observation is that almost a half of cell type specific isomiRs were arising from miRNA-arms which previously, in our dataset, were not assigned as cell type specific, showing that a big proportion of molecules is diluted when looking only at the miRNA-arm level. However, up to now there are no reports referring to differential expression of isomiRs within different blood cells, thus making it impossible to compare and draw conclusions about these results.
Taken together, we do not claim that our results are exhaustive or cover the entire miRNA-repertoire of healthy human blood, but they provide the most comprehensive contribution to date (with n > 40 individuals) toward a complete miRNA inventory of human peripheral blood. Upcoming reports from bigger research initiatives such as the international human epigenome program (68) will hopefully amend the data with additional cell types and more exhaustive data on miRNA and especially, on isomiRs in circulation and exosomes. Moreover, recent technological developments enabling analyses on the single-cell level will—as soon as they are applicable for miRNA analysis—likely also make a significant contribution towards completing the miRNA map of human blood.
AVAILABILITY
The web-tool is available at http://134.245.63.235/ikmb-tools/bloodmiRs.
ACCESSION NUMBERS
Raw sequencing reads and quantified read-count data have been deposited at NCBI Gene Expression Omnibus (GEO) (36) under the accession number GSE100467.
SUPPLEMENTARY DATA
Supplementary Data are available at NAR Online.
FUNDING
DFG Excellence Cluster ‘Inflammation at Interfaces’ [EXC306]; Medical Faculty of Kiel University. Funding for open access charge: DFG Excellence Cluster ‘Inflammation at Interfaces’ [EXC306].
Conflict of interest statement. None declared.
REFERENCES
Author notes
These authors contributed equally to this work as first authors.

Comments