


Abstract
Ribonuclease P (RNase P) is an essential endonuclease that catalyzes the 5′ end maturation of precursor tRNA (pre-tRNA). Bacterial RNase P is an attractive potential antibacterial target because it is essential for cell survival and has a distinct subunit composition compared to the eukaryal counterparts. To accelerate both structure-function studies and discovery of inhibitors of RNase P, we developed the first real-time RNase P activity assay using fluorescence polarization/anisotropy (FP/FA) with a 5′ end fluorescein-labeled pre-tRNAAsp substrate. This FP/FA assay also detects binding of small molecules to pre-tRNA. Neomycin B and kanamycin B bind to pre-tRNAAsp with a Kd value that is comparable to their IC50 value for inhibition of RNase P, suggesting that binding of these antibiotics to the pre-tRNA substrate contributes to the inhibitory activity. This assay was optimized for high-throughput screening (HTS) to identify specific inhibitors of RNase P from a 2880 compound library. A natural product derivative, iriginol hexaacetate, was identified as a new inhibitor of Bacillus subtilis RNase P. The FP/FA methodology and inhibitors reported here will further our understanding of RNase P molecular recognition and facilitate discovery of antibacterial compounds that target RNase P.
INTRODUCTION
In the maturation pathway for transfer RNA (tRNA), the cleavage of the 5′ end leader from precursor tRNAs (pre-tRNAs) is catalyzed by ribonuclease P (RNase P) (1,2). RNase P also catalyzes cleavage of various non-tRNA substrates (3) including pre-4.5S RNA (4), pre-tmRNA (5), mRNAs (6–8) and riboswitches (9,10). In most organisms, RNase P is a ribonucleoprotein consisting of a single catalytic RNA subunit (P RNA) and variable numbers of protein subunits depending on the organism (1 in Bacteria, ≥4 in Archaea and ≥9 in Eukarya nuclei) (11). Recently, solely protein-based RNase P enzymes have been identified in human mitochondria (12), the plant Arabidopsis thaliana (13,14), and some algae and protists (15,16). Because of its essential role in RNA processing and the differential subunit composition from its eukaryal counterparts, bacterial RNase P is a potential antibacterial drug target (17,18).
Several reported inhibitors of Escherichia coli RNase P are well-known ribosomal antibiotics, including puromycin (IC50 ∼ 3 mM) (19), aminoglycosides (e.g. neomycin B, IC50 = 60 μM) (20), and neomycin B derivatized with arginine, lysine or guanidinium moieties (IC50 values ranging from 0.1 to 6 μM) (21,22). The usefulness of these aminoglycoside derivatives in vivo may be limited by their high positive charge that may lead to promiscuous binding to nucleic acids. Aminoglycosides are also weak non-competitive inhibitors of eukaryal RNase P (Ki = 143 μM for neomycin B to Dictyostelium discoideum RNase P) (23). A number of synthetic compounds, including bis-benzimidazoles (IC50 = 5–21 μM) (24), porphines and porphyrins (Ki = 1–4 μM) (25), inhibit E. coli RNase P activity mainly through binding to pre-tRNA. Spiramycin, a macrolide antibiotic, was reported to activate the steady-state turnover catalyzed by E. coli RNase P (26). Recently, a small molecule has been suggested to bind to the protein component of Staphylococcus aureus RNase P (RnpA) to alter mRNA turnover and pathogenesis (27). Virtual screening of the ZINC database (28) has proposed additional inhibitors of RNase P that function by disrupting interactions between the pre-tRNA substrate and the P protein subunit (18). Inhibitors of RNase P have also been designed using an antisense approach, targeting P RNA for E. coli and Bacillus subtilis RNase P (IC50 = 2 nM–1 μM) (29–32). However, the antisense nucleic acids have to be conjugated with invasive peptides to enter bacterial cells and target RNase P in vivo (32). To further evaluate bacterial RNase P as a viable drug target, more potent and specific inhibitors of bacterial RNase P need to be discovered and characterized.
Conventional methods for measuring RNase P activity and inhibition mainly analyze cleavage of 32P-labeled pre-tRNAs using denaturing polyacrylamide gel electrophoresis and phosphorimager quantification (20). These radiochemical assays are discontinuous, labor-intensive and relatively low-throughput. Fluorescence techniques provide an attractive non-radioactive approach to measure RNase P activity. Previously, substrate binding and transient kinetics of B. subtilis RNase P have been measured using a fluorescein-labeled pre-tRNAAsp (33–35). The sensitivity and signal dynamic range of this assay are sufficient for single-turnover (STO) experiments but not for measuring steady-state kinetics (34). Furthermore, bacterial RNase P activity has been measured by fluorescence polarization (FP) using hybridization of fluorescently labeled oligonucleotides to the cleaved 5′ leader product in a discontinuous format (36). To accelerate the identification and analysis of inhibitors of RNase P, a non-radioactive and real-time assay is desirable.
Here we describe the development of a real-time fluorescence polarization/anisotropy (FP/FA) assay for analyzing RNase P activity using a 5′ fluorescein-labeled pre-tRNAAsp substrate (Fl-pre-tRNAAsp (33), Figure 1). This FP/FA assay measures RNase P activity in a continuous format, and is suitable for high-throughput screening (HTS) of RNase P inhibitors, as well as detecting ligands that interact with pre-tRNA. To validate this FP/FA assay, we measured inhibition of B. subtilis RNase P by two previously reported E. coli RNase P inhibitors, neomycin B (NeoB) and kanamycin B (KanB) (20), demonstrating IC50 values in the micromolar range. The FP/FA assay also indicates that both of these inhibitors bind to pre-tRNA with micromolar affinity, suggesting that inhibition of RNase P is at least partly due to binding to the substrate. Finally, we used this assay for a pilot high-throughput screen for RNase P inhibitors and identified a new in vitro inhibitor of B. subtilis RNase P, iriginol hexaacetate, with IC50 and Ki values in the nanomolar range. These data demonstrate that the FP/FA assay facilitates both analysis of pre-tRNA processing catalyzed by RNase P and screening for inhibitors of RNase P.
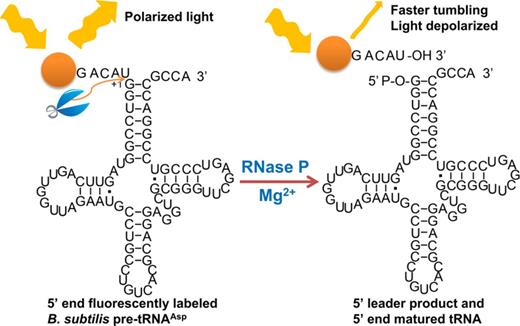
A fluorescence polarization/anisotropy assay for measuring RNase P-catalyzed pre-tRNA cleavage. A fluorescein dye (orange dot) is attached to the 5′ end of a Bacillus subtilis pre-tRNAAsp with a 5-nt leader (Fl-pre-tRNAAsp). When excited with polarized light, the Fl-pre-tRNAAsp tumbles slower than the lifetime of the fluorophore so that the emitted light remains polarized (high anisotropy). Upon cleavage of the 5′ end leader catalyzed by RNase P, the Fl-5nt-leader product rotates faster leading to enhanced depolarization of the emitted light (lower anisotropy).
MATERIALS AND METHODS
Chemicals and reagents
Nucleotide triphosphates (NTP), spermidine and other chemicals were obtained from Sigma at the highest purity unless otherwise indicated. Sodium dodecyl sulfate (SDS) and tRNAmix from baker's yeast were purchased from Fisher Scientific. Inorganic pyrophosphatase was purchased from Roche Applied Science. Guanosine 5′-monothiophosphate (GMPS) was synthesized from 2′, 3′ isopropylidene-guanosine and thiophosphoryl chloride as described (37). Recombinant His6-T7 RNA polymerase was expressed in E. coli and purified by Ni-NTA chromatography as described previously (38).
Preparation of RNA and P protein
The P protein and P RNA subunits of B. subtilis RNase P were prepared as previously described (39,40). Fl-pre-tRNAAsp containing a 5-nucleotide leader sequence (Figure 1) was prepared using procedures adapted from previous reports (33,35). Pre-tRNAAsp with a 5′ monothiophosphate terminus was transcribed in the presence of 4 mM adenosine triphosphate (ATP), cytidine triphosphate (CTP), uridine triphosphate (UTP), 4–5 mM GMPS and 0.8–1 mM guanosine triphosphate (GTP), 0.1 μg/μl T7 RNA polymerase, 0.8–1 μg/μl linearized DNA template, 1 mM spermidine, 5 mM dithiothreitol (DTT), 2 μg/ml pyrophosphatase, 50 mM Tris–HCl (pH 8.0) and 20–28 mM MgCl2, incubated at 37°C either overnight (20 mM MgCl2) or for 4–6 h with addition of 20 μM NTPs every 30 min (28 mM MgCl2). The transcribed 5′-GMPS-pre-tRNAAsp was buffer exchanged and concentrated using ≥3 iterations of centrifugal filtration (Amicon Ultra, 10 000 MWCO, Millipore Corporation) into a degassed labeling buffer [10 mM Tris–HCl, pH 7.2, 1 mM ethylenediaminetetraacetic acid (EDTA)] at 4°C and then incubated with 20- to 40-fold excess of 5-IAF (5-Iodoacetamido-fluorescein, Life Technologies) at 37°C overnight to obtain Fl-pre-tRNAAsp. Radiolabeled substrate was prepared by incubating pre-tRNAAsp with calf intestinal alkaline phosphatase New England Biolabs (NEB) followed by 5′ end-labeling using T4 polynucleotide kinase (NEB) and [γ-32P] ATP and purified as described (41). All RNAs were purified by electrophoresis on a 6% (P RNA) or 10% (pre-tRNAAsp) polyacrylamide/bis (39:1) denaturing gel containing 7 M urea. Excised RNA bands were soaked into buffer containing 10 mM Tris-HCl pH 8, 1 mM EDTA, 0.1% SDS, and 500 mM NaCl at 4°C overnight. Eluted RNA was filtered, concentrated and exchanged using centrifugal filtration into buffer containing 10 mM Tris-HCl pH 8, 1 mM EDTA and 500 mM NaCl and then ethanol precipitated for storage at −80°C. Before use, P RNA and pre-tRNAAsp were denatured by heating for 3 min at 95°C in autoclaved Milli-Q water and then refolded by incubating at 37°C for 10–15 min followed by addition of reaction buffer and incubation for at least 30 min. Then P protein was added to the P RNA for a 30 min incubation at 37°C to form the holoenzyme.
Single- and multiple-turnover experiments
The following buffers were prepared immediately before use for enzyme assays: Buffer A (50 mM Tris/MES pH 5.5, 10 mM MgCl2, 200 mM KCl, 20 mM DTT); Buffer B (50 mM Tris–HCl pH 7.2, 10 mM MgCl2, 100 mM KCl, 20 mM DTT); Buffer C (buffer B at pH 8); HTS buffer [similar to buffer B except for 5 mM MgCl2, 12 mg/ml yeast tRNAMix, 10 mM spermidine and 0.01% (v/v) nonidet P-40 (NP-40)]. The pH of stock buffer solution was measured at 25°C.
For gel assays, time points for the cleavage reaction catalyzed by RNase P were taken by diluting aliquots of the reaction into an equal volume of a quenching solution [10 M urea, 200 mM EDTA (pH 8.0), 0.005% (w/v) bromophenol blue and 0.005% (w/v) xylene cyanol] as described (41). The pre-tRNAAsp and 5′ leader product were separated using a 10% denaturing gel and visualized using a Typhoon phosphorimager. The percentage of cleavage was quantified by ImageQuant 5.2 or ImageJ software.
IC50 and mode of inhibition experiments
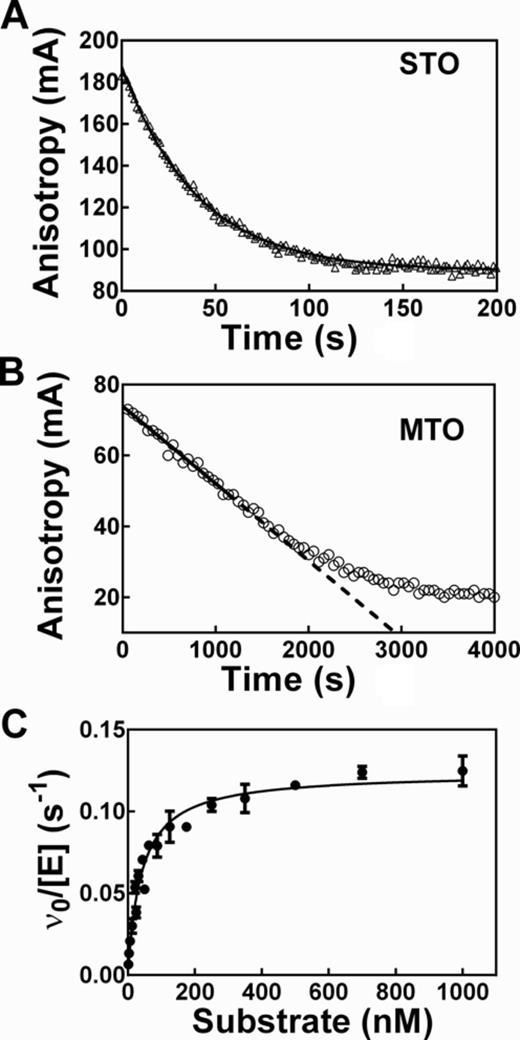
Measurement of pre-tRNA cleavage catalyzed by RNase P using fluorescence anisotropy (FA). (A) The time-dependent change in FA was measured under single-turnover (STO) conditions in buffer A ( 50 mM Tris/MES pH 5.5, 10 mM MgCl2, 200 mM KCl, 20 mM DTT) with 25 nM Fl-pre-tRNAAsp and 500 nM Bacillus subtilis RNase P holoenzyme at 37°C. The solid line is a single exponential fit to the data with kobs = 0.0250 ± 0.0002 s−1; when Equation (2) was used to adjust for the change in total florescence and Equation (1) was fit to the data, the kobs = 0.032 ± 0.001 s−1. (B) The time-dependent change in FA was measured under multiple-turnover (MTO) conditions in buffer C (50 mM Tris–HCl pH 8, 10 mM MgCl2, 100 mM KCl, 20 mM DTT) with 20 nM Fl-pre-tRNAAsp, 0.4 nM B. subtilis RNase P and 4 nM P protein at 37°C. Total fluorescence does not change for multiple turnover reactions. The steady-state cleavage velocity is measured from the linear initial rate (solid line). (C) Steady-state kinetic parameters were determined from the dependence of the MTO initial rate on substrate concentration. Reaction conditions are the same as in B except for varying RNase P (0.3–1 nM) and Fl-pre-tRNAAsp (2 nM–1 μM) concentrations. Results are from three independent experiments and the error bars are the standard deviations. The Michaelis–Menten equation was fit to the data yielding: kcat = 0.124 ± 0.003 s−1, KM = 40 ± 3 nM, kcat/KM = 3100 ± 200 mM−1s−1.

Neomycin B and kanamycin B inhibit Bacillus subtilis RNase P. Dose-response of RNase P inhibition was measured in buffer B (50 mM Tris–HCl pH 7.2, 10 mM MgCl2, 100 mM KCl, 20 mM DTT) with 50 nM Fl-pre-tRNAAsp and 0.4 nM RNase P with 4 nM P protein at 37°C. The concentrations for NeoB (•) and KanB (▪) that inhibit activity by 50% (IC50, Equation 5) are 23 ± 3 μM (n = 1.1 ± 0.1) and 52 ± 6 μM (n = 0.9 ± 0.1), respectively. In the presence of 12 mg/ml yeast tRNAMix, the IC50 values for NeoB (○) and KanB (□) are 110 ± 20 μM (n = 0.53 ± 0.05) and 2.2 ± 0.3 mM (n = 1.0 ± 0.2), respectively.
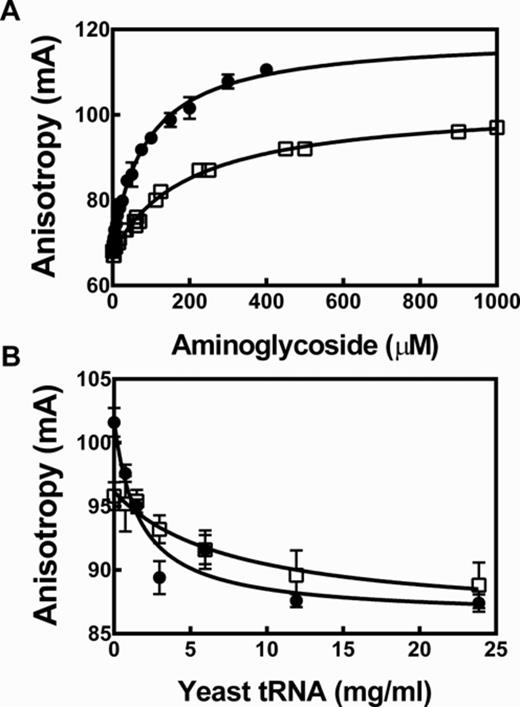
Neomycin B and kanamycin B bind to Fl-pre-tRNAAsp. (A) The FA of Fl-pre-tRNAAsp increases upon titration with NeoB (•) and KanB (□), measured in buffer B as described in legend of Figure 3 at 37°C with 50 nM FI-pre-tRNAAsp. The Kd values for NeoB and KanB are determined from a fit of Equation (8) to these data as 90 ± 5 μM and 220 ± 20 μM, respectively. (B) Yeast tRNAMix competes with Fl-pre-tRNAAsp for binding neomycin B and kanamycin B using either 200 μM NeoB (•) or 1 mM KanB (□) and varying concentrations of yeast tRNAMix in buffer B. Error bars show the standard deviations from five replicates.
![High-throughput FP assay is robust for screening inhibitors of Bacillus subtilis RNase P. (A) Reaction progress curves measured by quenching the reaction with 80 mM CaCl2 at specified time points in HTS buffer [50 mM Tris–HCl pH 7.2, 5 mM MgCl2, 100 mM KCl, 20 mM DTT, 12 mg/ml yeast tRNAMix, 10 mM spermidine and 0.01% (v/v) NP-40] with 1% DMSO, 20 nM FL-pre-tRNAAsp and 0.15 nM RNase P with 1.5 nM P protein at 30°C. The reactions contained either no inhibitor (1% DMSO blank, •) as a negative control or 80 mM CaCl2 (□) as a positive control for inhibition. Error bars are derived from 18–32 replicates in one 384-well plate. (B) The Z′- factor values for the FP HTS assay determined from each of the nine 384-well microplates in primary screen. (C) A scatter plot showing the percent inhibition by plate in the primary screen of the 2880 compound library. Positive controls including 80 mM CaCl2 in the assay are shown by red squares. Negative controls (1% DMSO) are blue. Compound samples are green. The red solid line indicates percent inhibition at three times the standard deviation of negative controls (3SD). The samples showing negative inhibition contain compounds interfering with fluorescence signal.](https://oup.silverchair-cdn.com/oup/backfile/Content_public/Journal/nar/42/20/10.1093_nar_gku850/1/m_gku850fig5.jpeg?Expires=1716409241&Signature=PZWLvBZrpWkyzKxKg425RU4cBwWxFbG4m0D~pCbes4vQqJUEWy2iafAGm40j5JN7Q3GmSFaBYXevVskJdB84vMA-KIpWsxE1GdRxkUWYakK7kiGS3JgRYu9ruUKoqECHudquheMKC~mvlzl3mKYACVa2MjQHGPmvXKIzFPRNJQUX4JZG28JMP8b7db7VXRoBl53ynAA49fafawjLLv8eBBPDvazHnStuU4~YgvzJ4U~pqyQNyD3cy1McVlbGifSNGedLaXHmv1ppnx8j2dzsrB8T5jXM2ts8TwFI~IU9IgSzMB7Ly1aDhW18TGIVJA1bD4JvNZR1RKALemaaDqU9jQ__&Key-Pair-Id=APKAIE5G5CRDK6RD3PGA)
High-throughput FP assay is robust for screening inhibitors of Bacillus subtilis RNase P. (A) Reaction progress curves measured by quenching the reaction with 80 mM CaCl2 at specified time points in HTS buffer [50 mM Tris–HCl pH 7.2, 5 mM MgCl2, 100 mM KCl, 20 mM DTT, 12 mg/ml yeast tRNAMix, 10 mM spermidine and 0.01% (v/v) NP-40] with 1% DMSO, 20 nM FL-pre-tRNAAsp and 0.15 nM RNase P with 1.5 nM P protein at 30°C. The reactions contained either no inhibitor (1% DMSO blank, •) as a negative control or 80 mM CaCl2 (□) as a positive control for inhibition. Error bars are derived from 18–32 replicates in one 384-well plate. (B) The Z′- factor values for the FP HTS assay determined from each of the nine 384-well microplates in primary screen. (C) A scatter plot showing the percent inhibition by plate in the primary screen of the 2880 compound library. Positive controls including 80 mM CaCl2 in the assay are shown by red squares. Negative controls (1% DMSO) are blue. Compound samples are green. The red solid line indicates percent inhibition at three times the standard deviation of negative controls (3SD). The samples showing negative inhibition contain compounds interfering with fluorescence signal.
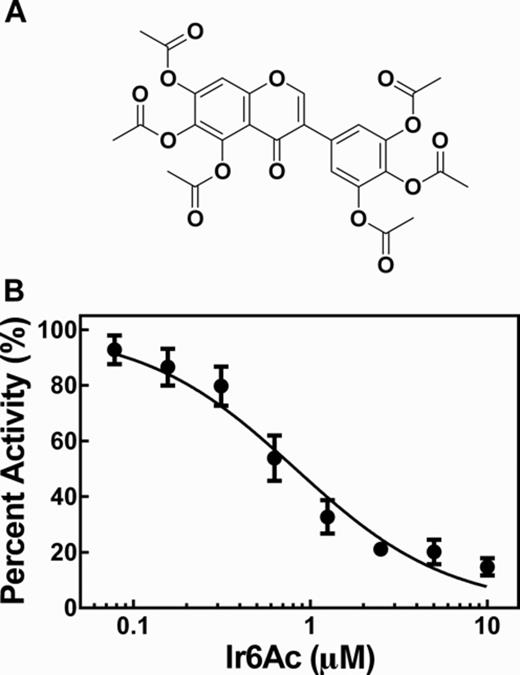
Iriginol hexaacetate inhibits Bacillus subtilis RNase P catalyzed cleavage. (A) Chemical structure of iriginol hexaacetate (Ir6Ac). (B) Dose-response curve of inhibition by Ir6Ac of MTO cleavage activity catalyzed by RNase P measured in HTS buffer with 50 nM Fl-pre-tRNAAsp and 0.1 nM B. subtilis RNase P with 2 nM P protein. Ir6Ac was pre-incubated with RNase P for 40 min at 37°C prior to initiation of reaction. IC50 is 820 ± 10 nM with a Hill coefficient of 1.0 ± 0.1.
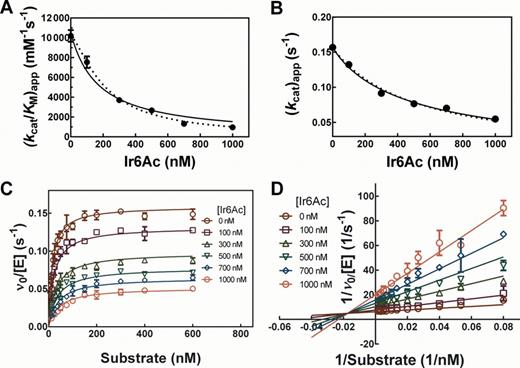
Mechanism of inhibition of Bacillus subtilis RNase P by Ir6Ac. The assays were carried out at a fixed RNase P concentration of 0.4 nM (2 nM P protein) with varying concentrations of Ir6Ac and Fl-pre-tRNAAsp in HTS buffer at 37°C. Ir6Ac was pre-incubated with RNase P for 40 min. (A and B) Fit of Equation (6) to the apparent kcat (A) and kcat/KM (B) values as a function of concentration of Ir6Ac. The solid line is a fit with n = 1 (R2 = 0.9731 for kcat/KM and 0.9899 for kcat) and the dotted line is a fit where n is a variable: for kcat/KM, n = 1.4 ± 0.1 (R2 = 0.9969) and for kcat, n = 0.9 ± 0.1 (R2 = 0.9919). (C) Best global fit for inhibition of RNase P in the presence of varying concentrations of substrate (6–600 nM). Equation (7) for a non-cooperative mixed inhibition is fit to the data (R2 = 0.9775) with Ki = 130 ± 10 nM and Kis = 480 ± 30 nM (ni = nis = 1); (D) Lineweaver–Burk plot for the dependence of RNase P activity on Ir6Ac and substrate concentrations. A non-cooperative mixed inhibition model is fit to the data (R2 = 0.9670). Symbols represent means ± SD determined from two to three independent experiments at each concentration.
Dissociation constant determined by FA
Calculation of anisotropy in relation to molecular weight
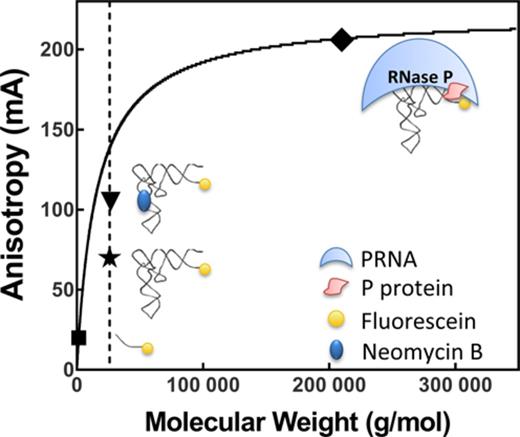
Comparison of the theoretical calculation and experimental results for the FA value of fluorescein labeled pre-tRNAAsp. The dashed line indicates the molecular weight (26,085 g/mol) of pre-tRNAAsp with a 5-nt leader calculated from the sequence in Figure 1. The solid line is the theoretical FA value calculated using Equation (10). The solid symbols indicate the experimental FA values measured in Buffer B (50 mM Tris–HCl pH 7.2, 10 mM MgCl2, 100 mM KCl, 20 mM DTT) except values for Fl-pre-tRNAAsp bound to RNase P were measured in 10 mM CaCl2 and 200 mM KCl at pH 6: Fl-5-nt-leader (▪), Fl-pre-tRNAAsp ( ), Fl-pre-tRNAAsp•NeoB (▾) and Fl-pre-tRNAAsp•RNase P (♦).
High-throughput screening
To develop the end-point HTS assay, RNase P cleavage reactions were carried out at 30°C in a black 384-well microplate (Corning Corporation, #3676). The enzyme was pre-incubated with 2% DMSO for 30 min, then reaction was initiated by addition of an equal volume of substrate and quenched by the addition of 80 mM CaCl2 at various times (Figure 5A). The FP was measured using a PheraStar plate reader (BMG Labtech) with a FP filter module (λex = 485 nm and λem = 520 nm).
The HTS library (∼2880 compounds) was provided by the Center for Chemical Genomics (CCG) at University of Michigan. For the primary compound screen, reactions were carried out using final concentrations of 10 μM compound, 1% DMSO, 0.15 nM RNase P (2 nM P protein) and 20 nM Fl-pre-tRNAAsp at 30°C in HTS buffer [50 mM Tris–HCl pH 7.2, 5 mM MgCl2, 100 mM KCl, 20 mM DTT, 12 mg/ml yeast tRNAMix, 10 mM spermidine and 0.01% (v/v) NP-40]. The enzyme was added using a Multidrop Combi reagent dispenser with a micro-multidrop cassette (Thermo Fisher) and then each compound (in DMSO) or DMSO alone (negative controls) was pinpointed into the solution by Biomek FX Pintool (Beckman Coulter). For the positive control wells, 80 mM CaCl2 was added immediately. RNase P was incubated with compounds at 30°C for 30 min before reactions were initiated by addition of Fl-pre-tRNAAsp substrate. The plates were incubated for another 35 min at 30°C before addition of CaCl2 to quench the reactions. The microplates were read using the PheraStar plate reader using well H23 of each plate to adjust the gain and beam position.
A confirmation screen of the 252 compounds identified compounds that bind to pre-tRNA. Briefly, the compound samples in triplicate were incubated with Fl-pre-tRNAAsp substrate and the FP signal was read before addition of RNase P. Alteration of the FP signal of Fl-pre-tRNAAsp (more than 3SD of negative controls) was used to identify compounds that bind substrate. Compounds that repeatedly showed 30% or more inhibition activity and were not identified as pre-tRNA binders were defined as active inhibitors. Next a dose-response screen of active compounds was carried out by varying the concentration of inhibitor from 1 to 10 μM. Samples that showed a concentration-dependent inhibitory activity (Equation 5) were identified as active. Iriginol hexaacetate (Ir6Ac) was the only active hit from the confirmation screen. Ir6Ac was further tested for inhibition of RNase P-catalyzed cleavage using a radioactive gel-based assay (41). 100 nM unlabeled and <0.4nM 32P-pre-tRNAAsp substrate was mixed with 0.2 nM RNase P and varying concentrations of Ir6Ac (0, 5 and 10 μM), incubated for 35 min at room temperature and quenched by addition of EDTA. Cleavage was analyzed on a 10% denaturing gel. Ir6Ac inhibited RNase P (>3SD of negative control) in this radioactivity assay.
RESULTS
Fluorescence polarization/anisotropy to measure pre-tRNA cleavage
We developed a real-time FP/FA assay for measuring RNase P activity. In general, FP/FA assays measure the degree of polarization of a fluorophore, reflecting the rotational time of the fluorophore, which varies with molecular mass, solvent viscosity and excited state lifetime [(43) and reference therein]. FP/FA measures the ratio of parallel and perpendicular light so the assay is ratiometric, sensitive, independent of the substrate concentration, highly accurate (error <5% even with just a 2-fold dynamic range) (43) and easy to adapt to a high-throughput mode (48). We used a 5′ end fluorescein labeled pre-tRNAAsp (Fl-pre-tRNAAsp (33), Figure 1) to measure cleavage catalyzed by B. subtilis RNase P using FP/FA. The experimentally measured FP/FA signal of Fl-pre-tRNAAsp substrate (high anisotropy) and the Fl-5-nt leader product (low anisotropy) differ by 2 to 3-fold, providing a wide dynamic range for the cleavage assay (Figure 2). Cation concentration and buffer composition also affect the FP/FA signal of Fl-pre-tRNAAsp as shown in Supplementary Figure S1, likely by altering the mobility of the fluorophore through stabilizing the pre-tRNA structure (49). When B. subtilis RNase P is mixed with Fl-pre-tRNAAsp a time-dependent decrease in the FP/FA signal is observed under both single- ([E]/[S]>10, Figure 2A) and MTO ([S]/[E] > 10, Figure 2B) conditions. Similar FA reaction curves have been observed for RNase P-catalyzed cleavage of 5′ fluorescein labeled pre-tRNAAsp with 2, 7 and 10-nucleotide leaders (data not shown). The STO cleavage rate constant and the MTO reaction velocity determined using the FP/FA assay are nearly identical to the values determined from the gel assay (Table 1). Furthermore, the steady-state kinetic parameters measured using the FA assay (kcat = 0.124 ± 0.003 s−1, KM = 40 ± 3 nM, kcat/KM = 3100 ± 200 mM−1s−1, Figure 2C) are in the same range as previously reported values for cleavage of pre-tRNAAsp (41). Therefore, the real-time FP/FA signal accurately measures the cleavage activity of RNase P.
Comparison of RNase P cleavage activity measured by different assays
| Assay methods | STOa rate constant kobs (s−1) | MTOb velocity v0 (nM·s−1) |
|---|---|---|
| FA real-time assay | 0.032 ± 0.001 | 2.2 ± 0.1 |
| Fluorescence gel assay | 0.033 ± 0.006 | |
| 32P gel assay | 1.9 ± 0.1 |
| Assay methods | STOa rate constant kobs (s−1) | MTOb velocity v0 (nM·s−1) |
|---|---|---|
| FA real-time assay | 0.032 ± 0.001 | 2.2 ± 0.1 |
| Fluorescence gel assay | 0.033 ± 0.006 | |
| 32P gel assay | 1.9 ± 0.1 |
aMeasured in buffer A (50 mM Tris/MES pH 5.5, 10 mM MgCl2, 200 mM KCl, 20 mM DTT) with 25 nM Fl-pre-tRNAAsp, 500 nM holoenzyme at 37°C.
bMeasured in HTS buffer [50 mM Tris–HCl pH 7.2, 10 mM MgCl2, 100 mM KCl, 20 mM DTT, 12 mg/ml yeast tRNAMix, 10 mM spermidine and 0.01% (v/v) NP-40] by 100 nM Fl-pre-tRNAAsp or 100 nM unlabeled pre-tRNAAsp mixed with <0.4 nM 32P-pre-tRNAAsp substrate, 0.15 nM holoenzyme and 1.5 nM of P protein at 25°C.
| Assay methods | STOa rate constant kobs (s−1) | MTOb velocity v0 (nM·s−1) |
|---|---|---|
| FA real-time assay | 0.032 ± 0.001 | 2.2 ± 0.1 |
| Fluorescence gel assay | 0.033 ± 0.006 | |
| 32P gel assay | 1.9 ± 0.1 |
| Assay methods | STOa rate constant kobs (s−1) | MTOb velocity v0 (nM·s−1) |
|---|---|---|
| FA real-time assay | 0.032 ± 0.001 | 2.2 ± 0.1 |
| Fluorescence gel assay | 0.033 ± 0.006 | |
| 32P gel assay | 1.9 ± 0.1 |
aMeasured in buffer A (50 mM Tris/MES pH 5.5, 10 mM MgCl2, 200 mM KCl, 20 mM DTT) with 25 nM Fl-pre-tRNAAsp, 500 nM holoenzyme at 37°C.
bMeasured in HTS buffer [50 mM Tris–HCl pH 7.2, 10 mM MgCl2, 100 mM KCl, 20 mM DTT, 12 mg/ml yeast tRNAMix, 10 mM spermidine and 0.01% (v/v) NP-40] by 100 nM Fl-pre-tRNAAsp or 100 nM unlabeled pre-tRNAAsp mixed with <0.4 nM 32P-pre-tRNAAsp substrate, 0.15 nM holoenzyme and 1.5 nM of P protein at 25°C.
Neomycin B and kanamycin B inhibit B. subtilis RNase P and bind to pre-tRNA substrate
To test the utility of this assay for identifying and evaluating inhibitors of RNase P, we measured inhibition of B. subtilis RNase P by two previously reported aminoglycoside inhibitors, neomycin B (NeoB) and kanamycin B (KanB) (20) (Figure 3). Both NeoB and KanB inhibit B. subtilis RNase P cleavage activity with IC50 values of 23 and 52 μM, respectively (Table 2). These IC50 values are comparable to those measured for inhibition of E.coli RNase P (20).
Inhibition of RNase P by neomycin B and kanamycin B is decreased by addition of yeast tRNAMix and spermidine
| NeoB | KanB | |||
|---|---|---|---|---|
| Assay condition | IC50 | Kd | IC50 | Kd |
| Buffer Ba | 23 ± 3 μM | 90 ± 5 μM | 52 ± 6 μM | 220 ± 20 μM |
| +12 mg/ml Yeast tRNAb | 110 ± 20 μM | 100 ± 20 μM | 2.2 ± 0.3 mM | 540 ± 60 μM |
| +10 mM Spermidinec | >1 mMd | >1 mMd | >1 mMd | >1 mMd |
| NeoB | KanB | |||
|---|---|---|---|---|
| Assay condition | IC50 | Kd | IC50 | Kd |
| Buffer Ba | 23 ± 3 μM | 90 ± 5 μM | 52 ± 6 μM | 220 ± 20 μM |
| +12 mg/ml Yeast tRNAb | 110 ± 20 μM | 100 ± 20 μM | 2.2 ± 0.3 mM | 540 ± 60 μM |
| +10 mM Spermidinec | >1 mMd | >1 mMd | >1 mMd | >1 mMd |
aMeasured in buffer B (50 mM Tris–HCl pH 7.2, 10 mM MgCl2, 100 mM KCl, 20 mM DTT) and with 50 nM Fl-pre-tRNAAsp, 0.4 nM holoenzyme and 4 nM P protein at 37°C as described in Figure 3.
bSame as a except with 12 mg/ml yeast tRNAMix in the buffer.
cSame as a except with 12 mg/ml yeast tRNAMix and 10 mM spermidine in the buffer.
d<20% inhibition or binding was observed at this concentration measured.
| NeoB | KanB | |||
|---|---|---|---|---|
| Assay condition | IC50 | Kd | IC50 | Kd |
| Buffer Ba | 23 ± 3 μM | 90 ± 5 μM | 52 ± 6 μM | 220 ± 20 μM |
| +12 mg/ml Yeast tRNAb | 110 ± 20 μM | 100 ± 20 μM | 2.2 ± 0.3 mM | 540 ± 60 μM |
| +10 mM Spermidinec | >1 mMd | >1 mMd | >1 mMd | >1 mMd |
| NeoB | KanB | |||
|---|---|---|---|---|
| Assay condition | IC50 | Kd | IC50 | Kd |
| Buffer Ba | 23 ± 3 μM | 90 ± 5 μM | 52 ± 6 μM | 220 ± 20 μM |
| +12 mg/ml Yeast tRNAb | 110 ± 20 μM | 100 ± 20 μM | 2.2 ± 0.3 mM | 540 ± 60 μM |
| +10 mM Spermidinec | >1 mMd | >1 mMd | >1 mMd | >1 mMd |
aMeasured in buffer B (50 mM Tris–HCl pH 7.2, 10 mM MgCl2, 100 mM KCl, 20 mM DTT) and with 50 nM Fl-pre-tRNAAsp, 0.4 nM holoenzyme and 4 nM P protein at 37°C as described in Figure 3.
bSame as a except with 12 mg/ml yeast tRNAMix in the buffer.
cSame as a except with 12 mg/ml yeast tRNAMix and 10 mM spermidine in the buffer.
d<20% inhibition or binding was observed at this concentration measured.
Interestingly, an enhancement in the FA signal is observed when NeoB or KanB is titrated into Fl-pre-tRNAAsp alone (Figure 4) while the total fluorescence intensity was constant. This result suggests that these inhibitors bind to Fl-pre-tRNAAsp. Apparent dissociation constants (Kd, Table 2) were obtained from fitting a hyperbolic curve (Equation 8) to the FA titration curve (Figure 4A). The Kd of NeoB (90 μM) agrees well with the published value for the affinity of NeoB for a native yeast tRNAPhe (Kd = 90 μM) (49). Furthermore, the affinity of NeoB (Kd = 90 μM) and KanB (Kd = 220 μM) are similar to the IC50 values measured for inhibition of RNase P (IC50 = 23 and 52 μM, respectively), suggesting that the binding of these compounds to the Fl-pre-tRNA substrate contributes to RNase P inhibition. This conclusion is bolstered by the observed decrease in the FP/FA signal when yeast tRNAMix is titrated into the Fl-pre-tRNAAsp·aminoglycoside complex (Figure 4B). Furthermore, yeast tRNAMix decreases the affinity of NeoB and KanB for Fl-pre-tRNAAsp by up to 3-fold and increases the IC50 for inhibition of RNase P by NeoB and KanB by 5-fold and >40-fold, respectively (Figure 3 and Table 2). These data further suggest that aminoglycoside binding to pre-tRNA plays a role in RNase P inhibition.
Inhibition of B. subtilis RNase P by NeoB is decreased by addition of 10 mM spermidine (Table 2) or 100 mM Mg2+ (data not shown), consistent with previous studies of inhibition of E. coli RNase P by aminoglycosides (20,21). Furthermore, addition of spermidine increases the FA signal for Fl-pre-tRNAAsp to a level comparable to that of saturating NeoB (∼110 mA, Supplementary Figure S1). This is likely due to the previously observed effect of polyamine in stabilizing tRNA (49).
Optimization of assay conditions for high-throughput screen
A matrix of conditions was tested to optimize the end-point FP assay in 384-well microplates for HTS. First we analyzed commonly used HTS reagents. B. subtilis RNase P activity is inhibited 20% by 2% DMSO and unaffected by non-ionic detergent NP-40 (0.01–0.1% v/v) (Supplementary Figures S1 and S2). Therefore, the final DMSO concentration was limited to 1%. Second, we optimized the robustness of HTS assays, indicated by the Z′-factor (47). FP measures the same phenomenon as FA (43). However, we used the FP signal in the high-throughput screens because it provides a larger dynamic range for signal, leading to an improvement in the Z′-factor (Equation 11). Quenching the reaction by addition of 80 mM CaCl2 rather than EDTA further enhanced the FP signal dynamic range because the FP signal of Fl-pre-tRNAAsp is dependent on the tRNA structure. Addition of EDTA decreases the FP value for Fl-pre-tRNAAsp by ∼30 mP thus decreasing signal dynamic range. Therefore CaCl2 was used as a quench because CaCl2 slows cleavage by ∼104-fold (50) (Figure 5A) and only slightly increases FP signal of the Fl-pre-tRNAAsp substrate but not the product (data not shown). Finally, the concentration of Fl-pre-tRNAAsp substrate in the HTS was set to the value of KM (20 nM) to allow detection of both competitive and uncompetitive inhibitors and a low concentration of RNase P holoenzyme (0.15 nM) was used so that the reaction has a linear range of ∼30 min (Figure 5A). Furthermore, yeast tRNAMix and spermidine were included in the HTS assay to reduce nonspecific binding to nucleic acids and to enhance identification of inhibitors that bind to RNase P rather than pre-tRNAAsp substrate.
Using the established optimum conditions for the end-point FP assay, a high-throughput screen of a library of ∼2880 compounds was carried out in 384-well microplates (nine plates). The ∼2880 compound library (MS200 + NCC set), containing bioactive small molecules and natural products of known chemical formula, is a pilot set for evaluating assay performance. The 9 plates in this primary screen have an average Z′-factor of 0.76 (Figure 5B), demonstrating that the assay is robust for high-throughput screens (47). Furthermore, orthogonal radioactivity cleavage assays confirmed inhibitors identified from the FP screens. The assay conditions decreased the hit rate from 2–5% (in the absence of spermidine and yeast tRNAMix) to 0.1% by minimizing non-specific binding to pre-tRNAAsp and thereby increasing the identification of inhibitors that specifically bind to RNase P.
Iriginol hexaacetate (Ir6Ac) inhibits RNase P
From the 2880 compound library, Ir6Ac is the only compound that was confirmed as an inhibitor for B. subtilis RNase P through multiple screens (Figure 6). The IC50 of Ir6Ac for inhibition of B. subtilis RNase P in HTS buffer is 820 ± 10 nM (Figure 6B). In addition, titration of Ir6Ac into Fl-pre-tRNAAsp does not affect the FA signal, indicating that this compound does not bind to Fl-pre-tRNAAsp (data not shown). These data suggest that Ir6Ac is a reversible inhibitor of RNase P with higher specificity than previously reported inhibitors, such as neomycin B.
To evaluate the mechanism of inhibition of B. subtilis RNase P by Ir6Ac, we measured the MTO activity of RNase P as a function of both Ir6Ac and Fl-pre-tRNAAsp concentration (Figure 7C). The values of the steady-state kinetic parameters of RNase P-catalyzed cleavage in the HTS conditions are: kcat = 0.157 ± 0.002 s−1, KM = 15 ± 1 nM, kcat/KM = 10200 ± 600 mM−1s−1 (Figure 7C). The addition of Ir6Ac decreases the values of kcat, KM and kcat/KM, indicating a mixed inhibition model (inhibitor binds to both enzyme, E, and enzyme-substrate complex, ES, with different affinity). Furthermore, in comparison to other models (competitive, noncompetitive or uncompetitive) the mixed inhibition model has the smallest error and highest R2 value (0.9775) in a weighted global fitting of RNase P activity under varying concentrations of Ir6Ac and substrate (Equation 7; ni = nis = 1; Figure 7C and D). Ir6Ac leads to substantial decreases in the apparent value of kcat/KM with possible positive cooperativity, as indicated by a slightly more robust fit of the data with an ni of 1.4 ± 0.1 compared to n = 1 (Equation 6; Figure 7A). Nonetheless, the inhibition constants determined by either a cooperative or non-cooperative (ni = nis = 1) model are comparable (Supplementary Table S1). Therefore, these data reveal that Ir6Ac inhibits B. subtilis RNase P by mixed inhibition with inhibition constants of Ki = 130 ± 10 nM and Kis = 480 ± 30 nM with ni = nis = 1 (Figure 7C and D).
DISCUSSION
To facilitate mechanistic studies and discovery of inhibitors of bacterial RNase P, we have developed a high-throughput FP/FA assay that can measure both cleavage activity of RNase P in real-time and binding of small ligands to tRNA. The FP/FA assay is safer and more cost-effective than the radioactivity-based assay and measures activity with high precision since it is ratiometric. A previously reported stopped FP/FA assay for RNase P hybridizes the cleaved 5′ leader product to a fluorescently labeled oligonucleotide (36). The real-time FP/FA assay reported here does not require separation of substrate and product or quenching of the reaction. The 96- or 384-well plate assay format facilitates measurement of RNase P activity under multiple conditions and identification of inhibitors. The HTS FP assay is robust and cost-effective for large scale high-throughput screens.
FP/FA for measuring compound binding to pre-tRNA
The correlation between FA and molecular weight is estimated from the Perrin equation (Equation 10), indicating that a large molecule (higher molecular weight) will have a longer rotational correlation time (Equation 9) and thus higher anisotropy (Equation 10). The rotational correlation time is calculated using the Stoke's equation (Equation 9) by assuming a rigid attachment model for the fluorophore to a spherical macromolecule (43). Calculations using this model recapitulate the experimental values for the Fl-5-nt-leader product and the fully bound Fl-pre-tRNAAsp·RNase P complex. However, the experimental FA reading for Fl-pre-tRNAAsp is ∼70 mA, which is significantly smaller than the predicted theoretical value of ∼140 mA (Figure 8). Previous studies also reported low FA signal for 3′ end-labeled fluorescein tRNAfmet (51) and 5′ end-labeled peptidyl-tRNA (52). Unexpectedly, a significant change in anisotropy (>30 mA) occurred upon binding of NeoB (M.W. = 614.6 g/mol, ΔFA ∼ 50 mA) or KanB (483.3 g/mol, ΔFA ∼ 35 mA) to Fl-pre-tRNAAsp. (Figure 4A). This is in contrast to predictions by the Perrin equation indicating that binding a small molecular weight compound (<0.1 kDa) to Fl-pre-tRNAAsp (∼26 kDa) should generate a negligible change (ΔFA ∼ 1 mA) in FA signal. Interestingly, the FA signal of the NeoB or KanB bound complexes approach the theoretical value calculated for Fl-pre-tRNAAsp (Figure 8).
Two scenarios could explain these anomalous results. The low anisotropy values measured for Fl-pre-tRNAAsp could be due to the fluorescein in Fl-pre-tRNAAsp rotating more freely and rapidly than pre-tRNAAsp. Alternatively, pre-tRNAAsp could be more dynamic than a macromolecule of the same molecular weight, rapidly sampling different conformations and rotating more rapidly in solution. The increase in the FA signal observed upon binding NeoB and KanB is due to a decrease in the mobility of the fluorescein moiety via a direct interaction or through stabilization of the pre-tRNAAsp structure, which decreases mobility. This latter proposal is consistent with previous observations that these compounds interact with and stabilize tRNAPhe (49,53). The melting temperature (Tm) of native tRNAPhe is increased by complexation with NeoB (49). Furthermore, a 2.6 Å resolution co-crystal structure illustrates that NeoB binds in the deep groove below the D-loop of the yeast tRNAPhe, displacing a bound Mg2+ (53). This binding site is remote from the 5′ end of tRNA and is unlikely to directly affect the mobility of the fluorescein moiety. Therefore, the low anisotropy signal of free Fl-pre-tRNAAsp likely reflects the dynamic nature of the tRNA. This allows measurement of the binding of ligands, such as aminoglycosides, that stabilize tRNA structure using changes in FA.
Modes of inhibition of RNase P
Mechanisms for inhibition of bacterial RNase P function can be multifold. For example, inhibitors could disrupt the P RNA·P protein association, chelate structurally and functionally important metal ions, alter P RNA conformation, and/or disrupt substrate recognition by binding to either pre-tRNA or RNase P (18). Positively charged compounds could bind to RNA with high affinity but may also be nonspecific. To develop specific inhibitors targeting RNase P, it is important to identify compounds that bind to the enzyme rather than the pre-tRNA substrate. We have demonstrated that the FP/FA assay can detect small ligand binding to pre-tRNA if the interactions alter the solution structure (Figure 4). This assay is more sensitive for measuring small ligands binding to tRNA than previous methods relying on changes in the intrinsic fluorescence of modified bases on native tRNA (49) or of the compounds (24,54,55), and other spectroscopic methods such as UV-VIS and circular dichroism (24,54–56). The FP/FA assay reported here using end-labeled pre-tRNA provides a general and convenient way of measuring binding and stabilization of in vitro transcribed tRNA by non-fluorescent molecules. Additionally, this assay identifies ligands that bind to any site that alters the conformational mobility of tRNA. Compounds that stabilize tRNA structure might be of particular interest for drug development (57). For example, tRNA stabilizing agents will be a valuable tool for studying the structure, function and biology of the vast number of pathogenic mutations in human mitochondrial tRNAs (58).
For inhibition of RNase P by aminoglycosides and derivatives previous biochemical and computational docking studies have suggested three possible binding sites on P RNA (21,22,59): (i) the P1-P4 helix junction and J19/4 region to compete with the P protein and/or pre-tRNA; (ii) the P15 loop to compete with Mg2+; and (iii) the P15 region to compete with pre-tRNA. Additionally, both our data and previous structural and biochemical data demonstrate that NeoB and KanB bind to tRNA (49,53), suggesting another possible mechanism of inhibition of RNase P. In fact, the affinity of NeoB and KanB to Fl-pre-tRNAAsp is only 4-fold weaker than the IC50 for inhibition of RNase P (Table 2). In addition, yeast tRNAMix significantly decreases inhibition of B. subtilis RNase P by NeoB and KanB (≥5-fold; Table 2). Based on these results, we suggest that binding of aminoglycosides to pre-tRNA inhibits RNase P activity, contributing to the observed inhibition of RNase P by these compounds.
Novel RNase P inhibitor
Unlike NeoB and KanB, the newly identified RNase P inhibitor, Ir6Ac, is a potent (IC50 = 820 nM) inhibitor of RNase P. The inhibition mechanism of Ir6Ac is mixed indicating that the inhibitor binds to both RNase P (Ki = 130 nM) and the RNase P·pre-tRNAAsp complex (Kis = 480 nM). Furthermore, based on FA measurements, this inhibitor does not bind to either pre-tRNAAsp or tRNAAsp, suggesting that Ir6Ac is more specific for inhibition of RNase P compared to previously reported compounds such as aminoglycosides which bind to pre-tRNA substrate (Table 2). Ir6Ac is a semisynthetic derivative of irigenol, a member of the isoflavone natural products family produced by higher plants such as Leguminosae. Isoflavones, including genistein and daidzein, are suggested to function as phytoestrogens and antioxidants (60). Isoflavones have also been suggested to confer anti-cancer effects (61,62). Recent studies have shown that isoflavone compounds stabilize G-quadruplex but destabilize duplex structure in human telomeric DNA (63), indicating that this class of molecule interacts with nucleic acids. Ir6Ac is unlikely to function in vivo because the acetyl groups may be readily hydrolyzed but this scaffold can serve as a lead compound for the development of useful antibacterial compounds targeting RNase P.
Conclusion
RNase P plays an essential role in tRNA biogenesis and is considered a novel antibacterial target (17). However, previous RNase P assays mainly relied on radiochemical methods which limit the capacity for high-throughput screens to discover novel RNase P inhibitors. The FP/FA assay developed in this study is the first non-radioactive method capable of measuring steady-state cleavage activity of bacterial RNase P in real-time as well as detecting small ligand binding to pre-tRNA. The pilot screen identified a new inhibitor, Ir6Ac, for RNase P, demonstrating the utility of the FP/FA-based HTS assay to identify novel RNase P inhibitors.
This FP/FA assay could also be adopted to measure RNase P activity from other organisms, including the protein-only enzymes from human mitochondria and plants, and other tRNA processing enzymes. Important factors in the assay development include design of the substrates, assay conditions and orthogonal assays to confirm that the FP/FA change accurately reflects the enzymatic activity. Furthermore, the FP/FA binding assay using end-labeled pre-tRNA provides a direct method to study binding and stabilizing of pre-tRNA by small molecules, which could facilitate discovery of compounds targeting pathologies related to tRNA.
The authors thank Drs Elaina Zverina, Lyra Chang, John Hsieh and Daina Zeng for helpful discussion with the development of the HTS assay and Professors Jason Gestwicki and Anna Mapp for sharing plate-reader instruments. We thank Martha Larsen, Steven Swaney and Paul Kirchhoff at the Center for Chemical Genomics (CCG) at University of Michigan for their help with the compound library screen and data mining. We thank Nancy Wu, Dr Benjamin Jennings and Michael Howard for comments on the manuscript.
FUNDING
National Institute of Health [R01 GM55387 to C.A.F]; Pilot Screen Grant from the Center for Chemical Genomics at the University of Michigan [to C.A.F.]; Rackham Graduate Student Research Grant [to X.L.]. Funding for open access charge: National Institute of Health.
Conflict of interest statement. None declared.

Comments