


Abstract
Mycobacterium tuberculosis (MTB) is a highly successful pathogen that infects over a billion people. As with most organisms, MTB adapts to stress by modifying its transcriptional profile. Remodeling of the transcriptome requires both altering the transcription rate and clearing away the existing mRNA through degradation, a process that can be directly regulated in response to stress. To understand better how MTB adapts to the harsh environs of the human host, we performed a global survey of the decay rates of MTB mRNA transcripts. Decay rates were measured for 2139 of the ∼4000 MTB genes, which displayed an average half-life of 9.5 min. This is nearly twice the average mRNA half-life of other prokaryotic organisms where these measurements have been made. The transcriptome was further stabilized in response to lowered temperature and hypoxic stress. The generally stable transcriptome described here, and the additional stabilization in response to physiologically relevant stresses, has far-ranging implications for how this pathogen is able to adapt in its human host.
INTRODUCTION
Despite more than 100 years of active research, the most widely used vaccine in human history, and effective chemotherapeutics, tuberculosis (TB) continues to be a major global health problem causing ∼1.5 million deaths each year (http://www.who.int/tb/country/en/). Mycobacterium tuberculosis (MTB) can adapt to a variety of microenvironments within the host, survive a wide range of host defenses and persist in the face of an extended multidrug regimen (1). As in other organisms, transcriptional remodeling in MTB is a primary means of adaptation, which is achieved by changing the balance between new transcription and degradation of existing transcripts. Although regulation of transcriptional initiation is better understood, modulating mRNA stability is an alternate and complementary mechanism of regulating transcript levels. Messenger RNA half-life is a key variable needed to build models of transcriptional flux, and for interpreting physiologic changes in response to stress.
Prokaryotic mRNA degradation has been comparatively well studied in Escherichia coli, Bacillus subtilis and Staphylococcus aureus. In these studies, rifampicin was used to interfere with the RNA polymerase beta subunit, allowing mRNA degradation to be measured in the absence of new transcriptional initiation. Using this method, 80% of mRNA transcripts in E. coli had measured half-lives between 3 and 8 min (2). Similarly, in B. subtilis and S. aureus most mRNAs had half-lives of <5 min (3,4). The primary regulator of mRNA stability in E. coli in non-stress conditions is the endoribonuclease RNaseE, which sits at the center of a multiprotein mRNA degradasome complex (5). Bacillus subtilis and S. aureus do not have a direct homolog of RNaseE, but they do have RNases with similar function (3). In addition to the degradasome there are at least three other mechanisms by which prokaryotic RNA stability is regulated: accessory endoribonucleases (including toxin-antitoxin modules), exoribonucleases and interactions with RNA structure-modifying molecules (including pyrophosphatase and small non-coding RNAs) (3).
In response to stress, mRNA stability can be modulated both globally and specifically. Cold shock can extend the half-life of cold shock protein A (cspA) mRNA in E. coli from 10 s to hours (6,7). In S. aureus, mRNA transcripts are globally stabilized in response to stationary phase as well as heat, cold, acid and alkaline stress. For example, the percentage of transcripts with half-lives longer than 2.5 min in S. aureus goes from only 15% to more than 50% in response to cold shock (8).
Very little is known about mRNA stability in mycobacteria. Unlike the Gram-positive organisms described earlier, MTB has a homolog of E. coli RNaseE, though it was shown to associate with a different set of accessory proteins (9). The catalytic domain of the MTB RNaseE cleaves a smaller subset of A/U rich sequences compared with the E. coli protein, though at a similar catalytic rate (10). In Mycobacterium smegmatis, a rapidly growing non-pathogenic relative of MTB, secondary structure in the 5′ UTR has been predicted to have a stabilizing effect on mRNA transcripts (11).
We present here a global survey of the mRNA decay rates in MTB. We find that the mRNA pool in MTB is very stable, with an average mRNA half-life more than 9 min. We also describe a global stabilization of MTB mRNA in response to both hypoxia and low temperature. This slow mRNA turnover places significant limitations on how MTB can remodel its transcriptome, and suggests that this pathogen may require novel adaptive mechanisms to degrade condition-inappropriate transcripts to adapt to commonly seen environmental stresses.
MATERIALS AND METHODS
Bacterial strains, media and handling
All experiments used either MTB H37Rv (ATCC 27294) or M. smegmatis mc2155. The dosR induction experiments were performed using a strain carrying an episomal vector with a tet-inducible promoter driving the expression of a FLAG tagged dosR (12). For aerobic growth, cultures were grown in Middlebrook 7H9 with the ADC supplement (Difco) and 0.05% Tween80, at 37°C with constant agitation.
Hypoxic experiments were done as described earlier (13). Briefly, a log phase culture was exposed to a constant flow of 0.2 cubic feet per hour of nitrogen with trace amounts of oxygen (2000 ppm) to create a hypoxic non-replicating culture. Low temperature experiments were performed in a rolling culture shifted from 37 to 20°C for 1 h before addition of rifampicin.
Transcription arrest, mRNA decay and RNA isolation
To measure the mRNA degradation rate, transcription was stopped by addition of 50 mg/l rifampicin (Sigma). This concentration of rifampicin led to complete arrest of any transcriptional induction, for example, in response to hypoxia, in numerous experiments (NCBI-GEO GSE36345). After arrest, samples were rapidly chilled in a dry ice/ethanol bath to inhibit further RNA degradation and kept at 4°C until the experiment was complete. Samples were pelleted for 5 min at 4750 g, 4°C. Supernatant was discarded and pellets were resuspended in 1 ml TRIzol (Invitrogen). Each experiment represents the average of at least three biological replicates.
RNA was isolated as described earlier (14). Briefly, pellets in TRIzol were transferred to a tube containing Lysing Matrix B (QBiogene, Inc.), and vigorously shaken at maximum speed for 30 s in a FastPrep 120 homogenizer (Qbiogene) three times, with cooling on ice between steps. This mixture was centrifuged at maximum speed for 1 min and the supernatant was transferred to a tube containing 300 µl chloroform and Heavy Phase Lock Gel (Eppendorf North America, Inc.), inverted for 1 min and centrifuged at maximum speed for 5 min. The aqueous phase was then precipitated with 300 µl isopropanol and 300 µl high salt solution (0.8 M Na citrate, 1.2 M NaCl). RNA was purified using an RNeasy kit following manufacturer’s recommendations, including an on-column DNase step (Qiagen). Total RNA yield was quantified using a Nanodrop (Thermo Scientific).
Microarray analysis
RNA was converted to Cy dye-labeled cDNA probes as described earlier (13). For all experiments described here, 3 µg of total RNA was used to generate probes. Sets of fluorescent probes (Cy3 and Cy5) were hybridized to custom 12x135K microarrays from Roche-Nimblegen. Each slide contains 12 identical arrays of 135 000 60-mer probes that tile most of the MTB genome with gaps of <200 bp between probes (average gap = 30 bp). Included in each array are 30 000 randomer probes of matched GC content. These randomer probes do not specifically hybridize with MTB RNA, and serve as a robust measure of background for each array. Our array design is publically available (Nimblegen ID 110405, NCBI GEO number GPL14824). A similar tiled array was used for M. smegmatis expression analysis (Nimblegen ID 110930, NCBI GEO number GPL15323). All array data can be downloaded from NCBI GEO (GSE36345).
Arrays were scanned using a fixed PMT gain on a GenePix 4000B scanner (Molecular Devices) at a 5-µm resolution using GenePix 4.1 image acquisition software. Each image was then burst into 24 individual arrays from each slide, and spot intensities calculated using the NimbleScan software (Roche-Nimblegen). Final analysis was done using ArrayStar (DNAstar) to collapse the probes covering each gene or inter-genic feature into a single value by averaging the probes tiled over each gene.
Loading equal amounts of total RNA allowed us to roughly normalize to rRNA, which is by far the most abundant species of RNA, with a half-life of >24 h (15). Standard microarray normalization methods depend on the assumption that the net fluorescence intensity in each channel of the microarray is equal, an invalid assumption in these experiments. Therefore, the mRNA features of the microarray were normalized to the stable tRNA features. A set of 30 000 randomer probes was used to define background, and only genes that had overall intensity at least 4-fold above background at T = 0 were used for calculating half-life. Data were plotted as mean array intensity (log2) over time, where the negative reciprocal of the slope of each line equals the half-life of that transcript. Transcripts whose degradation did not fit a standard logarithmic degradation profile (R2 < 0.8) were also excluded from calculations of average half-life. More than 50% of MTB genes met inclusion criteria and were included in average half-life determinations.
RESULTS
Global mRNA decay rate of the MTB transcriptome
To measure the global rate of mRNA decay in MTB, transcription initiation was arrested using a high concentration (∼250× the minimum inhibitory concentration) of the transcriptional inhibitor rifampicin, which binds to the beta subunit of RNA polymerase (16), leaving degradation as the primary factor affecting transcript abundance. Degradation rates were calculated from the slope of a plot of log2 transcript abundance over time after transcriptional arrest. To assess the mRNA half-life globally, we measured mRNA decay using tiled genomic microarrays comprised of 107 936 60-mers, or roughly 75% of the entire genome. Once rifampicin stopped transcription in a log phase MTB culture, aliquots were removed at regular intervals. RNA was isolated from these samples, and equal amounts of total RNA (comprised of mostly stable rRNA) were converted to fluorescently labeled cDNA and hybridized to microarrays. To insure that decay could be measured over at least two half-lives, transcripts that were not at least 4-fold above background were excluded from analysis. Transcripts whose degradation pattern did not fit an exponential decay curve were also excluded, as exponential decay is implicitly assumed in a half-life calculation. After filtering the data this way, we were able to measure the half-lives of 2139 transcripts of the roughly 4000 genes in the MTB genome (Supplementary Table S1). There was good correlation between four replicate experiments: on average the standard deviation was <1 min and the coefficient of variance was <0.1. Excluded transcripts were not enriched for any functional category with the exception of the PE/PPE family of genes, for which decay rates of only 33 of the 168 genes could be measured.
We determined a mean half-life of log phase mRNA transcripts in MTB of 9.5 min (Figure 1), substantially longer than the global half-life of other prokaryotes studied to date (3). More than 80% of mRNA transcripts had half-lives between 8 and 12 min, and even the shortest half-lives in MTB were longer than the average transcript in E. coli (2). Quantitative real-time PCR on a subset of 89 genes produced very similar results (data not shown). Individual transcripts with the shortest half-lives include many ‘housekeeping’ genes such as those for ribosomal proteins, subunits of ATP synthetase, the Clp proteases and the principal log phase sigma factor, sigA. More stable transcripts are more diverse, but include a disproportionate number of genes involved in replication, recombination and repair, and in amino acid transport and metabolism. A consideration of differential decay rates and gene functional class is provided in the Discussion below.
![Histogram of transcript half-lives in log phase MTB. The distribution of MTB mRNA half-lives follows a normal distribution (dark gray), with a mean half-life of 9.5 min. This is substantially longer than that previously measured for E. coli [light gray, data from (2), shown with permission of the authors]. The fast growing mycobacterium M. smegmatis had a decay rate similar to previously described bacteria (black). No decay rate was measured for genes that were not expressed at least 4-fold above background or did not follow a logarithmic decay.](https://oup.silverchair-cdn.com/oup/backfile/Content_public/Journal/nar/41/1/10.1093/nar/gks1019/2/m_gks1019f1p.jpeg?Expires=1716334088&Signature=wexC5F9QbHYdICZM3UCkuUj0utgyQs~-O06FYu7aumbeuCyc-IwoZo3ILR-qq7oO2upR9KQNO0jn-vtW-XPEY4kaL0awvayeTor2MnwPV-TIxq-jrRxzlMfQl-ai~HgTOh71GZL66Im6okuRTS8IsGTtNqYVjB5zjCuCzx01fj4X8-T-P1GfSm2dYOiiZ1F-1bj~KBmpiwIKdhjcSdCNXhJbIUkbPyuZ7LB9JXvItw5whgFjxzWl8Om2tCIHYB~ev9AWNfnUt3y8Xh-wceqk-mN~TXhZ-WZo80FhjVAI2AOJVUAR2sfd43yXldWnRN0PXv6c02IHIZF~Yq7VP6bZeQ__&Key-Pair-Id=APKAIE5G5CRDK6RD3PGA)
Histogram of transcript half-lives in log phase MTB. The distribution of MTB mRNA half-lives follows a normal distribution (dark gray), with a mean half-life of 9.5 min. This is substantially longer than that previously measured for E. coli [light gray, data from (2), shown with permission of the authors]. The fast growing mycobacterium M. smegmatis had a decay rate similar to previously described bacteria (black). No decay rate was measured for genes that were not expressed at least 4-fold above background or did not follow a logarithmic decay.
The doubling time of MTB is 16–22 h, much longer than most well-studied prokaryotes. To see if replication rate and mRNA turnover may be related, we measured the transcript degradation rate for the non-pathogenic mycobacterium M. smegmatis (doubling time of 2–3 h) using methods described earlier. The average half-life in M. smegmatis was 5.2 min, much closer to the mRNA decay rate described for other bacteria (Figure 1; Supplementary Table S2), raising the possibility that mRNA stability and slow growth may be correlated in mycobacteria.
We also examined the impact of position within an operon on mRNA stability. We compared opposite ends of polycistronic transcripts where both ends of the transcript had measured half-lives (352 of all 889 polycistronic transcripts). About 90% of intra-operon half-lives were within 2 min of each other (Figure 2A and B). This pattern held true for transcripts with short, average or long half-lives. In addition, the half-lives of genes at the 3′ or 5′ end of an operon did not show any consistent trend toward being more or less labile. This supports a model of RNA decay wherein the destabilization of a transcript, typically through cleavage by an endonuclease, is the rate limiting step followed by rapid digestion by exonucleases (3).
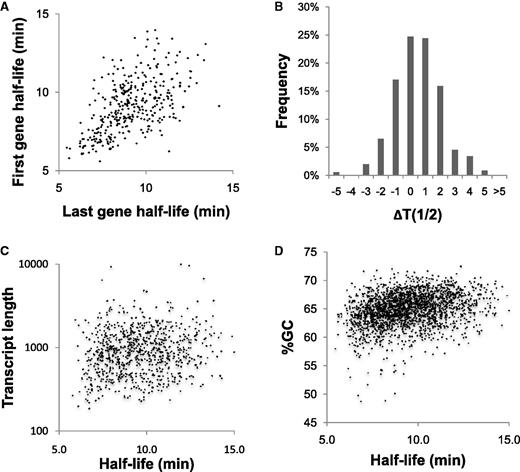
Impact of transcript attributes on mRNA half-life. (A) Half-lives of the 5′ and 3′ genes from operons show generally similar mRNA stabilities, with no trend toward either end of the transcript. (B) Histogram of the differences between first and last half-lives in minutes. (C) Graph showing the poor correlation between mRNA stability and the length of single gene transcripts. (D) Graph showing the poor correlation between mRNA stability and the %GC of mRNAs.
Other factors affecting decay rate
We compared the mRNA half-life of each transcript to several factors that could contribute to transcript stability. For example, we compared decay rate to transcript length. A plot of the degradation rate of single gene operons compared with the length of the gene encoded did not show any correlation (Figure 2C). As with the analysis of polycistronic operons, a poor correlation between transcript length and decay rate supports a model in which destabilization, perhaps through cleavage by an endonuclease, is the rate limiting step in mRNA degradation. Similarly, a plot of the GC content of each ORF compared with mRNA decay showed no significant correlation (Figure 2D, R2 < 0.1). The set of ∼20 relatively AT-rich transcripts (%GC<57) have significantly shorter half-lives compared with the average (7.8 vs. 9.5 min, P < 0.001) but there are too few AT-rich genes to affect the general pattern. The lack of a correlation between global mRNA stability and broad physical characteristics of messages echoes the pattern in E. coli (2).
The transcript characteristic that most accurately predicted half-life was abundance of that message at the time transcription was arrested (Figure 3A). A plot of abundance at time zero compared with half-life shows a strong inverse correlation that follows a power trend line (R2 > 0.8). The 100 genes that are most abundantly transcribed have an average half-life of 6.7 min, and only one of these genes has a half-life above average. This correlation suggests two possibilities: either transcripts highly expressed during log phase growth are inherently more labile or the half-life of a transcript depends to a significant degree on the level of expression.
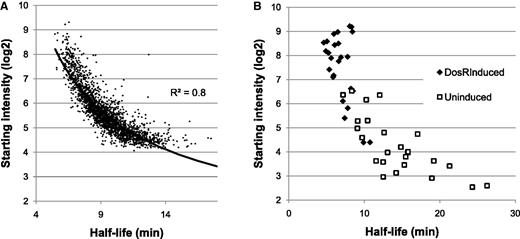
Transcript abundance and transcript decay. (A) Graph relating the abundance of a transcript at the time of transcription inhibition with mRNA half-life shows a very strong negative correlation, which follows a power regression line (R2 > 0.8). (B) Transcript abundance versus mRNA half-life for genes of the DosR regulon either before (open squares) or after (filled diamonds) ectopic induction.
To explore this question, we generated an MTB strain in which a subset of genes could be ectopically induced. The MTB transcriptional regulator DosR controls induction of several genes in response to reduced oxygen tension and other stimuli (17,18). Using a merodiploid copy of dosR under the control of a tetracycline-responsive promoter, we induced expression of dosR and concomitantly upregulated the DosR regulon (12). With and without induction of the DosR regulon, we measured half-lives for all transcripts as above. Almost all transcripts showed very little change in expression or half-life (GEO accession GSE36345), however the DosR-regulated genes were all highly induced and nearly all showed a corresponding drop in the measured half-life (Figure 3B). Of the 25 DosR-regulated genes for which half-lives could be measured both before and after induction, 24 had a shorter half-life after induction, on average shorter by 7 min.
Modest cold shock substantially greatly stabilizes MTB mRNA
During transmission between hosts MTB can be exposed to a drop in temperature, a stress that is generally associated with some mRNA stabilization. To test the impact of temperature shifts on mRNA stability, we compared the mRNA degradation profile of cultures maintained at room temperature (20°C) to those observed at 37°C. Decay rates were generated as described earlier. As expected, the transcripts in the 37°C culture degraded normally; however, no measurable mRNA degradation occurred during the first 2 h of transcriptional arrest in the culture kept at 20°C (Figure 4). Five hours after arresting transcription, only 55 transcripts had decayed to half their starting intensity, indicating an average mRNA half-life of >5 h for MTB transcripts at room temperature (GEO accession GSE36345).
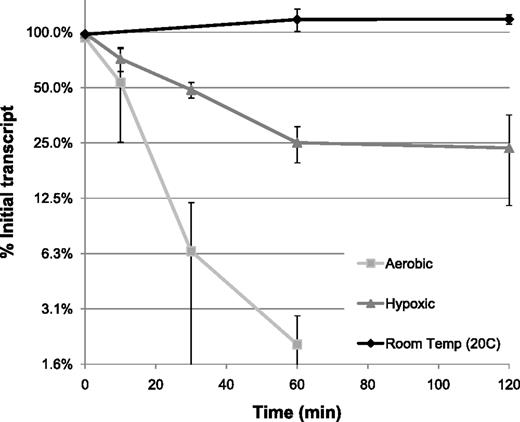
mRNA degradation during stress conditions. mRNA decay curves for MTB in aerobic log phase (squares), hypoxia (triangles) or room temperature (20°C, diamonds) measured by microarray. Shown are averages over all genes above background in four replicate experiments.
mRNA degradation in MTB is oxygen dependent
In response to hypoxia, MTB undergoes a major remodeling of its transcriptome. The transcriptional regulation of the initial response to hypoxia by the two-component response regulator DosR has been well characterized (17,18), but we hypothesized that the stability of some transcripts may change in response to hypoxia, thereby modifying the response rate of DosR-regulated genes. To test this we exposed bacteria to 1 hour of hypoxia before adding rifampicin and followed the subsequent mRNA decay in the absence of oxygen. One hour of exposure to hypoxic conditions (1% atmospheric O2) is sufficient to arrest growth and induce the initial hypoxic response (13).
Rather than modifying the mRNA decay rates of individual genes, we found that exposure to hypoxia led to a global stabilization of all transcripts. An hour after rifampicin treatment of hypoxic cultures, average mRNA half-life increased to ∼30 min for the first hour, and subsequent decay slowed to below the limits of detection (Figure 4). A biphasic mRNA degradation curve invalidates accurate half-life calculations, however, after 5 h of transcriptional arrest mRNA had decayed only 4-fold, or two half-lives (GEO accession GSE36345), indicating an effective net half-life of >150 min in hypoxia. If anything, this experiment overestimates the rate of decay in hypoxia, as some experiments show even less degradation.
DISCUSSION
This study provides the first global survey of mRNA stability in the human pathogen MTB, providing half-life measurements for 2139 genes. The pool of mRNA in MTB degrades with a mean half-life of 9.5 min, substantially slower than in other bacteria that have been studied (Figure 1). The half-life of 3644 mRNAs were also measured in M. smegmatis, a related organism with a much shorter doubling time, and the decay rate was found to be similar to that seen in other prokaryotes, over 5 min (Supplementary Table S3). This suggests that the mRNA stability and slow growth may be linked in mycobacteria. However, previously published decay rates in organisms with highly variable doubling times have not shown this correlation, suggesting that this is not a common adaptation to slow growth (2,4,19,20). A slower rate of mRNA decay means that MTB cannot repress genes as quickly as other prokaryotes through limiting transcription and allowing the native degradation machinery to remove surplus transcripts. In return for having a slower rate of adaptation, MTB can conserve energy by limiting the rate of mRNA turnover to maintain transcripts at a given level.
Analysis of gene class and decay rate
To gain more insight into the contribution of mRNA decay to MTB physiology and to compare the decay process between prokaryotes, we performed bioinformatic analysis of differential degradation as a function of gene class. The Gene Ontology project (GO project; http://www.geneontology.org/) parses genes and gene products into numerous discrete but potentially overlapping categories based on function, biological process or cellular location. As such GO terms provide a convenient lens through which to view genome-wide data sets. We used the TopGO package (21) from the BioConductor software suite (22) to assess the enrichment of each GO term that contained at least five genes as annotated in TBDB (23) and the Microbes Online Database (24). We used the non-parametric Kolgorov–Smirnov test to assign P-values to the enrichment seen as this method is relatively robust with small sample size and non-normal distributions. For comparison we performed the same analysis of the E. coli half-lives reported by Bernstein et al. (2).
In MTB only 7 of the 306 GO terms with five or more annotated genes were enriched for long-lived transcripts, the same number as in E. coli (Table 1). This indicates a broad distribution over all functional categories for especially stable transcripts, with only a few exceptions. DNA metabolic processes, in particular DNA repair and recombination, have longer half-lives in MTB. This may contribute to maintaining the very stable genome of MTB which is less polymorphic across isolates than many other bacteria (25, 26) as well as the need to repair mutations that accumulate in this slowly replicating organism even during dormancy (27). In contrast, half-lives of transcripts related to transcription and its regulation were noticeably longer than average in E. coli. No GO category enriched for long-lived transcripts was shared in both organisms, suggesting that the identity of stable transcripts is not conserved in physiologically distinct bacteria.
Comparison of E. coli and MTB GO terms enriched for transcripts with short or long half-lives with a P-value<0.01 from the Kolgorov–Smirnov test (KS)
| GO ID | Term | KS | GO ID | Term | KS |
|---|---|---|---|---|---|
| MTB terms with long half-lives | E. coli terms with long half-lives | ||||
| GO:0006259 | DNA metabolic process | <0.001 | GO:0006351 | Transcription, DNA-dependent | 0.005 |
| GO:0006310 | DNA recombination | <0.001 | GO:0006355 | Regulation of transcription, DNA-dependent… | 0.006 |
| GO:0034641 | Cellular nitrogen compound metabolic process | 0.005 | GO:0051252 | Regulation of RNA metabolic process | 0.006 |
| GO:0090304 | Nucleic acid metabolic process | 0.005 | GO:0006725 | Cellular aromatic compound metabolic process… | 0.006 |
| GO:0006281 | DNA repair | 0.006 | GO:0032774 | RNA biosynthetic process | 0.008 |
| GO:0006139 | Nucleobase-containing compound metabolic process… | 0.006 | GO:0019219 | Regulation of nucleobase-containing compound… | 0.009 |
| GO:0006974 | Response to DNA damage stimulus | 0.007 | GO:0051171 | Regulation of nitrogen compound metabolic process… | 0.009 |
| MTB terms with short half-lives | E. coli terms with short half-lives | ||||
| GO:0006457 | Protein folding | <0.001 | GO:0006418 | tRNA aminoacylation for protein translation… | <0.001 |
| GO:0040007 | Growth | <0.001 | GO:0043038 | Amino acid activation | <0.001 |
| GO:0044267 | Cellular protein metabolic process | <0.001 | GO:0043039 | tRNA aminoacylation | <0.001 |
| GO:0006412 | Translation | <0.001 | GO:0006399 | tRNA metabolic process | <0.001 |
| GO:0019538 | Protein metabolic process | <0.001 | GO:0006412 | Translation | <0.001 |
| GO:0071766 | Actinobacterium-type cell wall biogenesis… | <0.001 | GO:0034660 | ncRNA metabolic process | <0.001 |
| GO:0033036 | Macromolecule localization | <0.001 | GO:0006260 | DNA replication | <0.001 |
| GO:0009408 | Response to heat | <0.001 | GO:0044267 | Cellular protein metabolic process | <0.001 |
| GO:0010467 | Gene expression | <0.001 | GO:0043170 | Macromolecule metabolic process | <0.001 |
| GO:0008104 | Protein localization | 0.001 | GO:0044260 | Cellular macromolecule metabolic process | <0.001 |
| GO:0015031 | Protein transport | 0.001 | GO:0071103 | DNA conformation change | <0.001 |
| GO:0045184 | Establishment of protein localization | 0.001 | GO:0009058 | Biosynthetic process | <0.001 |
| GO:0034645 | Cellular macromolecule biosynthetic process | 0.002 | GO:0019538 | Protein metabolic process | <0.001 |
| GO:0071767 | Mycolic acid metabolic process | 0.002 | GO:0044237 | Cellular metabolic process | <0.001 |
| GO:0071768 | Mycolic acid biosynthetic process | 0.002 | GO:0006259 | DNA metabolic process | <0.001 |
| GO:0009059 | Macromolecule biosynthetic process | 0.002 | GO:0009059 | Macromolecule biosynthetic process | 0.002 |
| GO:0009266 | Response to temperature stimulus | 0.002 | GO:0044249 | Cellular biosynthetic process | 0.002 |
| GO:0044085 | Cellular component biogenesis | 0.003 | GO:0034645 | Cellular macromolecule biosynthetic process… | 0.003 |
| GO:0009273 | Peptidoglycan-based cell wall biogenesis | 0.004 | GO:0006304 | DNA modification | 0.004 |
| GO:0042546 | Cell wall biogenesis | 0.004 | GO:0006261 | DNA-dependent DNA replication | 0.005 |
| GO:0070882 | Cellular cell wall organization or biogenesis… | 0.004 | GO:0044238 | Primary metabolic process | 0.007 |
| GO:0071554 | Cell wall organization or biogenesis | 0.004 | GO:0008610 | Lipid biosynthetic process | 0.008 |
| GO:0071840 | Cellular component organization or biogenesis… | 0.005 | |||
| GO:0071841 | Cellular component organization or biogenesis… | 0.005 | |||
| GO:0009628 | Response to abiotic stimulus | 0.006 | |||
| GO:0071843 | Cellular component biogenesis at cellular… | 0.006 | |||
| GO:0071844 | Cellular component assembly at cellular… | 0.007 | |||
| GO:0045333 | Cellular respiration | 0.007 | |||
| GO:0006820 | Anion transport | 0.009 | |||
Three times as many functional categories were enriched for shorter half-lives in both MTB and E. coli, and some of these categories overlapped (Table 1). In both organisms, functional categories related to translation and macromolecular biosynthesis were enriched for transcripts with short half-lives. In MTB, genes involved in fatty acid synthesis, and particularly mycolic acid synthesis, were very labile. This may reflect the need of the bacteria to keep tight control over these energy intensive biosynthetic processes and immunomodulatory products. In contrast, transcripts associated specifically with protein folding and growth were significantly more likely to be short-lived in MTB but not in E. coli.
Possible degradation mechanisms
We are currently exploring three potential mechanisms that may contribute to the extended mRNA stability in MTB. The enzymes that carry out degradation could limit the rate of mRNA decay, either through slower enzyme kinetics or lower abundance compared with other bacteria. Here, we show that mRNA half-life shows no bias toward the 3′ or 5′ end of transcripts (Figure 2A and B) nor is it correlated with the size of a transcript (Figure 2C), supporting the hypothesis that the initial destabilization is the rate limiting step. In E. coli, this destabilization step is catalyzed by the endonuclease RNaseE. The homolog to this gene in MTB is kinetically equivalent to the orthologous enzyme in E. coli, but the MTB version is more specific about the sites of cleavage (9). This specificity could directly result in a slower global rate of mRNA decay. Alternatively, features of MTB transcripts such as stabilizing secondary structure or post-transcriptional modifications could contribute to decay rates. Although MTB has a higher GC content than other bacteria with defined half-lives, this feature does not seem to predict mRNA half-life (Figure 2D). Finally, mRNA binding proteins or the ribosome may shelter MTB mRNA from the degradation machinery. Further biochemical analysis of the mRNA decay process in MTB is necessary to define the stabilizing mechanism.
mRNA abundance and decay rate
Transcript abundance depends almost exclusively on rates of transcription and degradation. One would predict, therefore, that mRNA half-lives would be positively correlated with abundance. Instead, a plot of those two variables reveals a striking inverse correlation (Figure 3A). Previously, Bernstein et al. described a weak but statistically significant negative correlation between transcript abundance and the decay rate in E. coli (2). In MTB this inverse correlation is much stronger (R2 > 0.8). This raises the question of whether or not the mRNA degradation rate is dependent on the level of transcript abundance, or if abundant transcripts, as a class, have shorter half-lives. We addressed this question by ectopically over expressing genes of the DosR regulon. We found that overexpression of these genes led to reduced stability of those transcripts (Figure 3B). Clearly rapid turnover of abundant transcripts requires more energy, as the rate of transcription must be elevated to compensate. Perhaps rapid cycling allows tighter regulation of very highly expressed genes. We are currently developing computational models of mRNA decay that include this strong inverse relationship.
The observation of an inverse relationship between mRNA half-lives and transcript abundance in phylogenetically distant bacteria suggests that the underlying mechanism is both ancient and conserved. The co-localization of transcription and translation suggest several possible mechanisms. Rapid transcription may lead to a localized depletion of ribosomes, leaving a proportionally larger fraction of the mRNA exposed to RNases. We are currently exploring this hypothesis by measuring mRNA decay in the presence of drugs that interfere with translation initiation and elongation. Alternatively, the transcription and degradation machinery could be linked physically or functionally, such that sites of active transcription recruit degradation machinery. This could be explored through analysis of the subcellular concentration of mRNA transcription and degradation machinery.
Environmental stresses and mRNA decay
We also explored the role of differential mRNA degradation in response to physiologically relevant stresses. Hypoxia is of interest in MTB as it is a clinically relevant host-dependent environmental stress that arrests replication and has been suggested to play a role in the bacterial adaptation from active to latent disease (28). In response to hypoxic stress MTB undergoes drastic remodeling of its transcriptome resulting in the altered transcription of nearly a quarter of all transcripts (28,29). Given the size of this rearrangement, we hypothesized that some of the regulated transcripts may have altered abundance due to modified mRNA degradation rates. We found instead that exposure to a low oxygen environment results in a global stabilization of mRNA transcripts (Figure 4). The decay of MTB mRNA in response to hypoxic conditions is at least 15-fold slower than in aerobic conditions. The decay follows a biphasic curve that flattens as dissolved oxygen is depleted, with an initial half-life of ∼50 min followed by a virtual arrest of mRNA degradation. Hypoxic degradation arrest seems to be directly correlated with the presence of dissolved oxygen; stabilization was immediately reversed if oxygen was reintroduced to the culture concurrent with transcriptional arrest (data not shown). Hypoxia-triggered mRNA stabilization of a small set of transcripts has been described in E. coli, though the effect was much less striking (6). Given the well-characterized repression of hundreds of MTB genes in response to extended hypoxic stress (13), it is clear that degradation of specific transcripts occurs in spite of global stabilization of mRNA. It is tempting to speculate that the need to degrade specific transcripts rapidly in response to stress could help explain the evolution of the remarkable number of toxin–antitoxin modules in MTB, many of which encode RNases (30), as an alternative method of mRNA degradation in conditions that globally stabilize mRNA. We are currently exploring the question of repressed transcripts in the face of global stabilization by analyzing transcripts down-regulated in hypoxia.
Cold shock is another environmental stress relevant to MTB. Bacteria in droplets coughed out the lungs of patients with active TB may be exposed to a substantial drop in temperature, depending on the ambient environment. The arrested decay of mRNA at room temperature described here (Figure 4) suggests that the transcriptome of bacteria in transit between hosts may stabilize rapidly in response to that change of environment. Thus, infecting droplet nuclei may bear a ‘transcript memory’ of the environment from their previous host, perhaps to promote more efficient colonization of a new host upon inhalation. Stabilization of mRNA at room temperature also has implications for researchers performing transcriptional analysis of MTB, as the lack of signal decay considerably lessens concerns about alteration of the transcriptome after sampling. In E. coli a cold-specific RNA helicase, CspA, is necessary to effectively degrade mRNA at low temperature (6,7). The MTB ortholog to CspA is less ordered and less stable than similar genes in other prokaryotes (31). This suggests that MTB may be unable to unravel the secondary structure of its GC-rich mRNA at lower temperatures, thereby inhibiting degradation.
As systems biology approaches begin to map the regulatory networks of MTB, information about the influence of mRNA degradation on transcript levels will be needed to create valid models. The innate stability of a transcript can affect the kinetics of transcriptional response: genes with a rapid response to stress have less stable transcripts than genes involved in enduring stress responses (32). Characterizing the mRNA decay process in MTB has uncovered a number of unusual features of this central biological process. The long native mRNA half-life of MTB, and the massive stabilization in response to hypoxia and cold, will alter our understanding of how this critical pathogen is able to adapt and respond during infection.
SUPPLEMENTARY DATA
Supplementary Data are available at NAR Online: Supplementary Tables 1–3.
FUNDING
The Bill and Melinda Gates Foundation and The Paul G. Allen Family Foundation. The National Science Foundation Graduate Research Fellowship (To K.J.M.). Funding for open access charge: Paul G. Allen Family Foundation.
Conflict of interest statement. None declared.
ACKNOWLEDGEMENT
We would like to acknowledge the support of the entire Sherman Lab, particularly Debbie Whitley and Mark Hickey.
REFERENCES
Author notes
Present address: David R. Sherman, Seattle Biomedical Research Institute, Seattle, WA 98109, USA.

Comments