


Abstract
In any comparative studies striving to understand the similarities and differences of the living organisms at the molecular genetic level, the crucial first step is to establish the homology (orthology and paralogy) of genes between different organisms. Determination of the homology of genes becomes complicated when the genes have undergone a rapid divergence in sequence or when the involved genes are members of a gene family that has experienced a differential gain or loss of its constituents in different taxonomic groups. Organisms with duplicated genomes such as teleost fishes might have been especially prone to these problems because the functional redundancies provided by the duplicate copies of genes would have allowed a rapid divergence or loss of genes during evolution. In this study, we will demonstrate that much of the ambiguities in the determination of the homology between fish and tetrapod genes resulting from the problems like these can be eliminated by complementing the sequence-based phylogenies with nonsequence information, such as the exon–intron structure of a gene or the composition of a gene’s genomic neighbors. We will use the Tbx6/16 subfamily genes of zebrafish (tbx6, tbx16, tbx24, and mga genes), which have been well known for the ambiguity of their evolutionary relationships to the Tbx6/16 subfamily genes of tetrapods, as an illustrative example. We will show that, despite the similarity of sequence and expression to the tetrapod Tbx6 genes, zebrafish tbx6 gene is actually a novel T-box gene more closely related to the tetrapod Tbx16 genes, whereas the zebrafish tbx24 gene, hitherto considered to be a novel gene due to the high level of sequence divergence, is actually an ortholog of tetrapod Tbx6 genes. We will also show that, after their initial appearance by the multiplication of a common ancestral gene at the beginning of vertebrate evolution, the Tbx6/16 subfamily of vertebrate T-box genes might have experienced differential losses of member genes in different vertebrate groups and gradual pooling of member gene’s functions in surviving members, which might have prevented the revelation of the true identity of member genes by way of the comparison of sequence and function.
Introduction
In any comparative studies striving to understand the similarities and differences of living organisms at the molecular genetic level, determining which of the genes in one species have the same identities as the genes in another species is the crucial first step in an experimental design. Determination of such relationships usually involves a comparison in terms of the similarity of nucleotide or amino acid sequences of genes and a subsequent construction of a phylogenetic tree (Kuzniar et al. 2008). Based on the phylogeny, a pair of genes that are present in different species but are judged to have descended from the same gene in the common ancestor via speciation would be referred to as orthologs, whereas a pair of genes present in the same or different species that seem to have been formed by a past duplication event would be called paralogs (Fitch 1970).
Identification of orthologs and paralogs may, however, become complicated if the genes under investigation have been subjected to a strong selection and have undergone a rapid divergence (in which case, it would be difficult to recognize their true evolutionary relationships by way of sequence similarity) (Bergsten 2005) or not all of the related genes have been preserved in the genome and thus could be subject to a phylogenetic analysis (in which case, erroneous groups may result on a phylogenetic tree and grouping patterns of genes may be interpreted in a wrong way) (Postlethwait 2007). Although these problems cannot be avoided completely, their negative impact on the accuracy of the assessment of homology can often be significantly reduced if several complementary measures are also taken. One such measure has been to examine the exon–intron structure of a gene, which varies largely independent of the nucleotide and amino acid sequences and can thus provide an additional layer of information for the analysis (Irimia and Roy 2008). More recently, it has been suggested that the conserved synteny—a tendency for neighboring genes to stay together on the same chromosome during evolution—may also be used to determine the orthology and paralogy of vertebrate genes (Catchen et al. 2009; Jun et al. 2009).
Among vertebrate genes that have been scrutinized for their evolutionary history are a family of transcription factors known as the T-box genes (Papaioannou and Silver 1998; Wilson and Conlon 2002). These genes are characterized by the possession of a highly conserved sequence motif of ∼540 nucleotides (the “T-box”), which encodes an ∼180 amino-acid DNA-binding domain (the “T-domain”) (Müller and Hermann 1997). To date, 18 different T-box genes have been isolated from the genomes of various tetrapods, which can be classified into eight different subfamilies (Tbx1 and Tbx10; Tbx2 and Tbx3; Tbx4 and Tbx5; Tbx6, Tbx16, and Mga; Tbx15, Tbx18, and Tbx22; Tbx19 and T; Tbx20; Tbx21, Tbr1, and Eomes) based on the similarity of T-domain sequences (Ruvinsky, Silver, et al. 2000). These genes have been shown to play critical roles in vertebrate development (Showell et al. 2004; Naiche et al. 2005; Plageman and Yutzey 2005; King et al. 2006; Peng 2006; Wardle and Papaioannou 2008), and mutations in T-box genes have been identified in several well-known hereditary disorders in humans (Packham and Brook 2003).
T-box genes have also been identified in the genomes of teleost fishes. In teleost fishes, T-box genes seem to be present in greater numbers than the tetrapods (Minguillon and Logan 2003), possibly because of the whole genome duplication event that had taken place close to the beginning of their evolutionary history (Taylor et al. 2003; Meyer and Van de Peer 2005). Genome duplication can pose challenges to the identification of the orthologs and paralogs by phylogenetic analysis because genes can undergo rapid divergence in sequence and function due to the redundancies provided by extra copies of themselves (Conant and Wagner 2003; Zhang et al. 2003; Brunet et al. 2006). Discrepancy in number of T-box genes between fish and tetrapods might also have arisen in part by an independent gain or loss of genes in tetrapods (Blomme et al. 2006), which can further complicate the orthology assignment between fish and tetrapod genes.
In zebrafish, 21 different T-box genes have been isolated to date (table 1), and for most of them, clear orthologs have been readily identified in the genomes of tetrapods (see Schulte-Merker et al. 1994; Ruvinsky et al. 1998, Dheen et al. 1999; Yonei-Tamura et al. 1999; Ahn et al. 2000; Ruvinsky, Oates, et al. 2000; Begemann et al. 2002; Lardelli 2003; Piotrowski et al. 2003; Takizawa et al. 2007; Martin and Kimelman 2008; Jezewski et al. 2009; Albalat et al. 2010; Mitra et al. 2010). However, for some T-box genes, such as tbx6 (Hug et al. 1997) and tbx24 (Nikaido et al. 2002), identification of their tetrapod orthologs has been problematic. These two genes, which, at the present moment, are considered to be either an ortholog of tetrapod Tbx6 gene (tbx6) or a novel gene with no clear orthologs in tetrapod genome (tbx24), belong to the Tbx6-Tbx16-Mga group (the Tbx6/16 subfamily) of vertebrate T-box genes (Lardelli 2003). Unlike other subfamilies of vertebrate T-box genes, however, the Tbx6/16 subfamily has been plagued by uncertain phylogenetic relationships among its members (see Ruvinsky, Silver, et al. 2000; Lardelli 2003), which so far have prevented the identification of the orthologs of these genes by standard phylogenetic analysis.
List of T-Box Genes Found in Human (Homo sapiens), Zebrafish (Danio rerio), and Amphioxus (Branchiostoma floridae) Genomes.
| T-Box Gene Subfamily | Amphioxus | Human | Zebrafish |
|---|---|---|---|
| Tbx1/10 | Amphi-Tbx1/10 | TBX1 | tbx1 |
| TBX10 | tbx10 | ||
| Tbx2/3 | Amphi-Tbx2/3 | TBX2 | tbx2a |
| tbx2b | |||
| TBX3 | tbx3a | ||
| tbx3b | |||
| Tbx4/5 | Amphi-Tbx4/5 | TBX4 | tbx4 |
| TBX5 | tbx5a | ||
| tbx5b | |||
| Tbx6/16 | Amphi-Tbx6d1 | —a | tbx6 |
| Amphi-Tbx6d2 | —a | tbx16 | |
| Amphi-Tbx6/16b | TBX6 | tbx24 | |
| MGA | mga-a | ||
| mga-b | |||
| Tbx15/18/22 | Amphi-Tbx15/18/22 | TBX15 | tbx15 |
| TBX18 | tbx18 | ||
| TBX22 | tbx22 | ||
| Tbx19/T | — | TBX19 | tbx19 |
| Amphi-Bra1 | T | ntl-a | |
| Amphi-Bra2 | ntl-b | ||
| Tbx20 | Amphi-Tbx20 | TBX20 | tbx20 |
| Eomes/Tbr1/Tbx21 | Amphi-Eomes/Tbr1/Tbx21 | EOMES | eom-a |
| eom-b | |||
| TBR1 | tbr1a | ||
| tbr1b | |||
| TBX21 | tbx21 | ||
| Total number of T-box genes | 11 | 17 | 26 |
Note.—For the complete sequence information and Genbank accession numbers of these genes, see supplementary figure S1, Supplementary Material onine.
aHuman orthologs of zebrafish tbx6 and tbx16 genes are not found.
bAlthough not allied with the Tbx6/16 subfamily genes on our phylogenetic tree (fig. 1), the Amphi-Tbx6/16 gene is located next to Amphi-Tbx6d2 gene (see amphioxus BAC clone, CH302-61A17 [Genbank accession No.: AC150413]) in the amphioxus genome, indicating that these genes are produced by a tandem duplication, and thus are related to each other.
In this article, we will show that, by including in the analysis some nonsequence information such as the similarity of exon–intron structure and the identity of neighborhood genes, much of the ambiguities surrounding the orthology between zebrafish and tetrapod Tbx6/16 subfamily genes can be successfully eliminated. We will first show that, like other T-box gene subfamilies (Ruvinsky, Silver, et al. 2000), the Tbx6/16 subfamily of vertebrate T-box genes is monophyletic. We will then show that, despite its name (Hug et al. 1997), the tbx6 gene of zebrafish is actually a novel gene related to tetrapod Tbx16 genes, whereas the zebrafish tbx24 gene, hitherto considered to be a novel gene without tetrapod orthologs (Nikaido et al. 2002), is actually an ortholog of tetrapod Tbx6 genes. Finally, we will show that the zebrafish tbx6 gene has an ancient origin, possibly appearing at the same time as the ancestral Tbx16 gene near the beginning of vertebrate evolution, but had since been lost from the genomes of the majority of vertebrates. Based on these, we propose that the evolutionary history of the Tbx6/16 subfamily of vertebrate T-box genes has been dominated by differential losses of member genes in different vertebrate groups and the resultant pooling of lost gene’s functions in surviving members, which has contributed to the creation of the well-known ambiguities in the phylogeny of Tbx6/16 subfamily genes.
Materials and Methods
Sequence Retrieval and Gene Identity Determination
Amino acid sequences of the T-box genes were retrieved from Genbank, Ensembl, and JGI databases. Genbank entries of T-box genes were retrieved by nucleotide search script using the keyword “T-box.” When multiple entries were found for the same gene, Genbank reference sequences (those with accession numbers starting with NM or XM) were chosen over other entries, except when the reference sequence was either unavailable or incomplete, in which case the one sequence judged to be most complete in the T-box region was chosen. In the case of splice variants, the first entry (variant 1 or variant A) was always chosen, although the choice of particular variants should have had no influence on our analysis, because our analysis (phylogenetic or otherwise) was mostly based on the sequences of T-box regions (i.e., the T-domains) and, for a given gene, all splice variants contained the same T-box sequences.
T-domain sequences were also retrieved from the Ensembl database (release 63) by BLASTp algorithm using the T-domain sequences of zebrafish tbx6 (NM_131052), mouse Tbx6 (NM_011538), or chicken Tbx6L (NM_001030367) genes as inputs. To ensure that every single T-domain sequences, including those that are not formally recognized in Ensembl database, had been retrieved from each genome, BLASTp was run twice, once on PEP_ALL data set (which includes the annotated sequences) and once on PEP_ABINITIO data set (which includes predicted but not formally recognized sequences). To retrieve T-domain sequences from the amphioxus genome, BLASTp was run at JGI site (Branchiostoma floridae v1.0) using the T-domain sequence of Amphi-Tbx2/3 gene (XM_002598876) as the input.
The T-box gene sequences retrieved from Ensembl database and JGI website were then compared against Genbank entries by BLAST algorithms to determine the identity and accuracy of sequences. When discrepancy was found in the amino acid sequence or in exon–intron structure for the same gene (usually because of mis-prediction of exons or exon–intron boundaries in “predicted” sequences), the entry with the most “conservative” T-domain sequence and exon–intron structure was chosen over others regardless of the source (Genbank, Ensembl, or JGI). Sequences from each species passing these screening procedures were then compiled together to generate the full, final complement of T-box gene sequences for the individual species examined in this study (tables 1–3; supplementary fig. S1, Supplementary Material online).
T-Box Gene Orthologs in the Genomes of Stickleback (Gasterosteus aculeatus: Gacu), Medaka (Oryzias latipes: Olat), Tiger Puffer Fish (Takifugu rubripes: Trub), and Green-Spotted Puffer Fish (Tetraodon nigroviridis: Tnig).
| Zebrafish T-Box Genes | Orthologs in Other Teleosts | |||
|---|---|---|---|---|
| Gacu | Olat | Trub | Tnig | |
| tbx1 | ✓ | ✓ | ✓ | ✓ |
| tbx2a | ✓ | ✓ | ✓ | ✓ |
| tbx2b | ✓ | ✓ | ✓ | ✓ |
| tbx3a | ✓ | ✓ | ✓ | ✓ |
| tbx3b | ✓ | —a | ✓ | ✓ |
| tbx4 | ✓ | ✓ | ✓ | ✓ |
| tbx5a | ✓ | ✓ | ✓ | ✓ |
| tbx5b | ✓ | ✓ | ✓ | ✓ |
| tbx6 | — | — | — | — |
| tbx10 | ✓ | ✓ | ✓ | ✓ |
| tbx15 | ✓ | ✓ | ✓ | ✓ |
| tbx16 | ✓✓b | ✓✓b | ✓ | ✓ |
| tbx18 | ✓ | ✓ | ✓ | ✓ |
| tbx19 | ✓ | ✓ | ✓ | ✓ |
| tbx20 | ✓ | ✓ | ✓ | ✓ |
| tbx21 | ✓ | ✓ | ✓ | ✓ |
| tbx22 | ✓ | ✓ | ✓ | ✓ |
| tbx24 | ✓ | ✓ | ✓ | ✓ |
| tbr1a | — | — | — | — |
| tbr1b | ✓ | ✓ | ✓ | ✓ |
| ntl-a | ✓ | ✓ | ✓ | ✓ |
| ntl-b | ✓ | ✓ | ✓ | ✓ |
| eom-a | ✓ | ✓ | ✓ | ✓ |
| eom-b | ✓ | ✓ | ✓ | ✓ |
| mga-a | ✓ | ✓ | ✓ | ✓ |
| mga-b | ✓ | ✓ | ✓ | ✓ |
| other | — | — | — | — |
| Total | 25 | 24 | 24 | 24 |
Note.—The presence (✓) or absence (—) of the orthologs are shown by respective symbols. Absence means that a candidate gene with sufficient sequence similarity (determined by BLAST hit patterns) occupying an equivalent genomic position (determined by local synteny) was not found in that genome.
aNo T-box gene was found in the genomic region between lman2l and tm2d2 of medaka, which in other teleost fishes would have constituted the genomic neighborhood of the tbx3b gene.
bIn stickleback and medaka, two tbx16 genes were found.
List of the T-Box Genes Found in the Genomes of Various Tetrapods.
| T-Box Genes | Mammals | Reptiles (including birds) | Amphibians | ||||||||||
|---|---|---|---|---|---|---|---|---|---|---|---|---|---|
| Placental Mammals | Marsupials | Monotreme | Birds | Lizard | Anuran | ||||||||
| Chimp | Rabbit | Dog | Elephant | Opossum | Wallaby | Platypus | Zebrafinch | Duck | Chicken | Turkey | Anole | Clawed Frog | |
| Tbx1 | ✓ | ✓ | ✓ | ✓ | ✓ | ✓ | ✓ | ✓ | ✓ | ✓ | ? | ? | ✓ |
| Tbx2 | ✓ | ✓ | ✓ | ✓ | ✓ | ✓ | ✓ | ✓ | ✓ | ✓ | ✓ | ✓ | ✓ |
| Tbx3 | ✓ | ✓ | ✓ | ✓ | ✓ | ✓ | ✓ | ✓ | ✓ | ✓ | ✓ | ✓ | ✓ |
| Tbx4 | ✓ | ✓ | ✓ | ✓ | ✓ | ✓ | ✓ | ✓ | ✓ | ✓ | ✓ | ✓ | ✓ |
| Tbx5 | ✓ | ✓ | ✓ | ✓ | ✓ | ✓ | ✓ | ✓ | ✓ | ✓ | ✓ | ✓ | ✓ |
| Tbx6 | ✓ | ✓ | ✓ | ✓ | ✓ | ✓ | ✓ | ? | ? | ? | ? | ✓ | ✓ |
| Tbx10 | ✓ | ? | ✓ | ✓ | ✓ | ✓ | ? | ✓ | ? | ✓ | ✓ | ✓ | ? |
| Tbx15 | ✓ | ✓ | ✓ | ✓ | ✓ | ✓ | ✓ | ✓ | ✓ | ✓ | ✓ | ✓ | ✓ |
| Tbx16 | – | – | – | – | ✓ | ✓ | ✓ | ✓ | ✓ | ✓ | ✓ | ✓ | ✓ |
| Tbx18 | ✓ | ✓ | ✓ | ✓ | ✓ | ✓ | ✓ | ✓ | ✓ | ✓ | ✓ | ✓ | ✓ |
| Tbx19 | ✓ | ✓ | ✓ | ✓ | ✓ | ✓ | ✓ | ✓ | ✓ | ✓ | ✓ | ✓ | ? |
| Tbx20 | ✓ | ✓ | ✓ | ✓ | ✓ | ✓ | ✓ | ✓ | ✓ | ✓ | ✓ | ✓ | ✓ |
| Tbx21 | ✓ | ✓ | ✓ | ✓ | ✓ | ✓ | ✓ | ? | ? | ? | ✓ | ✓ | ✓ |
| Tbx22 | ✓ | ✓ | – | ✓ | ✓ | ✓ | ✓ | ✓ | ✓ | ✓ | ✓ | ✓ | ✓ |
| T | ✓ | ✓ | ✓ | ✓ | ✓ | ? | ✓ | ✓ | ✓ | ✓ | ✓ | ✓ | ✓ |
| Tbr1 | ✓ | ✓ | ✓ | ✓ | ✓ | ✓ | ✓ | ✓ | ✓ | ✓ | ✓ | ✓ | ✓ |
| Eomes | ✓ | ✓ | ✓ | ✓ | ✓ | ✓ | ✓ | ✓ | ✓ | ✓ | ✓ | ✓ | ✓ |
| Mga | ✓ | ✓ | ✓ | ✓ | ✓ | ✓ | ✓ | ✓ | ✓ | ✓ | ✓ | ✓ | ✓ |
| Other | — | — | — | — | — | ✓a | — | — | — | — | — | — | ✓✓b |
| Total | 17c | 16 | 16 | 17 | 18d | 18d | 17 | 16e | 15e | 16e | 16e | 17 | 18 |
Note.—The species examined include the following: chimpanzee (Pan troglodytes); rabbit (Oryctolagus cuniculus); dog (Canis familiaris); African elephant (Loxodonta africana); gray short-tailed opossum (Monodelphis domestica); tammar wallaby (Macropus eugenii); platypus (Ornithorhynchus anatinus); zebrafinch (Taeniopygia guttata); duck (Anas platyrhynchos); chicken (Gallus gallus); turkey (Meleagris gallopavo); green anole lizard (Anolis carolinensis); and western clawed frog (Xenopus tropicalis). “✓” and “–” denote the presence and absence of genes, respectively. “?” denotes cases in which the presence or absence of a gene could not be determined (may or may not be present). Absence means that no gene with sufficient sequence similarity occupying an equivalent genomic position was found in that genome. If the gene’s likely position within the genome could not be reasonably determined using synteny criteria or if a large sequencing gap was found in the relevant region, the gene was listed as “status unknown (?).”
aWallaby (Macropus eugenii) has an extra Tbx21 gene.
bWestern clawed frog (Xenopus tropicalis) has two additional T-box genes: T2, a gene related to Brachyury, and Tbx6r, a potentially novel gene related to Tbx6.
cIn addition to the full set of 17 T-box genes found in placental mammals, chimpanzee (Pan troglodytes) has a Tbx20 pseudogene (XM_001148131) containing only the exons 5–8 of the Tbx20 gene. This pseudogene is apparently the ortholog of the TBX20 pseudogene found in humans, which has the same exon–intron structure (Hammer et al. 2008).
dMarsupials have a large number of pseudogenic T-box sequences of Eomes/Tbr1/Tbx21-type that are characterized by incomplete sequence, simplified exon–intron structure, and/or tandem duplication.
eA large number of genes constituting the putative genomic neighborhood of Tbx6 orthologs were also not found in currently sequenced bird genomes (supplementary fig. S8B, Supplementary Material online). It is likely that the Tbx6 orthologs of birds, if present, are located in the genomic regions that are particularly resistant to the cloning and/or sequencing (see International Chicken Genome Sequencing Consortium 2004, Supplementary Methods and Information).
Phylogenetic Analysis
For the construction of phylogenetic trees, either the full set (figs. 1 and 7B; supplementary fig. S3, Supplementary Material online) or an appropriate subset (fig. 4D) of T-domain sequences from selected species were aligned using the Muscle algorithm (Edgar 2004) implemented in SeaView phylogenetic analysis package (Gouy et al. 2010). Initial alignments were then visually inspected and appropriate local adjustments were made to improve the accuracy of the alignment. Because only the T-domains could be aligned with confidence across the whole spectrum of T-box genes (data not shown), we relied on the sequences of T-domains for the construction of phylogenies. After masking the unalignable regions (supplementary figs. S2 and Supplementary Data, Supplementary Material online), aligned sequences were examined by ProtTest program (Abascal et al. 2005) to determine the best-fit models of protein sequence evolution for the maximum likelihood analysis. Phylogeny of T-box genes was then determined using the maximum likelihood (as implemented in PhyML program: Guindon and Gascuel 2003) and neighbor-joining (as implemented in BioNJ algorithm: Gascuel 1997) algorithms run in SeaView package, using the masked sequence data sets (supplementary figs. S2 and Supplementary Data, Supplementary Material online) as inputs. Statistical supports for the resulting groups on each tree were estimated by approximate likelihood-ratio test (aLRT: Anisimova and Gascuel 2006) for maximum likelihood (figs. 1, 4D, and 7B) and standard bootstrap test (Felsenstein 1985) for neighbor-joining analysis (supplementary fig. S3, Supplementary Material online).
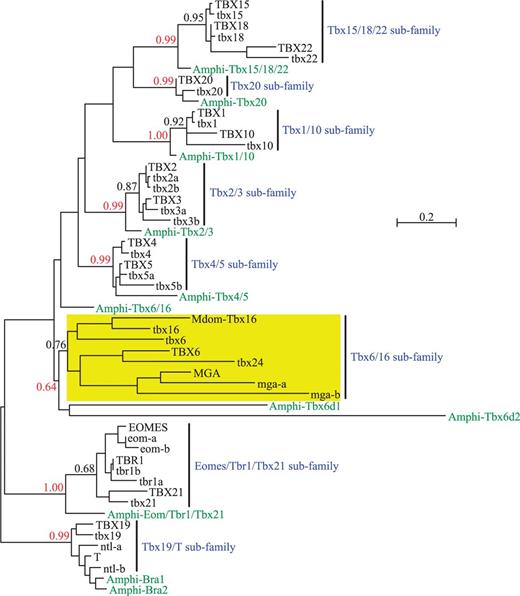
Phylogeny of chordate T-box genes (represented by the T-box genes from human, zebrafish, and amphioxus) showing the monophyly of Tbx6/16 subfamily. Tree was built by the maximum likelihood algorithm using the LG + G model of protein evolution (Le and Gascuel 2008). Approximate likelihood-ratio test (aLRT) values are given for the nodes representing each vertebrate T-box gene subfamily or vertebrate subfamily plus its amphioxus ortholog(s). Scale bar represents 0.2 amino acid substitutions per site. Note that the Tbx6/16 subfamily is monophyletic in this tree just like any other subfamilies of vertebrate T-box genes. Note also that the basic topology of this tree is independent of the choice of vertebrate species included in the analysis (the same result was obtained when human was replaced with mouse or when zebrafish was replaced with Takifugu; data not shown). For Genbank accession numbers and full-length amino acid sequences of these genes, see supplementary figure S1, Supplementary Material online. For the alignment of amino acid sequences used in the phylogenetic analysis, see supplementary figure S2, Supplementary Material online. For the phylogeny of T-box genes generated by the neighbor-joining algorithm, see supplementary figure S3, Supplementary Material online. Mdom, Monodelphis domestica (gray short-tailed opossum).
Analysis of Exon–Intron Structure
Full exon–intron structure was determined for human TBX6 (NM_004608), chicken Tbx6L (NM_001030367), and zebrafish tbx6 (NM_131052), tbx16 (NM_131058), and tbx24 (NM_153666) genes by comparing respective cDNA sequences with the corresponding genomic sequences from Ensembl database. cDNA and genomic sequences were aligned using Spidey program (http://www.ncbi.nlm.nih.gov/IEB/Research/Ostell/Spidey/index.html), and the size of exons and the positions of exon–intron boundaries were determined. Exon–intron structures were also examined for the T-box regions of all human and zebrafish T-box genes identified in this study (supplementary fig. S4, Supplementary Material online) and were then compared against each other to determine their diagnostic values for subfamily memberships.
Analysis of Synteny
The extent of the preservation of genomic neighborhoods between zebrafish tbx6, tbx16, and tbx24 genes and their potential human and chicken orthologs was examined in Ensembl database using Synteny Database (ens61 variant) (http://teleost.cs.uoregon.edu/synteny_db/) (Catchen et al. 2009) and Genomicus Browser (version 63.01) (http://www.dyogen.ens.fr/genomicus-63.01/cgi-bin/search.pl) (Muffato et al. 2010) as the main visualization tools. Spatial distribution of zebrafish orthologs of the genes neighboring tetrapod T-box genes was first examined at the chromosome level by Synteny Database, which provides a bird’s-eye view of the whole genome (figs. 2B, 3B, and 5B, and supplementary fig. S7B, Supplementary Material online), and then at the local neighborhood level by Genomicus Browser, which provides a detailed gene-by-gene information for the relative location(s) of each tetrapod gene’s zebrafish ortholog(s) on an individual chromosome (figs. 2C, 3C, 5A, and supplementary fig. S7A; also see supplementary fig. S5, Supplementary Material online). To compensate for the reduction of synteny that might result from a balanced loss of genes in duplicated chromosomal regions (supplementary fig. S9A, Supplementary Material online) or by a small-scale translocation event (supplementary fig. S9B, Supplementary Material online) in teleost genomes, whenever practical, the overall preservation of synteny between zebrafish and tetrapod genes was determined from the multi-way comparisons involving corresponding regions of a tetrapod chromosome and several related zebrafish chromosomes, the latter of which have been produced by the past duplication and/or translocation events within the zebrafish genome (supplementary fig. S5, Supplementary Material online).
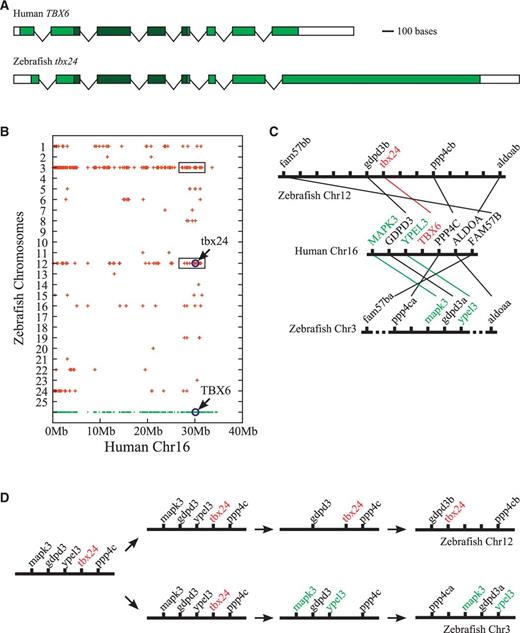
Orthology between zebrafish tbx24 and human TBX6 genes. (A) Exon–intron structures of zebrafish tbx24 (NM_153666) and human TBX6 (NM_004608) genes. Boxes represent exons with shaded regions denoting the protein-coding sequences. T-box sequences are differentiated by a darker shade. Note the similarity of exon–intron structure between the two genes. Scale bar represents 100 nucleotides. Distances between exons are not drawn in scale. (B) Dot plot diagram showing the chromosomal distribution of zebrafish genes related to the human chromosome 16 genes. The human genes are represented by dots in the bottom row, which denote the chromosomal locations of human genes in terms of the distances from the telomere. The apparent absence of human genes in 35–40 Mb region is due to the presence of centromeric sequences in that region. Only the genes on the short (p) arm of human chromosome 16 are shown. Zebrafish genes considered orthologous to human chromosome 16 genes are represented by crosses drawn above the corresponding human genes on a series of invisible parallel lines representing individual zebrafish chromosomes. Note that what is represented by crosses is just the presence of zebrafish orthologs, not the actual locations of those orthologs, on a particular zebrafish chromosome. For example, in the dot plot, zebrafish tbx24 gene is drawn directly above human TBX6 gene at the 30 Mb point from the telomere to represent the orthology between these two genes, but tbx24’s actual location is at the 4.60 Mb point, not 30 Mb point, from the telomere (at 0 Mb point). Notice that human genes neighboring TBX6 have most of their zebrafish orthologs on chromosomes 3 and 12 (boxed regions). (C) Local synteny trace diagram showing the orthology between human genes in the genomic neighborhood of human TBX6 and zebrafish genes on the corresponding regons of zebrafish chromosomes. Genes and chromosomes are represented in the diagram by short vertical lines and thick horizontal lines, respectively. For zebrafish chromosomes, only those genes that are orthologous to at least one human gene in the middle portion of the figure are identified by names. Orthologous correspondences between human and zebrafish genes are represented by thin lines. Human and zebrafish genes showing a 1-to-1 rather than 1-to-2 correspondence (indicating the loss of one of the duplicates in the zebrafish genome) are differentially marked. Hatched lines in zebrafish chromosome 3 separating fam57ba and aldoaa from the central 5-gene cluster represent the presence of a number of other genes in the corresponding intervals. Distances between genes are not drawn to scale. Note that tbx24 and TBX6 genes are surrounded by similar sets of genomic neighbors. (D) Scenario for the evolution of tbx24-containing region of zebrafish chromosome 12 and its paralogous counterpart on zebrafish chromosome 3. According to this scenario, the two regions have undergone a balanced loss of genes after the duplication, which had eliminated the second copy of tbx24 from chromosome 3 and copies of mapk3 and ypel3 from chromosome 12. Present-day conditions result from the rearrangement of genes within each chromosome after the loss.
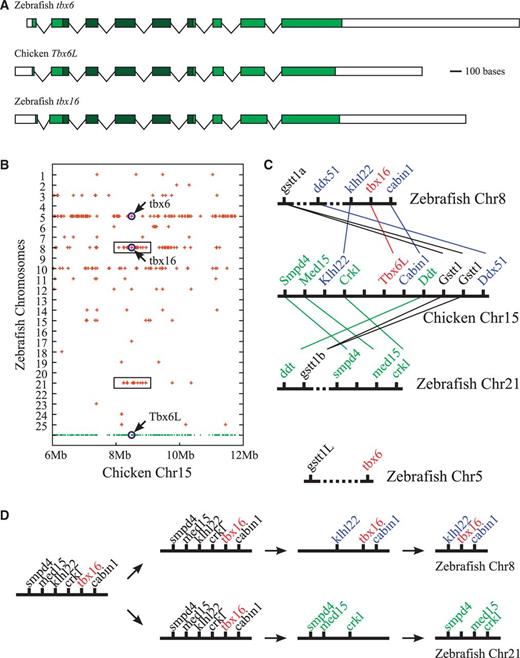
Orthology between zebrafish tbx16 and chicken Tbx6L genes. (A) Exon–intron structures of zebrafish tbx16 (NM_131058), chicken Tbx6L (NM_001030367), and zebrafish tbx6 (NM_131052) genes. Boxes represent exons with shaded regions denoting the protein-coding sequences. T-box sequences are differentiated by a darker shade. Note the similarity of exon–intron structures among these three genes, especially between tbx16 and Tbx6L. Also notice that Tbx16 genes differ from Tbx6 genes in that Tbx16 genes have 5-exon T-boxes whereas the Tbx6 genes have 4-exon T-boxes (compare with fig. 2A). Scale bar represents 100 nucleotides. Distances between exons are not drawn to scale. (B) Dot plot diagram showing the chromosomal distribution of zebrafish genes related to the chicken chromosome 15 genes. Chicken genes are represented by dots at the bottom row. Only the genes in the 6–12 Mb region are shown. Zebrafish genes considered orthologous to the chicken chromosome 15 genes are represented by crosses placed above the corresponding chicken genes. Note that crosses represent only the presence of zebrafish orthologs, not the actual locations of those orthologs, on a particular zebrafish chromosome. Notice that chicken genes neighboring Tbx6L have their zebrafish orthologs mostly on chromosomes 8 and 21 (boxed regions) and, to a much less extent, also on chromosomes 5 and 10. (C) Local synteny trace diagram showing the orthology between chicken genes in the genomic neighborhood of Tbx6L and zebrafish genes on the corresponding regons of zebrafish chromosomes. Genes and chromosomes are represented in the diagram by short vertical lines and thick horizontal lines, respectively. Orthologous correspondences between chicken and zebrafish genes are represented by thin lines. Line of orthologous correspondence was not drawn for zebrafish tbx6 and gstt1L genes because the orthology between these genes and chicken Tbx6L and Gstt1 genes is uncertain (supplementary fig. S5B, Supplementary Material online). Consecutive presence of two Gstt1 genes on chicken chromosome 15 is likely due to a duplication of this gene in the chicken lineage. Hatched lines in zebrafish chromosomes 8 and 21 represent the presence of a large number of other genes in the corresponding intervals. Longer hatched line in zebrafish chromosome 5 denotes a particualrly long distance of separation (approximately 33 Mb) between tbx6 and gstt1L. Distances between genes are not drawn to scale. Note that tbx16 and Tbx6L genes have similar sets of genomic near-neighbors whereas the tbx6 gene has little in commom with these genes in terms of the identity of the genes in the neighboring regions (supplementary fig. S5B, Supplementary Material online). (D) Scenario for the evolution of tbx16-containing region of zebrafish chromosome 8 and its paralogous counterpart on zebrafish chromosome 21. The two regions seem to have undergone a balanced loss of genes after the duplication, which had eliminated the copies of smpd4, med15, and crkl genes from chromosome 8 and the copies of klhl22, tbx16, and cabin1 genes from chromosome 21. Present-day configuration of genes results from the rearrangement of genes within each chromosome after the loss.
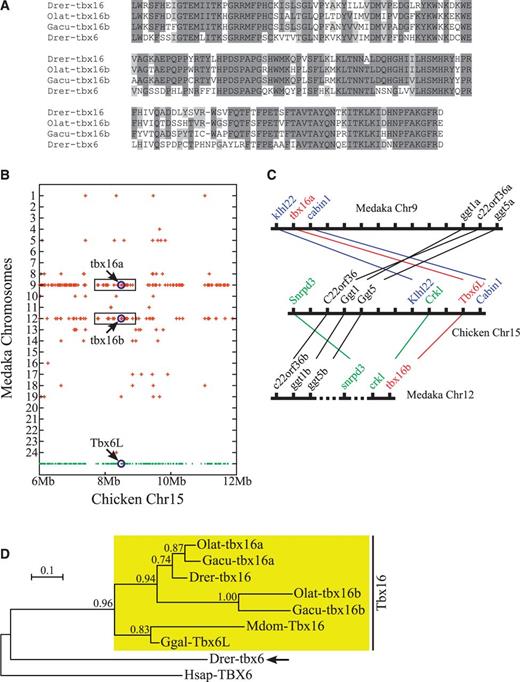
Evolutionary relationship between zebrafish tbx6 and teleost tbx16b genes. (A) Comparison of the amino acid sequences of the T-domains between zebrafish (Drer) tbx6/tbx16 genes and the tbx16b genes of medaka (Olat) and stickleback (Gacu). Sequences are compared between the two tbx16b genes and zebrafish tbx16, and then between tbx16b genes and zebrafish tbx6 gene. Amino acid residues that are conserved in tbx16b genes and also are shared with at least one of the zebrafish genes are shaded in dark gray. Residues that are different between the two tbx16b genes but are shared with at least one of the zebrafish genes are shaded in light gray. Note that sequence similarity is higher between tbx16b genes and zebrafish tbx16 than between tbx16b genes and zebrafish tbx6 gene (86.4% and 85.1% amino acid identities in Olat tbx16b-Drer tbx16 and Gacu tbx16b-Drer tbx16 comparisons versus 65.6% and 64.3% amino acid identities in Olat tbx16b-Drer tbx6 and Gacu tbx16b-Drer tbx6 comparisons). This suggests that the two tbx16b genes are much more closely related to the tbx16 than to the tbx6 gene of zebrafish. (B) Dot plot diagram showing the chromosomal distribution of medaka genes related to the chicken chromosome 15 genes. Chicken genes are represented by dots at the bottom row. Only the genes in 6–12 Mb chromosomal region are shown. Medaka genes considered orthologous to the chicken chromosome 15 genes are represented by crosses drawn above the corresponding chicken genes. Note that crosses represent just the presence of orthologs, not the actual locations of those orthologs, on a particular chromosome of medaka. Also notice that chicken genes neighboring Tbx6L have their medaka orthologs mostly on chromosomes 9 and 12 (boxed regions), which contain the two tbx16 genes of medaka. (C) Local synteny trace diagram showing the orthology between chicken genes in the genomic neighborhood of Tbx6L and medaka genes on the corresponding regions of medaka chromosomes. Genes and chromosomes are represented in the diagram by short vertical lines and thick horizontal lines, respectively. Orthologous correspondences between chicken and medaka genes are represented by thin lines. Hatched lines in medaka chromosome 12 represent the presence of a large number of other genes in the corresponding intervals. Distances between genes are not drawn to scale. Note that medaka has two copies of tbx16 gene with one copy (tbx16a) occupying the same relative genomic position as the zebrafish tbx16 gene (fig. 3C) and the second copy (tbx16b) occupying the exact position expected for the tbx16’s duplicate on the paralogous chromosome that had undergone balanced loss of genes after the duplication (fig. 3D). (D) Phylogeny of vertebrate Tbx16 genes. Tree was built by maximum likelihood algorithm using the JTT + I + G model of protein evolution (Jones et al. 1992). Approximate likelihood-ratio test (aLRT) values are given for each node. Scale bar represents 0.1 amino acid substitutions per site. Note that, in this phylogeny, zebrafish tbx6 gene (arrow) is placed outside of a large gene cluster made of the entire Tbx16 orthologs, suggesting that zebrafish tbx6 gene is a novel gene rather than an ortholog of teleost tbx16b genes. Human (Hsap) TBX6 gene was used as an outgroup. For the alignment of the amino acid sequences of T-domains used in the phylogenetic analysis, see supplementary figure S6A, Supplementary Material online. Mdom, Monodelphis domestica (gray short-tailed opossum); Ggal, Gallus gallus (chicken).
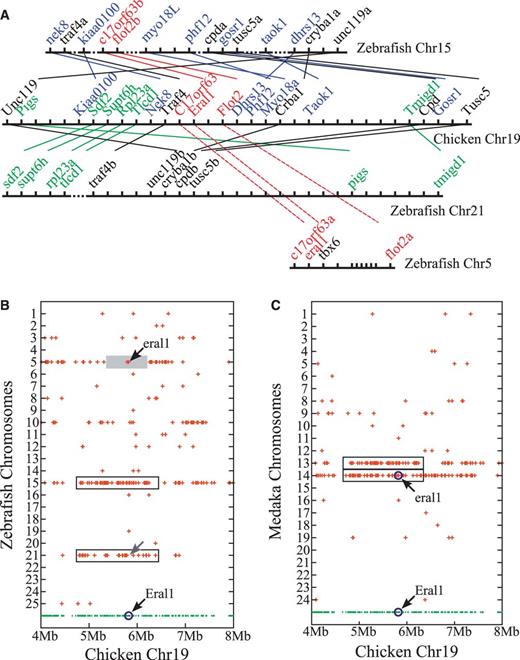
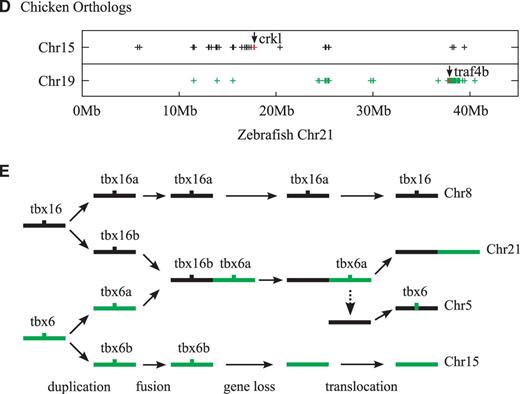
Evolution of the tbx6-containing chromosomal region in zebrafish. (A) Local synteny trace diagram showing the orthology between chicken genes in the genomic neighborhood of C17orf63-Eral1-Flot2 gene cluster (on chromosome 19) and zebrafish chromosome 5, 15, and 21 genes. Genes and chromosomes are represented in the diagram by short vertical and long horizontal lines, respectively. Orthologous correspondences between chicken and zebrafish genes are represented by thin lines. Hatched lines in zebrafish chromosomes represent the presence of a large number of other genes in the corresponding intervals. Short hatched lines in zebrafish chromosome 15 denote intervals containing less than 10 genes. Distances between genes are not drawn to scale. Tight packing of six genes on zebrafish chromosome 5 represents tandem duplication of a pim3-like gene. Note that in the genomic regions shown here zebrafish chromosomes 15 and 21 effectively form a paralogous pair. Notice that, over the interval containing C17orf63, Eral1, and Flot2 genes, orthologous correspondences between chicken and zebrafish genes suddenly shift from between chicken chromosome 19 and zebrafish chromosome 21 (solid lines) to between chicken chromosome 19 and zebrafish chromosome 5 (hatched lines). (B) Dot plot diagram showing the chromosomal distribution of zebrafish genes related to the chicken chromosome 19 genes. Chicken genes are represented by dots at the bottom row. Only the genes in 4–8 Mb region are shown. Zebrafish genes considered orthologous to the chicken chromosome 19 genes are represented by crosses drawn above the corresponding chicken genes. Note that crosses represent only the presence of zebrafish orthologs, not the actual locations of those orthologs, on a particular zebrafish chromosome. Notice that chicken genes neighboring Eral1 have their zebrafish orthologs mostly on chromosomes 15 and 21 (boxed regions), although Eral1 itself and its two immediate neighbors, C17orf63 and Flot2, have their zebrafish orthologs in an isolated region on chromosome 5 (shaded area). Also notice that zebrafish chromosome 21 has a small break in synteny (gray arrow) indicating the absence of the orthologs of C17orf63, Eral1, and Flot2 genes on this chromosome. (C) Dot plot diagram showing the chromosomal distribution of medaka genes related to the chicken chromosome 19 genes. Chicken genes are represented by dots at the bottom row. Medaka genes considered orthologous to the chicken chromosome 19 genes are represented by crosses drawn above the corresponding chicken genes. Note that the placement of crosses represents just the presence of the orthologs, not the actual locations of orthologs, on a particular medaka chromosome. Notice that, over this segment of chicken chromosome 19 (4–8 Mb region), medaka chromosomes 13 and 14 form a paralogous pair (boxed regions). Also notice that, unlike zebrafish eral1, medaka eral1 is syntenic to the orthologs of chicken genes located in the neighborhood of C17orf63-Eral1-Flot2 cluster. (D) Scaled dot plot diagram showing the distribution of zebrafish chromosome 21 genes related to the chicken chromosome 15 and 19 genes in terms of their actual chromosomal locations. Zebrafish chromosome 21 genes that are considered orthologous to the chicken chromosome 15 and 19 genes are represented by crosses according to their actual distances from the telomere. Note that, on chromosome 21, the zebrafish crkl and traf4b genes—genomic near-neighbors of the missing second copy of tbx16 gene and the pre-translocation tbx6 gene, respectively (figs. 3D and 5A)—are located in two widely separated regions. Notice that, on chromosome 21, zebrafish orthologs of chicken chromosome 15 and 19 genes are distributed in two largely nonoverlapping clusters, indicating that zebrafish chromosome 21 is the product of fusion between two chromosomal segments of different evolutionary origins. (E) Scenario for the evolution of the tbx6-containing chromosome region in zebrafish. After the teleost-specific whole genome duplication (Meyer and Van de Peer 2005) and after the separation of zebrafish from other lineages of teleost fishes (Kasahara et al. 2007), one of the duplicate chromosome regions containing a copy of tbx16 (“tbx16b”) was fused to another duplicate chromosome region carrying a copy of tbx6 (“tbx6a”). The resulting composite chromosome region subsequently lost its copies of tbx16 by a degeneration (or a deletion) and tbx6 by a translocation and eventually became a major part of the chromosome 21. The other duplicate chromosome regions, which carry copies of tbx16 and tbx6 genes, became incorporated into the chromosomes 8 and 15, respectively. Eventually, only the copy of tbx16 on chromosome 8 (the ortholog of tbx16a genes of medaka and stickleback; fig. 4D) and the copy of tbx6 that was translocated onto chromosome 5 have survived. Note that, as a consequence, zebrafish chromosome 21 is now in one part paralogous to chromosome 8 and in another part paralogous to chromosome 15 (fig. 5D).
Results
Vertebrate Tbx6/16 Subfamily Genes Are Monophyletic
To determine the evolutionary relationships between the Tbx6/16-like genes of zebrafish (tbx6, tbx16, tbx24, and mga genes) and those of tetrapods (Tbx6, Tbx16, and Mga genes) (Lardelli 2003), we first re-examined the phylogeny of Tbx6/16 subfamily genes in vertebrates. Previous phylogenetic analyses have indicated that (Papaioannou and Silver 1998; Ruvinsky, Silver, et al. 2000; Lardelli 2003), in the context of the total phylogeny of vertebrate T-box genes, Tbx6/16-like genes in vertebrates do not form a monophyletic group. This implies that, unlike other T-box gene subfamilies, Tbx6/16 subfamily might be a heterogeneous assembly made of genes of disparate, maybe even distant, evolutionary origins. However, this runs counter to the well-known similarity in sequence, expression, and function of Tbx6/16-like genes in vertebrates (Chapman et al. 1996; Hug et al. 1997; Knezevic et al. 1997; Griffin et al. 1998; Stennard et al. 1999; Nikaido et al. 2002; Chapman et al. 2003; Tazumi et al. 2008), which support close evolutionary relationships among these genes.
To resolve this conflict, we first re-visited previous phylogenies of vertebrate T-box genes. We found that, in previous investigations, fully representative samples of vertebrate T-box genes had not been used in the analysis. For example, in Ruvinsky, Silver, et al.’s (2000) initial analysis, Mga genes, then unknown, had not been used, whereas in the later analysis incorporating the Mga genes (Lardelli 2003), only 11 out of 18 different types of known T-box genes had been used. Increase in sample sizes and better sampling have been shown to improve the accuracy of phylogenetic analysis under a variety of circumstances (Graybeal 1998; Zwickl and Hillis 2002), and therefore we undertook a comprehensive search for the T-box genes in human, zebrafish, and amphioxus genomes (see Materials and Methods for details), for which reasonably complete sequence information is now available.
In the human genome, we have found no additional T-box genes other than those 17 genes that are already known from the literature (see Naiche et al. 2005). In zebrafish, however, we have identified five additional T-box genes, which bring the total number of zebrafish T-box genes to 26 (table 1). In the amphioxus (Branchiostoma floridae) genome, we have retrieved 11 different T-box sequences (table 1), which are 2 more than those previously reported in the literature (Ruvinsky, Silver, et al. 2000). An initial inspection of these additional genes by BLAST algorithm against Genbank entries has shown that, in zebrafish, no “novel” T-box genes have been recovered, whereas in amphioxus, two highly divergent new T-box genes—which we will call Amphi-Tbx6d1 (XM_002588055) and Amphi-Tbx6d2 (JGI_86982)—that are weakly similar to the Tbx6-like genes of invertebrates and the Tbx2/3/4/5 genes of vertebrates (data not shown) have been isolated (see supplementary fig. S1, Supplementary Material online, for the complete sequences of human, zebrafish, and amphioxus T-box genes isolated in this study).
Because humans do not seem to have a homolog of Tbx16 and therefore lack a critical member of the Tbx6/16 subfamily (Lardelli 2003), we have included the Tbx16 gene of a marsupial (XM_001377868), the gray short-tailed opossum Monodelphis domestica, in the human data set for our phylogenetic analysis (supplementary fig. S2, Supplementary Material online). This effectively created an amphioxus-tetrapod-teleost comparison, which would allow us to follow the birth and subsequent evolution of vertebrate T-box genes through the process of whole genome duplication (Ruvinsky, Silver, et al. 2000). For the phylogenetic analysis, we have used both maximum likelihood (Felsenstein 1981) and neighbor-joining (Saitou and Nei 1987; Gascuel 1997) algorithms, which allowed us to compare our results with those of others. We found that the Tbx6/16 subfamily genes came out as a monophyletic group in both of our phylogenetic analyses like any other subfamilies of vertebrate T-box genes (fig. 1 and supplementary fig. S3, Supplementary Material online). In the analysis based on maximum likelihood (but not neighbor-joining) algorithm, statistical support for the monophyly of Tbx6/16 subfamily genes was also very strong, with an aLRT (approximate likelihood-ratio test: Anisimova and Gascuel 2006) value quite comparable with those assigned for other subfamilies of vertebrate T-box genes (fig. 1).
Comparisons with the previous phylogenies of Ruvinsky, Silver, et al. (2000) and Belgacem et al. (2011) have indicated that the inclusion of Mga sequences in our data set had a profound influence on the performance of neighbor-joining analysis, which produced a monophyletic Tbx6/16 subfamily only in the presence of Mga sequences (data not shown). Interestingly, the same effect was not seen in maximum likelihood analysis, which produced a monophyletic Tbx6/16 subfamily irrespective of the presence of Mga sequences (data not shown). Inclusion of new amphioxus sequences, on the other hand, had little influence on overall grouping patterns (data not shown), although in the maximum likelihood analysis, the two new amphioxus genes Amphi-Tbx6d1 and Amphi-Tbx6d2 were grouped together basal to vertebrate Tbx6/16 subfamily genes (fig. 1), thereby substituting the Amphi-Tbx6/16 gene (Ruvinsky, Silver, et al. 2000; Belgacem et al. 2011) as the closest chordate relatives of the vertebrate Tbx6/16-like genes.
Zebrafish tbx24 Gene Is an Ortholog of Tetrapod Tbx6 Genes
The result of our phylogenetic analysis indicated that within the Tbx6/16 subfamily the tbx24 gene of zebrafish is most closely related to the TBX6 gene of humans (fig. 1). tbx24, which was originally isolated as the gene mutated in zebrafish fused somites (fss) mutant (van Eeden et al. 1996), was named as such because of the high degree of sequence divergence in its T-domain (Nikaido et al. 2002). However, in later studies, it has repeatedly been shown that phylogenetically this gene is most closely related to the Tbx6 genes of tetrapods (Lardelli 2003; Yamada et al. 2007; Takeuchi et al. 2009; Belgacem et al. 2011). This gene is also similar to the Tbx6 genes of mouse and Xenopus in terms of its expression within the early mesoderm (Chapman et al. 1996; Uchiyama et al. 2001) as well as its functions in defining somite boundaries during later stages (Watabe-Rudolph et al. 2002; White et al. 2003; Hitachi et al. 2008).
To determine whether tbx24 is indeed the fish ortholog of tetrapod Tbx6 gene, we first examined its exon–intron structure. In the zebrafish genome, the coding sequence of tbx24 is split into 8 exons, in which the T-box is contained within the exons 2 to 5 (fig. 2A). This organization is identical to the exon–intron structure of human TBX6 gene (fig. 2A), which indicates that the similarity between zebrafish tbx24 and tetrapod Tbx6 genes may go beyond a mere conservation of sequences at the amino acid level. Moreover, in terms of the exon–intron structure of the T-box region, tbx24 differs from all the other T-box genes in the Tbx6/16 subfamily, except for human TBX6 (supplementary fig. S4, Supplementary Material online), indicating that, for the T-box genes, the exon–intron structure of the T-box region (and possibly the entire coding sequence as well) may contain diagnostic information helpful for the determination of orthology (see Wattler et al. 1998).
We then examined the genomic neighborhood of tbx24 gene in the zebrafish genome to determine whether tbx24 is surrounded by genes that are orthologous to the genes neighboring TBX6 in humans. Because neighboring genes tend to stay together during evolution (Dewey 2011; Kristensen et al. 2011), genes occupying similar relative positions in different genomes have a higher likelihood of being orthologs, which can be useful in determining the orthologies in problematic situations (Zheng et al. 2005; Jun et al. 2009). According to the most recent version of the human genome assembly (GRCh37; Feb. 2009), TBX6 gene of humans is located on the short arm of chromosome 16, in a region close to the centromere (fig. 2B). Examination of the dot plot diagram from the Synteny Database, which shows the chromosomal distribution of zebrafish genes related to the tetrapod genes from a selected chromosome (in this case, human chromosome 16), indicated that the human genes in the genomic neighborhood of TBX6 have their zebrafish orthologs mostly on the chromosomes 3 and 12 of zebrafish (fig. 2B, boxed regions).
Upon closer inspection, it was evident that several of the human genes present in the immediate neighborhood of TBX6, such as GDPD3, PPP4C, ALDOA, and FAM57B, have their zebrafish orthologs in the genomic neighborhood of tbx24 gene on the chromosome 12 (fig. 2C, upper half). Interestingly, similar comparisons between the genes of human chromosome 16 and zebrafish chromosome 3 had indicated that there is another cluster of genes, which also contains the zebrafish orthologs of human genes in the genomic neighborhood of TBX6 (fig. 2C, lower half). Notably, this second cluster on zebrafish chromosome 3 includes ppp4ca and gdpd3a genes, which are the paralogs of zebrafish chromosome 12 genes ppp4cb and gdpd3b (fig. 2C). This indicates that the zebrafish chromosome 3 region containing this gene cluster is likely to be the paralogous counterpart of the tbx24-containing region of zebrafish chromosome 12 (supplementary fig. S5A, Supplementary Material online), which had been generated by the teleost-specific whole genome duplication event.
Compared with the genomic neighborhood of TBX6 and the tbx24-containing region of chromosome 12 (fig. 2C), this second region on zebrafish chromosome 3 is missing a T-box gene related to human TBX6 but shows a better preservation of gene order (fig. 2C, lower half). Significantly, this region contains zebrafish orthologs of human MAPK3 and YPEL3 genes, the counterparts of which are not found in the tbx24-containing region of zebrafish chromosome 12 (fig. 2C). This suggests that, after the duplication event, these two regions must have undergone a balanced loss of genes, which had eliminated copies of mapk3 and ypel3 genes from the chromosome 12 and a copy of tbx24 gene from the chromosome 3 (fig. 2D). Therefore, at one time, the genomic neighborhood of tbx24 in zebrafish must have included not only the orthologs of GDPD3, PPP4C, ALDOA, and FAM57B genes but also the orthologs of MAPK3 and YPEL3 genes as well (fig. 2D). This indicates that, in terms of the synteny of immediate-neighborhood genes, zebrafish tbx24 might be considered occupying the same genomic position as human TBX6, suggesting that these two genes are orthologs.
Zebrafish tbx6 Gene Has a Structure Similar to Tetrapod Tbx16 Genes
Another conclusion of our phylogenetic analysis was that the tbx6 gene of zebrafish is likely to be more closely related to the Tbx16 rather than the Tbx6 genes of tetrapods (fig. 1). Although it is referred to as tbx6 (Hug et al. 1997), the exact identity of this gene has been an enigma for some time. This gene was originally named tbx6, based on the similarity of its sequence and expression patterns to those of mouse Tbx6 gene (Chapman et al. 1996; Hug et al. 1997). However, later researchers have pointed out that, considering this gene's uncertain phylogenetic relationships to other T-box genes, the tbx6 gene of zebrafish is not likely to be an ortholog of Tbx6 genes of tetrapods (Ruvinsky et al. 1998; Lardelli 2003).
To determine the identity of this gene, we again began our investigation with the examination of the exon–intron structure. The coding sequence of zebrafish tbx6 gene is made of 9 exons, out of which exons 2–6 contain portions of the T-box region (fig. 3A). This is identical to the exon–intron structure of the chicken Tbx6L gene (fig. 3A), which is the chicken ortholog of tetrapod Tbx16 genes (Ruvinsky et al. 1998). Moreover, in terms of the codon positions of the splice junctions between neighboring exons, tbx6 is also unique in that the junction between the second and third exons of its 5-exon T-box is positioned at the exact border between codons (supplementary fig. S4, Supplementary Material online). Among vertebrate T-box sequences, exonal arrangement of this type is known only in the orthologs of Tbx16 genes (supplementary fig. S4, Supplementary Material online), indicating that despite its name tbx6 gene of zebrafish is actually a Tbx16 rather than a Tbx6 gene.
Because zebrafish already has an ortholog of tetrapod Tbx16 genes called tbx16 (Ruvinsky et al. 1998), we then tested whether tbx6 might be a paralog of tbx16. These two genes are fairly similar in size and structure, each respectively coding for 473 (tbx6)- and 470 (tbx16)-amino acid proteins with the T-domains contained within the N-terminal halves of proteins (fig. 3A). On the other hand, on our phylogenetic tree, tbx6 was placed outside of the zebrafish tbx16-opossum Tbx16 cluster rather than being within the cluster grouped together with tbx16 (fig. 1), indicating that, although related, tbx6 may not be the paralog of tbx16.
To determine the precise evolutionary relationship between zebrafish tbx6 and tbx16 genes, we again examined the genomic neighborhood of these genes for the clues. According to the most recent version of the zebrafish genome assembly (Zv9), tbx6 and tbx16 are located on chromosomes 5 and 8, respectively (fig. 3B), each of which contains numerous genes that are related to the genes of chicken chromosome 15, which harbors the Tbx6L gene (fig. 3B). Consistent with the proposed orthology between zebrafish tbx16 and chicken Tbx6L genes (Ruvinsky et al. 1998; Lardelli 2003), we found that two of the Tbx6L’s neighbors on chicken chromosome 15, namely Cabin1 and Klhl22, have their zebrafish orthologs on zebrafish chromosome 8 as the immediate neighbors of tbx16 (fig. 3C, upper half).
However, inspection of the dot plot diagram also revealed that the paralogous counterpart of this tbx16-containing chromosome 8 region is most likely to be on zebrafish chromosome 21 (fig. 3B, boxed region), rather than on chromosome 5. This was further confirmed by a close inspection of the respective regions on a gene-by-gene basis (supplementary fig. S5B, Supplementary Material online), which indicated that, while the aforementioned zebrafish chromosome 21 region has a small cluster of genes that are orthologous to three other chicken genes in the genomic neighborhood of Tbx6L (fig. 3C, lower half), the zebrafish chromosome 5 region containing tbx6 gene has no such cluster of genes (fig. 3C). In fact, tbx6 is more or less completely isolated in this respect, having in its neighborhood none of the genes related to Tbx6L’s or tbx16’s genomic neighbors (fig. 3C and supplementary fig. S5B, Supplementary Material online). This suggests that, based on local, near-neighborhood syntenies, tbx6 gene does not seem to occupy the same relative genomic position as the Tbx6L or tbx16 genes, indicating that either the zebrafish tbx6 is not a paralog of zebrafish tbx16 gene or the genomic location of tbx6 had been altered secondarily by extensive chromosomal rearrangements.
Zebrafish tbx6 Gene Is Not an Ortholog of Teleost tbx16 Genes
Because the gene cluster on zebrafish chromosome 21 containing smpd4, med15, and crkl genes has no T-box gene associated with it (fig. 3C), even though at one time it must have been linked to a tbx16 gene (fig. 3D), we wondered whether tbx6 might actually be the “lost” copy of tbx16 gene that had been removed from this region. Consistent with this possibility, it has been reported that, during evolution, zebrafish had suffered many rearrangements in its genome, which involved extensive inter-chromosomal translocation events (Kasahara et al. 2007). Significantly, a large proportion of such interchromosomal exchanges seemed to have involved chromosomes 5, 8, 10, and 21. At the same time, however, other fishes such as medaka and Tetraodon had experienced much less shuffling of genes in their genomes during evolution (Kasahara et al. 2007), raising the possibility that these fishes might have retained the ancestral configuration of genes within their chromosomes, including those harboring the duplicated copies of tbx16 genes.
To determine whether there indeed had been such a translocation of a tbx16 gene from the chromosomal regions adjacent to the smpd4-med15-crkl gene cluster in zebrafish, we examined the genomes of four other fishes, namely, stickleback, medaka, Takifugu, and Tetraodon, for the presence of tbx6-like genes in the homologous regions. We found that other fishes have complements of T-box genes that are similar to zebrafish (table 2), but compared with zebrafish, they seem to universally lack the orthologs of tbx6 (and tbr1a) genes. However, during the investigation, we also came across what must be the second copies of tbx16 genes in stickleback and medaka (but not in Takifugu and Tetraodon) (fig. 4A and supplementary fig. S6A, Supplementary Material online), which had been discovered through BLAST searches of the PEP_ABINITIO data set of Ensembl database (see Materials and Methods). In terms of the amino acid sequences, these two genes—which we will call Olat-tbx16b (for the medaka gene) and Gacu-tbx16b (for the stickleback gene)—are similar to each other as well as to the known orthologs of Tbx16 genes (including the tbx16 gene of zebrafish) in the T-box regions but are quite different from the zebrafish tbx6 gene (fig. 4A and supplementary fig. S6A, Supplementary Material online). With respect to the exon–intron structures of the T-box regions, these two genes are also unmistakably Tbx16-like (supplementary fig. S6A, Supplementary Material online), indicating that these genes are the genuine copies of teleost tbx16 genes, which probably were produced by the teleost-specific whole genome duplication event.
Interestingly, within the respective genomes these genes seem to occupy the very positions expected for the duplicate copies of teleost tbx16 genes (fig. 4C and supplementary fig. S6B, Supplementary Material online). For example, tbx16b was found on chromosome 12 in medaka, which had been shown to be the duplicated counterpart of chromosome 9 (Kasahara et al. 2007; Nakatani et al. 2007) containing the medaka tbx16a gene (fig. 4B, boxed regions). Notably, tbx16b is directly linked to crkl in medaka (fig. 4C), which is precisely what is expected of the second copy of tbx16 gene in teleosts (fig. 3D and supplementary fig. S6C, Supplementary Material online). This indicates that, if zebrafish tbx6 gene is indeed the second copy of tbx16 gene that had been displaced from its initial location, then it ought to show at least some phylogenetic affinities to the tbx16b genes of stickleback and medaka. However, phylogenetic analysis of Tbx16 genes demonstrated that there is little affinity between zebrafish tbx6 gene and the tbx16b genes of stickleback/medaka (fig. 4D). In fact, in our phylogenetic tree, tbx6 gene was placed completely outside of a large group of genes encompassing the entire Tbx16 orthologs (fig. 4D), indicating that not only is zebrafish tbx6 gene unlikely to be the second copy of tbx16 but also it may not even be a Tbx16 gene. This suggests that tbx6 is most likely to be a truly novel gene, which is distantly related to the vertebrate Tbx16 genes, but this gene might be present only in the genomes of zebrafish and its close relatives.
Zebrafish tbx6 Gene Is a Product of Ancient Whole Genome Duplication Events That Created the Tbx6/16 Subfamily of Vertebrate T-Box Genes
New genes can arise in a genome by retro-transposition (Gogvadze and Buzdin 2009) or local duplication events such as tandem and segmental duplications (Bailey and Eichler 2006). It is known that Tbx6/16-like genes had undergone local duplications in at least three separate occasions during the evolution of nonvertebrate animals—twice in Drosophila melanogaster (Reim et al. 2003), twice in Ciona intestinalis (Takatori et al. 2004), and at least once in Branchiostoma floridae (fig. 1 and table 1). In addition, the T-box regions of vertebrate Mga genes, a member of Tbx6/16 subfamily (fig. 1; Lardelli 2003), clearly originated from a retro-transposition event, because they do not have any introns (supplementary fig. S4, Supplementary Material online; Hurlin et al. 1999). However, considering the high degree of sequence divergence between tbx6 and its closest relative tbx16 (fig. 4A), the placement of these two genes on two separate chromosomes (fig. 3C), and the clear presence of introns in tbx6 (fig. 3A), tbx6 does not appear to be a product of recent local duplication or a retro-transposition event within the zebrafish genome.
Another and perhaps more likely possibility for the origin of zebrafish tbx6 gene is that, like the majority of vertebrate genes (Dehal and Boore 2005), tbx6 had been produced by the whole genome duplication events that had taken place at the beginning of vertebrate evolution (Holland et al. 1994; Putnam et al. 2008). These ancient duplication events initially had created four copies of each gene that are paralogous to each other, many of which had since been lost (Blomme et al. 2006; Brunet et al. 2006). The loss of genes, however, had not been uniform across all vertebrate lineages (Canestro et al. 2007; Hoegg et al. 2007; Jovelin et al. 2010; Braasch and Postlethwait 2011), which resulted in the retention of different subset of duplicated genes in different vertebrate groups (Postlethwait 2007). The tbx6 gene of zebrafish might be one such differentially surviving member of anciently duplicated gene families, which may include the Tbx6/16 subfamily of vertebrate T-box genes.
To determine whether tbx6 indeed has its origin in the whole genome duplication events at the beginning of vertebrate evolution that had generated the Tbx6/16 subfamily genes, we examined the evolutionary relationships among the zebrafish chromosomal regions bearing the tbx6, tbx16, and tbx24 genes. Because the evolutionary relationships among regions of chromosomes are much better understood in tetrapods (Nakatani et al. 2007; Putnam et al. 2008), we concentrated our efforts on identifying the regions of tetrapod chromosomes that are orthologous to the regions of zebrafish chromosomes harboring tbx6, tbx16, and tbx24. As we have already noted (see above), the tetrapod orthologs of zebrafish tbx24 and its genomic neighbors reside on human chromosome 16 (fig. 2C), whereas the orthologs of zebrafish tbx16 and its neighbors are located on chicken chromosome 15 (fig. 3C). Therefore, we searched the tetrapod genomes mainly for the counterpart regions of the tbx6-containing region of zebrafish genome and then examined their evolutionary relationships to other regions of tetrapod genomes.
Because tetrapods apparently no longer have the orthologs of zebrafish tbx6 gene (fig. 1), we relied on tbx6 gene’s near-neighbors to deduce the former locations of its tetrapod orthologs. We found that three of the zebrafish genes neighboring tbx6 (c17orf63a, eral1, and flot2a) have their tetrapod orthologs located on chicken chromosome 19 (fig. 5A) and human chromosome 17 (supplementary fig. S7A, Supplementary Material online). Like in zebrafish, the tetrapod orthologs of the three zebrafish genes are arranged as each other’s close neighbors in both human and chicken genomes (fig. 5A and supplementary fig. S7A, Supplementary Material online), indicating that these genes might also have functioned as the genomic neighbors of the tetrapod orthologs of zebrafish tbx6 gene before they were lost during evolution.
Curiously, unlike the comparisons involving the chromosomal regions harboring zebrafish and tetrapod orthologs of Tbx6 and Tbx16 genes (figs. 2 and 3), comparison between the genomic regions harboring the zebrafish and tetrapod orthologs of C17orf63-Eral1-Flot2 gene cluster revealed very little preservation of synteny outside of the 3-gene cluster (fig. 5A and B, supplementary fig. S7A and Supplementary Data, Supplementary Material online). As can be seen in the local synteny trace diagram (fig. 5A), the zebrafish gene cluster orthologous to the chicken C17orf63-Eral1-Flot2 genes (zebrafish c17orf63a-eral1-flot2a genes: fig. 5A) is located on chromosome 5. However, in terms of the genome-level synteny, this small cluster is utterly isolated (fig. 5B, shaded region) from a large number of other zebrafish genes that are orthologous to the chicken genes in the genomic neighborhood of C17orf63-Eral1-Flot2 genes, which are mostly located on chromosomes 15 and 21 (fig. 5B, boxed regions). This indicates that, during evolution, the zebrafish tbx6 gene and its near-neighbors might have suffered a change in genomic location, possibly by zebrafish-specific episodes of interchromosomal translocation events (Kasahara et al. 2007).
Consistent with this, other fishes with more conservative genomes such as medaka and Tetraodon (Kasahara et al. 2007) show no such separation of eral1 and its neighbors from other genes over the region harboring the C17orf63-Eral1-Flot2 gene cluster in chickens in the dot plot diagram (fig. 5C and data not shown). This suggests that the apparently sudden change in synteny patterns between zebrafish and chicken chromosomes over the small area that might once have harbored the chicken ortholog of zebrafish tbx6 gene (fig. 5B) is likely to be an artifact caused by a relatively recent chromosomal rearrangement in zebrafish and the actual level of synteny between tetrapod and zebrafish genes on the chromosomes harboring tbx6 orthologs must have been higher and more extensive in the past.
We consider it most likely that, judging from the small break in synteny for the zebrafish chromosome 21 genes in the region that matches the location of C17orf63-Eral1-Flot2 gene cluster on the chromosome 19 of chickens (fig. 5B, gray arrow), tbx6 and its near-neighbors were originally on zebrafish chromosome 21. In support of this, c17orf63b and flot2b, paralogs of tbx6 gene’s near-neighbors c17orf63a and flot2a, are located on zebrafish chromosome 15 (fig. 5A). With respect to the region of chicken chromosome 19 containing the C17orf63-Eral1-Flot2 genes, zebrafish chromosome 15 constitutes the duplicated counterpart of zebrafish chromosome 21 (compare the two boxed regions in fig. 5B; also see supplementary fig. S5C, Supplementary Material online). Therefore, at the time of duplication, the duplicated copies of chromosome 15 genes, including the copies of c17orf63b and flot2b genes, must have been on chromosome 21.
Incidentally, this also demonstrates that the zebrafish chromosome 21 had lost not one but two T-box genes during its evolutionary history. As we have already noted (fig. 3D), chromosome 21 had at one time also harbored the second copy of tbx16 gene in a region orthologous to the Tbx6L-containing region of chicken chromosome 15 (fig. 3B). This region is different from the region tbx6 and its immediate neighbors were once located before the translocation event (fig. 5D), which indicates that the zebrafish chromosome 21 is actually a composite chromosome formed by the fusion of two separate chromosomes after the teleost-specific whole genome duplication event (fig. 5E; also see Kasahara et al. 2007).
To summarize, consideration of the synteny strongly suggests that the missing tetrapod orthologs of zebrafish tbx6 gene must have been located on chicken chromosome 19 and human chromosome 17 (fig. 5A and supplementary fig. S7A, Supplementary Material online). By similar reasoning, it can also be inferred that the missing human ortholog of zebrafish tbx16 gene (fig. 1) must have been on human chromosome 22 (supplementary fig. S8A, Supplementary Material online), whereas the elusive chicken ortholog of zebrafish tbx24 gene (in other words, the chicken ortholog of tetrapod Tbx6 gene, which may or may not be present in the chicken genome [supplementary fig. S8B, Supplementary Material online]), must be on chicken chromosome 14, probably hiding in one of the unsequenced chromosomal regions (supplementary fig. S8B, Supplementary Material online).
Remarkably, mapping of the tetrapod genes orthologous to zebrafish tbx6, tbx16, and tbx24 genes and their genomic neighbors revealed that these genes are located in the chromosomal regions that are each other’s paralogous counterparts (fig. 6; Nakatani et al. 2007). Specifically, each of the chromosomal regions harboring (or had harbored at one time), the tetrapod orthologs of zebrafish tbx6, tbx16, and tbx24 genes derives from one of the 3 sister chromosomes present in primitive vertebrates (H0, H1, and H2, each bearing the orthologs of tbx16, tbx6, and tbx24 genes, respectively: fig. 6), which in turn had been produced by the multiplication of a single chromosome (chromosome H of Nakatani et al. 2007) in an ancestral vertebrate as a part of the whole genome duplication process (fig. 6). This demonstrates that the tbx6, tbx16, and tbx24 genes of zebrafish and their tetrapod orthologs are the descendants of a single ancestral gene that was present in an ancestral vertebrate and had been duplicated during the early stages of vertebrate evolution.
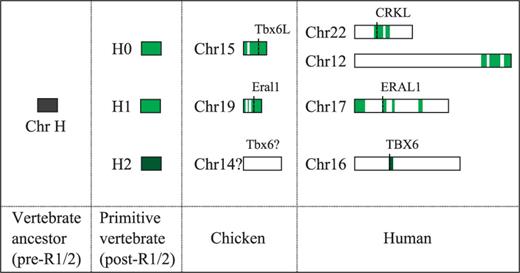
Evolutionary origin of the zebrafish tbx6 gene. Chromosomes of modern-day vertebrates contain paralogous regions, which had been produced by the multiplication of a single chromosomal region in an ancestral vertebrate (Dehal and Boore 2005). According to a recent model, parts of the human chromosomes 22/12, 17, and 16 containing the CRKL, ERAL1, and TBX6 genes and their genomic neighbors derive from three of the chromosomes of a primitive vertebrate (chromosomes H0, H1, and H2, respectively), which in turn had been produced by the multiplication of an ancestral chromosome (chromosome H; Nakatani et al. 2007) as part of the whole genome duplication process (R1/2). Because the human chromosome regions harboring CRKL, ERAL1, and TBX6 genes are orthologous to the zebrafish chromosome regions containing tbx16, tbx6, and tbx24 genes (fig. 2C and supplementary figs. S7A and Supplementary Data, Supplementary Material online), this suggests that the three zebrafish genes are also likely to be the products of the whole genome duplication process. Similar conclusions can also be drawn from the comparison between corresponding regions of chicken chromosomes, although in this case our inability to locate in the chicken genome the chromosomal region(s) derived from chromosome H2 (containing chicken Tbx6 gene; supplementary fig. S8B, Supplementary Material online) makes the inference somewhat weaker. Genomic locations of Tbx6L, Eral1, CRKL, ERAL1, and TBX6 genes are marked by vertical hatched lines. Chicken and human chromosomes are re-drawn from figure 4 of Nakatani et al (2007) in the correct scales. Chromosomes H, H0, H1, and H2 are drawn in an arbitrary scale.
Discussion
In this article, we have shown that, contrary to the conclusions of previous studies (e.g., Ruvinsky et al. 1998; Mitani et al. 1999; Lardelli 2003), the vertebrate T-box genes of Tbx6/16 subfamily do form a monophyletic assemblage. According to our phylogeny, the tetrapod T-box genes TBX6 (human) and Tbx16 (opossum) as well as related zebrafish genes tbx6, tbx16, and tbx24 together form a well-supported cluster on a gene tree that is most closely related to the two Tbx6-like genes of amphioxus, Amphi-Tbx6d1 and Amphi-Tbx6d2 (fig. 1). This result, which is independent of the choice of vertebrate species included in the phylogenetic analysis (the same result was obtained when human genes were replaced with mouse genes or when zebrafish genes were replaced with Takifugu genes: data not shown), is consistent with the notion that each subfamily of vertebrate T-box genes constitutes the descendants of one or more T-box genes present in the genome of vertebrate’s chordate ancestor (Ruvinsky, Silver, et al. 2000; Putnam et al. 2008). In addition, the presence of three Tbx6/16-like genes in the amphioxus genome (table 1) suggests that, like Drosophila (Reim et al. 2003) and Ciona (Takatori et al. 2004), amphioxus had undergone its own episodes of multiplication of the Tbx6-related genes.
The results of our phylogenetic analysis also confirmed (Lardelli 2003) that the Tbx6/16 subfamily also includes the orthologs of Mga genes (human MGA and zebrafish mga-a and mga-b) (fig. 1), even though these genes possess a distinct evolutionary history that is not shared with the rest of Tbx6/16 subfamily genes. Unlike those of other T-box genes, the T-box regions of Mga genes lack introns (supplementary fig. S4, Supplementary Material online), which suggests that they are the products of an ancient retro-transposition event (Hurlin et al. 1999). At present, it is not known exactly when and under what circumstances this retro-transposition event had occurred, but considering the phylogenetic affinity of Mga genes to the orthologs of Tbx6 genes (TBX6 and tbx24) (fig. 1), it is likely that the Mga genes evolved only after the divergence of Tbx6 and Tbx16 genes, using the mRNA of a Tbx6-like gene as a template for the reverse transcription.
In addition to the supports from our new phylogenetic analysis based on a more complete set of T-box genes, the monophyly of Tbx6/16-like genes is also independently corroborated by the genomic data, which indicated that these genes are located within the paralogous chromosomal regions produced by the process of whole genome duplication events (fig. 6). It is now generally acknowledged that the basic structure of vertebrate genomes stems from the two rounds of ancient whole genome duplication events (Dehal and Boore 2005), which had taken place at the beginning of vertebrate evolution (Putnam et al. 2008). After the duplication, initial increase in gene numbers had been followed by a massive loss of genes, such that in the genomes of modern-day tetrapods only ∼20 to 30% of the genes still preserve the expected 4-fold redundancies (Dehal and Boore 2005; Makino and McLysaght 2010).
Such a loss of paralogs can also be seen in the T-box genes, for which no single subfamily of vertebrate genes currently shows the expected full membership of four (table 1). In the case of Tbx6/16 subfamily, the situation seems to be even more complicated, because, unlike other subfamilies, the loss of genes might have been lineage-specific in this subfamily. For example, it is well-known that human and mouse do not seem to have the orthologs of Tbx16 gene (Ruvinsky, Silver, et al. 2000; Lardelli 2003) whereas the chickens may not have the Tbx6 orthologs (supplementary fig. S8B, Supplementary Material online; Knezevic et al. 1997; International Chicken Genome Sequencing Consortium 2004).
To determine whether these conditions are representative of tetrapods in general, we undertook a general survey of T-box gene contents in the genomes of several species of tetrapods, which belonged to a wide range of taxonomic groups (table 3). We found that, like human and mouse, placental mammals (chimpanzee, rabbit, dog, and elephant) do not seem to possess the orthologs of Tbx16 genes, although they do have the orthologs of Tbx6 and Mga genes (table 3). In contrast, in the genomes of birds (zebra finch, duck, chicken, and turkey), orthologs of Tbx16 and Mga genes could readily be identified, but the presence or absence of the orthologs of Tbx6 genes could not be determined (table 3; also see supplementary fig. S8B, Supplementary Material online). However, it was also obvious that these conditions are not representative of tetrapods in general, because, in addition to the orthologs of Mga genes, we were able to confirm the presence of both Tbx6 and Tbx16 orthologs in the genomes of nonplacental mammals (platypus, opossum, and wallaby) as well as a lizard (green anole) and a frog (Xenopus tropicalis) (table 3). Moreover, frogs may even have an additional, novel member of Tbx6/16 subfamily (Yabe et al. 2006; Callery et al. 2010), which is related to the Tbx6 genes of tetrapods but does not seem to be a recent duplicate of a frog Tbx6 gene (fig. 7).
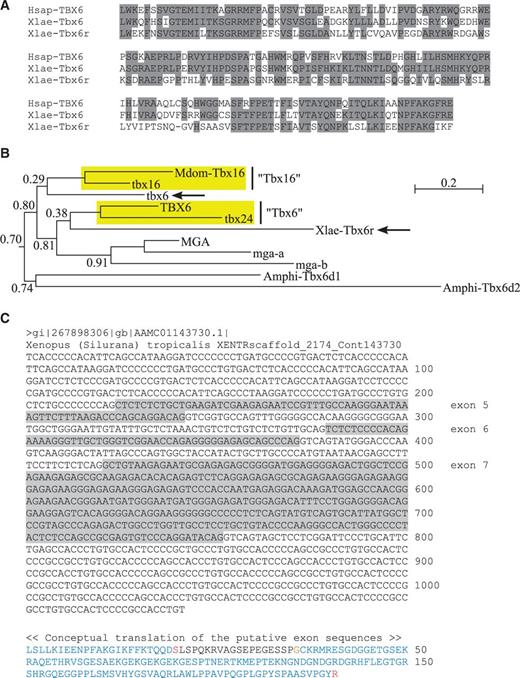
Xenopus Tbx6r as the likely fourth descendant of the common ancestral gene of the Tbx6/16 subfamily. (A) Comparison of the amino acid sequences of the T-domains between human (Hsap) TBX6 (NM_004608), Xenopus laevis (Xlae) Tbx6 (NM_001087696), and Xenopus laevis (Xlae) Tbx6r (EU926666) genes. Amino acid residues shared between any two genes are shaded in dark gray. Note that, in the T-domain, Xenopus Tbx6 is much more similar to human TBX6 than to Xenopus Tbx6r (amino acid identities of 69.5% and 51.1%, respectively), indicating that Tbx6r is unlikely to be a recent duplicate of Tbx6 in the Xenopus lineage. (B) Portion of the phylogenetic tree of vertebrate T-box genes showing the evolutionary relationship between Xenopus Tbx6r and other Tbx6/16 subfamily genes. The tree was built by maximum likelihood algorithm using the same sequence alignment and model of protein evolution as the tree in figure 1, except for the addition of the T-domain of Tbx6r gene to the alignment file. The rest of the tree has the identical topology as the tree in figure 1. Approximate likelihood-ratio test values are given to each node. Scale bar represents 0.2 amino acid substitutions per site. Note that, in this tree, Xenopus Tbx6r is related to the Tbx6 orthologs (human TBX6 and zebrafish tbx24) in the same way as zebrafish tbx6 is related to the Tbx16 orthologs, suggesting that Tbx6r is likely to be a novel member of Tbx6/16 subfamily, possibly constituting the “missing” fourth descendant of the ancestral Tbx6/16 gene. (C) Whole-genome shotgun sequence (AAMC01143730) demonstrating the presence of a Tbx6r ortholog in Xenopus tropicalis. In this portion of the genomic DNA, only the coding sequences (shaded in light gray) of putative exons 5–7 (out of the 8 exons expected from the comparison with Tbx6r of Xenopus laevis) of the Tbx6r gene could be discerned. Conceptual translation of the exonal regions is coded in the same way as in Ensembl database. Note that this is an “orphan” sequence that is yet to be integrated into a larger contig. Therefore, the genomic location of Tbx6r is currently unknown for both Xenopus tropicalis and Xenopus laevis.
Interestingly, this new frog gene, which is now known as Tbx6r (Yabe et al. 2006), seems to possess features that are highly suggestive of its being the fourth descendant (the other three being the respective orthologs of human TBX6, chicken Tbx6L, and zebrafish tbx6 genes) of the common ancestral gene, which had produced the Tbx6/16 subfamily of vertebrate T-box genes through the process of whole genome duplication. This gene, which was originally isolated from Xenopus laevis (Yabe et al. 2006) but has since been found in Xenopus tropicalis as well (Callery et al. 2010), has an exon–intron structure identical to the orthologs of Tbx6 genes (Callery et al. 2010). However, this gene has a T-domain sequence highly divergent from those of the Tbx6 genes (fig. 7A), and this gene also occupies a position just outside of the cluster of Tbx6 orthologs on a phylogenetic tree (fig. 7B), indicating that this gene is related to the Tbx6 genes but is not an ortholog.
Unfortunately, however, we do not know exactly where this gene is located on the frog genome (fig. 7C), and therefore, at present, it is not possible to deduce its evolutionary origin through the analysis of its genomic neighbors as we did with the zebrafish tbx6 gene (fig. 6). Nevertheless, such a potential discovery of the missing fourth descendant suggests that the Tbx6/16 subfamily might be one of the few subfamilies of vertebrate T-box genes for which all four products of the ancient duplication events have survived to this date.
We have also shown that, by using data from outside the realm of nucleotide and amino acid sequences such as exon–intron structure (figs. 2A and 3A) and local synteny (figs. 2C, 3C, and 5A), it is possible to resolve ambiguities in the assignment of orthologies. In eukaryotic genes, the position of introns has been shown to vary roughly in proportion to the evolutionary distances between genes such that more distantly related genes tend to show less similarity in their exon–intron structures (Henricson et al. 2010). In the case of T-box genes, the exon–intron structure of the T-box is known to vary between most of the subfamilies (and, in some cases, even between member genes within a subfamily) (supplementary fig. S4, Supplementary Material online), such that it is often possible to substantially narrow down the identity of a gene by just looking at the number and position of introns within the T-box (Wattler et al. 1998). In vertebrates, such a diagnostic value of exon–intron structures in the assignment of subfamily memberships has also been demonstrated for the genes from several other gene families, such as the small heat shock proteins (Franck et al. 2004), tyrosine kinases (D'Aniello et al. 2008), and GATA transcription factors (Gillis et al. 2009), indicating that, for vertebrate genes, the number and location of introns may have broader utilities in the determination of orthologies.
In vertebrate genomes, orthologous genes also tend to have similar sets of genes in their genomic neighborhoods (Mouse Genome Sequencing Consortium 2002; International Chicken Genome Sequencing Consortium 2004; Jaillon et al. 2004; Hellsten et al. 2010; Alföldi et al. 2011), such that, between closely related species, it is even possible to determine the orthology of genes by examining the identity of their genomic neighbors (e.g., Zheng et al. 2005; Jun et al. 2009). Although the potential utility of conserved syntenies in the determination of the orthology of vertebrate genes has been known for some time (e.g., Barbazuk et al. 2000), it is only recently with the ready availability of the whole genome sequences from a wide variety of vertebrate species that the synteny information begins to see a regular use (in conjunction with the amino acid sequences) in the determination of the orthology of genes (e.g., Eckhart et al. 2008; Braasch et al. 2009; Sreedharan et al. 2011; Zakon et al. 2011). Although most of the past investigations had used the synteny information to confirm the orthology relations already determined by the phylogenetic analysis, they also revealed that the local syntenies involving immediate-neighborhood genes are often preserved at sufficiently high levels that it is often possible to predict the genomic locations of a gene’s orthologs in other animals by using the linkage information alone, even in cases involving distantly related species.
In teleost fishes, formulating syntenies for the purpose of discerning the orthology of genes is more complicated, because, unlike tetrapods, teleosts had undergone another round of whole genome duplication at the beginning of their evolutionary history (Taylor et al. 2003; Meyer and Van de Peer 2005). As a consequence, teleost fishes have two regions in their genomes that are similar in gene content to a single region of a tetrapod genome (Postlethwait et al. 2000; Christoffels et al. 2004; Jaillon et al. 2004; Kasahara et al. 2007; Nakatani et al. 2007). In teleost fishes, such pairs of regions also rarely contain the same set of genes due to the complementary loss of paralogs that is common in duplicated genomes (e.g., Jaillon et al. 2004; Kellis et al. 2004). Unfortunately, this could make it more difficult to determine the orthology between tetrapod and fish genes using the synteny criteria, because the genes that are immediate neighbors in a tetrapod genome may appear separated on two different chromosomes in a fish genome (supplementary fig. S9A, Supplementary Material online).
In addition to the loss of genes, synteny in teleost fishes could also be disrupted by interchromosomal translocation events. It has been postulated that, during evolution, teleost fishes had experienced several episodes of chromosomal rearrangements, which involved both fusion of whole chromosomes and translocation of chromosomal segments (Kasahara et al. 2007). Such rearrangement of chromosomes can potentially place the genes in a different genomic context, thus making them appear nonorthologous to their homologs in other, more conservative genomes (supplementary fig. S9B, Supplementary Material online). This problem seems to be particularly acute in zebrafish, because, compared with other fishes, zebrafish seems to have experienced a much larger number of interchromosomal exchange of genes during evolution (Kasahara et al. 2007).
To avoid such possible under-estimation of the local synteny in a fish genome, which may lead to erroneous conclusions regarding the orthology of genes (supplementary fig. S9, Supplementary Material online), we suggest that, whenever practical, synteny information from all relevant regions should be combined and the “ancestral” status of corresponding genomic regions be reconstructed during the comparison (e.g., figs. 2D and 3D). We would like to point out that, if the comparison involves only the evolutionarily derived regions of teleost genomes, some fish genes may appear novel if they happen to have no common neighborhood genes with their tetrapod counterparts (supplementary fig. S9, Supplementary Material online). By taking into consideration the evolutionary history of teleost genomes, one may avoid such pitfalls and increase the confidence in the assignment of orthology between teleost and tetrapod genes based on local synteny criteria.
Finally, we have shown that tbx24, rather than tbx6, is the actual zebrafish ortholog of tetrapod Tbx6 genes (fig. 2). Consistent with this, both tbx24 in zebrafish and Tbx6 in mouse have been known to play critical roles in the formation of somite borders (Nikaido et al. 2002; Watabe-Rudolph et al. 2002; White et al. 2003; Oates et al. 2005), in which they seem to control the expression of genes that are necessary for the segmentation of the paraxial mesoderm (Hitachi et al. 2008; Yasuhiko et al. 2008; Brend and Holley 2009). However, compared with tbx24 in zebrafish, Tbx6 in mouse seems to have additional roles in development (Chapman and Papaioannou 1998; Lou et al. 2006; Hadjantonakis et al. 2008). For example, in mouse, complete Tbx6 loss-of-function causes defects in the formation of paraxial mesoderm itself, such that, in the trunk, prospective paraxial mesoderm cells develop instead into neural cells, whereas in the tail, mesoderm cells accumulate to form a mass of undifferentiated mesenchyme cells in the tailbud (Chapman et al. 2003). These phenotypes are not seen in zebrafish tbx24 loss-of-function mutants, which show normal development of paraxial mesoderm (Nikaido et al. 2002).
Interestingly, the enlargement of tailbud by the accumulation of undifferentiated mesenchyme cells seen in Tbx6-knockout mouse (Chapman et al. 2003) closely resembles the known phenotype of zebrafish tbx16 mutant spadetail (Griffin et al. 1998), which also shows the accumulation of mesoderm cells in the tailbud (Kimmel et al. 1989). Remarkably, in both Tbx6-knockout mouse and zebrafish tbx16 mutant, the underlying defect seems to be the failure of mesoderm precursor cells to undergo normal gastrulation movement (Ho and Kane 1990; Chapman et al. 2003). This indicates that these two genes may even function in the same molecular pathway. Therefore, in mouse, Tbx6 gene may be playing the roles of both tbx24 (with respect to the specification of somite boundary: White et al. 2003; Oates et al. 2005) and tbx16 (with respect to the cell movement during gastrulation: Ho and Kane 1990; Chapman et al. 2003) genes of zebrafish (Wardle and Papaioannou 2008).
Considering the fact that the placental mammals do not seem to have the orthologs of Tbx16 gene (table 3), this suggests that, at some point during the evolution of mammals, Tbx6 might have taken over the function of its relative, Tbx16, such that, in the placental mammals, Tbx16 gene became redundant in function with Tbx6 and thus in the end was eliminated from the genome (fig. 8A). At present, it is not known why placental mammals had undergone such an evolutionary simplification of gene contents for the Tbx6/16 subfamily. Because Tbx16 is still present in monotremes and marsupials (table 3), it is tempting to speculate over the perceived correlation between the loss of Tbx16 orthologs and the evolution of true placentas in placental mammals. However, in our opinion, any kind of direct causation between these two events seems unlikely, because, at least in the chicken and mouse of today, neither Tbx16 (chicken: Knezevic et al. 1997) nor Tbx6 (mouse: Chapman et al. 1996) is expressed in the extraembryonic tissues during development. Perhaps the resolution of this problem may require an actual investigation of the expression and function of Tbx6 and Tbx16 genes in the monotremes and marsupials, which may also help us to determine whether Tbx6 genes in these animals are indeed becoming more functionally redundant with Tbx16 genes as they move closer in evolution toward the placental mammals.
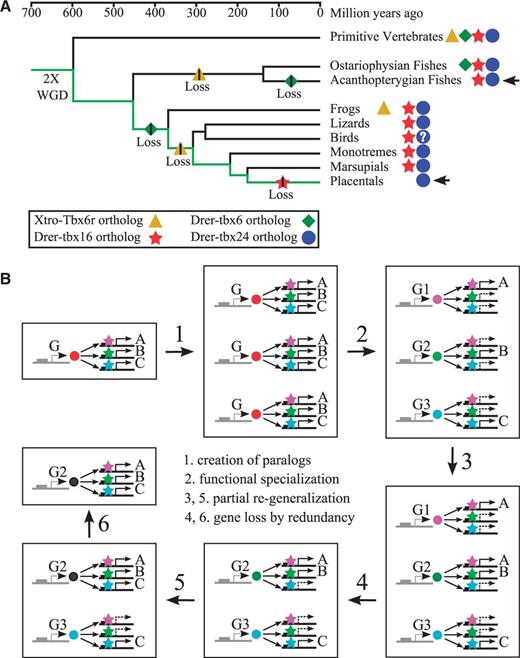
Evolution of the Tbx6/16 subfamily genes through sym-functionalization. (A) Evolutionary simplification of the Tbx6/16 subfamily gene content in placental mammals. After the two rounds of whole genome duplication (2X WGD), primitive vertebrates likely had four Tbx6/16 genes. During subsequent evolutionary radiation of vertebrates, different vertebrate groups had lost different subsets of Tbx6/16 genes, which resulted in two major instances of substantial simplification of gene contents for the Tbx6/16 subfamily: in acanthopterygian fishes (a large group of teleost fishes including stickleback, medaka, and puffer fishes) and in placental mammals (arrows). In placental mammals, one of the most comprehensive instances of evolutionary simplification of paralogs had occurred in the Tbx6/16 subfamily, which had lost three paralogs (out of four) during the course of evolution. As a consequence, placental mammals of today have only one Tbx6/16 gene—the Tbx6 gene—to perform possibly the functions of all four Tbx6/16 paralogs. Data for the phylogeny and divergence times of major vertebrate groups were taken from Genome 10 K Community of Scientists (2009). Phylogenetic tree is drawn with the branch lengths proportional to the time of divergence. Instances of gene loss are marked by short vertical lines superimposed on the symbols of lost genes on corresponding branches. The position of each symbol on a branch is arbitrary and does not mean to reflect the actual time of loss. Presence or absence of the Tbx6/16 orthologs in major vertebrate groups is as given in tables 1–3. For simplicity, the effect of teleost-specific whole genome duplication event on fish gene numbers was ignored. At present, it is not clear whether the Drer-tbx24 ortholog (Tbx6 gene) is actually missing in birds (supplementary fig. S8B, Supplementary Material online). Primitive vertebrates refer to the hypothetical early vertebrates that had emerged shortly after the two rounds of whole genome duplication in the common ancestor of vertebrates. Data for the ostariophysian fishes, frogs, lizards, and monotremes are based on single species (zebrafish, western clawed frog, green anole, and platypus, respectively) and therefore it is possible that some of these may not represent the actual within-group conditions. Xtro, Xenopus tropicalis (western clawed frog). Drer, Danio rerio (zebrafish). (B) Mechanism of sym-functionalization. Sym-functionalization is a process by which separate functions of paralogs are pooled together in one gene during evolution. In effect, this reverses the functional specialization of the paralogs experienced during earlier stages of evolution. Sym-functionalization may actually be possible if the functional subdivisions (step 2) following the duplication of a gene (step 1) were not total. In the example illustrated here, the three paralogs G1, G2, and G3, each encoding a transcription factor (circle), maintain background-level redundancies to each other’s functions by retaining the ability to regulate those downstream targets (A, B, or C) they no longer actively control (denoted by arrows with hatching). In case of transcription factors, this might occur if the functional specialization had been mediated by the changes in the activity of N- or C-terminal effector domains interacting with the cofactors (stars) rather than by the changes in the target specificity of DNA-binding domains, such that all paralogs retain the abilities to bind the enhancer regions of any of their original downstream targets. Later during evolution, one or more of the paralogs could be made fully active again in their minor functions by regaining the ability to interact with multiple cofactors (step 3), and thus become fully redundant with its paralogs (in the example, G2 is now fully active in the transcription of both A and B, and thus is redundant with G1). This may lead to the elimination of the redundant paralog that is still specialized in its function (step 4), thereby simplifying the gene content of the organism. The same process could be repeated (step 5) until only one multi-functional gene remains (step 6).
Because placental mammals also lack the orthologs of zebrafish tbx6 (table 1) and frog Tbx6r genes (table 3), if we assume that the frog Tbx6r gene is the actual fourth descendant of the ancestral Tbx6/16 gene (fig. 7) and therefore was present in the genomes of primitive vertebrates, Tbx6 might have acquired the functions of these genes as well, in which case, evolution of the Tbx6 genes in placental mammals may represent the first example of what might be called the “sym-functionalization” of paralogs, in which the functions of several related genes are gradually pooled together in a single gene during evolution (fig. 8A). This phenomenon, which may represent the evolutionary reversal of the better-known “subfunctionalization” process (Force et al. 1999; Stoltzfus 1999), might have been feasible in situations in which the initial subdivision of ancestral gene’s functions among its descendants (such as the one following the whole genome duplication event) had not been total, such that each descendant gene had retained at least weak functionalities in all of the activities of the ancestral gene even after it had become specialized for a particular function (fig. 8B).
Such situations may most likely result if the subfunctionalization had been quantitative rather than qualitative (i.e., either the paralogs have suboptimal activities or the paralogs are produced in suboptimal quantities such that the complete range of ancestral functions can be restored only by a quantitative pooling of paralog’s activities: see Force et al. [1999] and Stoltzfus [1999] for an in-depth discussion of this mechanism), or, in case of transcription factors, if the subfunctionalization had involved mainly the alteration of the activities of effector domains regulating the interactions with co-factor molecules rather than a change in target specificity of DNA-binding domains (fig. 8B). In these situations, as long as the paralogs maintain similar expression domains, such residual redundancy in gene functions would allow specializations to be reversed and paralogs to be lost when they become functionally redundant again with their relatives (fig. 8B).
Nevertheless, at present, it is not known how much functional redundancies are actually present among Tbx6/16 subfamily genes. At least in Xenopus, functional differences between Tbx6 and Tbx6r genes have been shown to mainly originate from the differences in the activity of their C-terminal effector domains rather than the differences in target specificities of their T-domains (Callery et al. 2010). Given the similarity of binding capabilities of the T-domains from related T-box genes to the T-domain target sites (e.g., Lingbeek et al. 2002), such a finding suggests that these genes as well as the related Tbx16-like genes (such as chicken Tbx6L and zebrafish tbx6) may still share a substantial number of common downstream targets. In zebrafish, which, amongst major model organisms, currently has the largest number of Tbx6/16 subfamily genes (tables 1–3), there was a suggestion of possible functional overlap between tbx6 and tbx16 genes during mesoderm formation (Griffin et al. 1998). However, so far, this suggestion has not been experimentally tested. Given the possible functional redundancies among Tbx6/16 genes, we suggest that any future research involving tbx6 or tbx16 genes in zebrafish should also consider the possibility that tbx24 gene might also be involved and masking some of the loss-of-function phenotypes of these genes.
Our model of the evolution through sym-functionalization of paralogs also suggests that, depending on which gene has become multi-functional during the process (fig. 8B), it might be Tbx16, rather than Tbx6 that would eventually emerge as the final end product of the sym-functionalization in the acanthopterygian fishes (fig. 8A). In fact, because sym-functionalization can happen to any of the Tbx6/16 genes, it can be imagined that in other major vertebrate lineages, some other Tbx6/16 subfamily members might have been chosen for eventual fixation. Perhaps, the notoriously ambiguous phylogenetic relationships among Tbx6/16 subfamily genes (Ruvinsky et al. 1998; Ruvinsky, Silver, et al. 2000; Lardelli 2003) might have been a reflection of such repeated “duplication-specialization-generalization-loss” cycles (fig. 8B) that had led to the stochastic retention of different paralogs in different vertebrate groups.
Conclusion
Assuming that the successive expansion of Tbx6/16 subfamily memberships on the phylogenetic tree (fig. 1) is due to each round of whole genome duplication event in an ancestral vertebrate, we may re-construct the evolutionary history of vertebrate Tbx6/16 subfamily genes in the following way (fig. 9). In the first round (R1), a single T-box gene related to the Tbx6-like genes of modern-day amphioxus (fig. 1) was duplicated into two, which subsequently had undergone a divergence in their exon–intron structures to become the two ancestral genes for the Tbx6- and Tbx16-like genes of modern-day vertebrates (we will call these hypothetical ancestral genes proto-Tbx6 and proto-Tbx16, respectively). In the second round (R2), proto-Tbx6 gene gave rise to two descendants, one becoming the modern-day Tbx6 gene and the other (which we will call Tbx25) becoming a fugitive gene which is yet to be found in the genomes of tetrapods (but see fig. 7) and probably had been lost in the lineage leading to the teleost fishes. At the same time, duplication of the proto-Tbx16 gene had generated the ortholog of modern-day Tbx16 genes and the tetrapod ortholog of zebrafish tbx6 gene (which we will call Tbx26). Finally, in teleost fishes, the third round (R3) of whole genome duplication had generated duplicates of Tbx6, Tbx16, and Tbx26 genes, out of which only one gene from each pair survives in zebrafish as the modern-day tbx24, tbx16, and tbx6 genes, respectively (fig. 9).
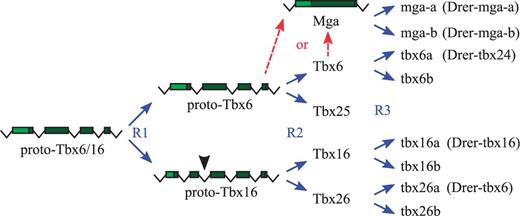
Scenario for the evolution of Tbx6/16 subfamily genes in vertebrates. Like in other gene families of vertebrates, evolution of the Tbx6/16 subfamily of vertebrate T-box genes had been driven by the three rounds of whole genome duplication events accompanying the evolution of vertebrates. In the first round (R1), a single T-box gene (proto-Tbx6/16) related to the Tbx6-like genes of amphioxus was duplicated into two, thereby generating the progenitor genes for the eventual Tbx6- and Tbx16-like genes (proto-Tbx6 and proto-Tbx16 genes, respectively) of vertebrates. Initially, both of these genes had the same four-exon T-boxes typical of the T-box genes of amphioxus, including the Amphi-Tbx6d2 gene (data not shown), which has been retained in all of the Tbx6-like genes of vertebrates (supplementary fig. S4, Supplementary Material online). Between the first (R1) and second (R2) rounds, however, the proto-Tbx16 gene had acquired an extra intron in the T-box region (arrowhead), thereby establishing the five-exon T-box characteristic of the Tbx16 genes (supplementary fig. S4, Supplementary Material online). With the second round of whole genome duplication (R2), proto-Tbx6 and proto-Tbx16 genes, respectively, gave rise to the Tbx6/Tbx25 and Tbx16/Tbx26 gene pairs, out of which only the Tbx6 and Tbx16 genes are now routinely seen in the genomes of the majority of modern-day vertebrates (tables 1–3 and fig. 8A). Meanwhile, some time before or after the second round (depending on whether Xenopus Tbx6r is an actual ortholog of Tbx25; fig. 7), a retro-transposition event (hatched arrows) had created the intronless T-box of Mga gene out of the mRNA of a Tbx6 gene (either proto-Tbx6 or Tbx6 genes) through a reverse transcription. In teleost fishes, another round of whole genome duplication (R3) had generated additional copies of Mga, Tbx6, Tbx16, and Tbx26 genes, out of which only the mga-a, mga-b, tbx6a, tbx16a, tbx16b, and tbx26a genes seem to have survived to this day (table 2). In the diagram, exon–intron structure is shown only for the T-box-containing region of each gene, with the darker shade designating the coding sequence of the T-box region. Names written in parentheses next to teleost genes are the names currently given to zebrafish (Drer) orthologs of these genes.
Based on this scenario, we would like to propose the following nomenclatural changes for zebrafish genes. First, we suggest that the present tbx24 gene should be re-named as tbx6, because it is no longer logical to consider it a novel gene when both the exon–intron structure and the synteny data clearly indicate that it is an ortholog of tetrapod Tbx6 gene (fig. 2). However, because the name tbx6 has been in use to denote another zebrafish gene for almost 15 years and is still being used in the literature (e.g., Hug et al. 1997; Griffin et al. 1998; Goering et al. 2003; Garnett et al. 2009), we suggest that the name tbx6fss (fss stands for “fused somites,” the genetic name given to zebrafish tbx24 gene: van Eeden et al. 1996) shall instead be used for some time until tbx6 becomes firmly established as the correct name for the present tbx24 gene. Second, we propose that the present zebrafish tbx6 gene should be re-named because the name tbx6 must now be surrendered to the tbx24 gene and this gene is clearly a novel gene requiring a new name (fig. 4). We suggest tbx26, which we think would be ideal for maintaining the continuity in nomenclature while at the same time demonstrating its kinship to the orthologs of Tbx6 and Tbx16 genes.
Incidentally, we have found that, in Ensembl database, tbx24 orthologs of three other fishes (medaka, Takifugu, and Tetraodon) are already identified as tbx6, which clearly indicates that, during the annotation process in Ensembl database (Curwen et al. 2004), tbx24 orthologs in fishes invariably came out as the orthologs of human TBX6 gene. However, Ensembl database also has clear cases of mis-identification of Tbx6/16 subfamily genes, because we have discovered that, in the current database, the Tbx16 orthologs are mis-labeled as Tbx6 in three species of birds (chicken, turkey, and zebra finch) and in the stickleback fish. Moreover, in Ensembl database, orthologs of Tbx16 genes are annotated only as “novel” genes in all vertebrate species except for zebrafish (labeled as tbx16) and Xenopus tropicalis (labeled as vegt), indicating that, in Ensembl database, Tbx16 is not even recognized as a possible gene name.
We believe that this is most likely due to the current practice of using the human genome as the gold standard of comparison for new or low-coverage genomes in Ensembl database (Curwen et al. 2004). This will invariably lead to mis-identification or mis-annotation of the genes whose orthologs are missing from the human genome, in which case the genes would be recognized as the orthologs of their next closest relatives in the human genome (Postlethwait 2007; Catchen et al. 2009; Braasch and Postlethwait 2011). Such problems can be overcome only by including genomes from more diverse vertebrate species such as chicken and zebrafish in the comparison, although it must be acknowledged that it will be some time until other genomes (including those of chicken and zebrafish) get assembled and annotated to the same level of accuracy and quality as the human genome.
To summarize, using a combination of the sequence-based phylogeny and separate nonsequence information such as the exon–intron structure and synteny, we have shown that the tbx24 and tbx6 genes of zebrafish should be recognized as the orthologs of tetrapod Tbx6 gene and a novel gene Tbx26, both of which have a complex evolutionary history. We hope that the present clarification of the identity of these genes will help to place what is currently known about these genes in a proper evolutionary context and will also prompt further research on the origin and diversification of vertebrate T-box genes.
Acknowledgments
The authors thank the administrators of the Genomicus Browser and Synteny Database, which have been invaluable for our investigation. This work was supported by Basic Science Research Program through the National Research Foundation of Korea (NRF), which was funded by the Ministry of Education, Science and Technology (20100024645).
References
Author notes
Associate editor: Billie Swalla
