


Abstract
Regions of disc galaxies with widespread star formation tend to be both gravitationally unstable and self-shielded against ionizing radiation, whereas extended outer discs with little or no star formation tend to be stable and unshielded on average. We explore what drives the transition between these two regimes, specifically whether discs first meet the conditions for self-shielding (parametrized by dust optical depth, τ) or gravitational instability (parametrized by a modified version of Toomre's instability parameters, Qthermal, which quantifies the stability of a gas disc that is thermally supported at T = 104 K). We first introduce a new metric formed by the product of these quantities, Qthermalτ, which indicates whether the conditions for disc instability or self-shielding are easier to meet in a given region of a galaxy, and we discuss how Qthermalτ can be constrained even in the absence of direct gas information. We then analyse a sample of 13 galaxies with resolved gas measurements and find that on average galaxies will reach the threshold for disc instabilities (Qthermal < 1) before reaching the threshold for self-shielding (τ > 1). Using integral field spectroscopic observations of a sample of 236 galaxies from the Mapping Nearby Galaxies at APO (MaNGA) survey, we find that the value of Qthermalτ in star-forming discs is consistent with similar behaviour. These results support a scenario where disc fragmentation and collapse occurs before self-shielding, suggesting that gravitational instabilities are the primary condition for widespread star formation in galaxy discs. Our results support similar conclusions based on recent galaxy simulations.
1 INTRODUCTION
Star formation can only proceed within galaxies when certain conditions are met. For decades, several physical models for star formation have been proposed and debated, typically relating the star formation rate (SFR) to specific properties of the interstellar medium (ISM) such as gas surface density, metallicity, dynamics, or some combination thereof. The most popular star formation relation was introduced by Schmidt (1959) who argued that the local surface density of star formation, ΣSFR, is related to the local surface density of gas, Σg, by the power law |$\Sigma _{\rm SFR} \propto \Sigma _{\rm g}^N$|. Kennicutt (1998) showed that globally averaged values of Σg and ΣSFR follow such a relation over several orders of magnitude. A similar correlation is found on sub-kpc scales (Bigiel et al. 2008) with an additional dependence on the local dust-to-gas ratio (Leroy et al. 2013). At gas densities below Σg ∼ 10 M⊙ pc−2 the power-law relation breaks down, but it can be recovered if one isolates only the denser molecular gas in regions that are on average low density (Schruba et al. 2011), consistent with a picture where ΣSFR is most directly correlated with the denser molecular gas surface density, |$\Sigma _{\rm H_2}$|.
Under the assumption that |$\Sigma _{\rm SFR}\propto \Sigma _{\rm H_2}$|, several authors have formulated star formation laws based around conditions of the ISM that govern its molecular fraction. Elmegreen (1989) introduced a relationship between molecular fraction and hydrostatic mid-plane pressure (see also Elmegreen & Parravano 1994; Wong & Blitz 2002; Blitz & Rosolowsky 2004, 2006). Alternative models assume H2 formation is regulated by local gas density and metallicity (or dust-to-gas ratio, assumed to follow a 1:1 relation with metallicity), the combination of which determine the ability for gas to shield itself from background ionizing radiation, at which point it can cool, condense, and form stars (Schaye 2004; Krumholz, McKee & Tumlinson 2009; Krumholz 2012). A common theme of these prescriptions is that star formation is regulated by the local conditions of the ISM, and in principle the relevant physics should not vary from galaxy to galaxy.
However, several studies have suggested that the larger scale dynamical properties of galaxies play a major role in regulating star formation. In such models, the potential for dense clouds to form is set by the competition between the self-gravity of the disc and some combination of gas dispersion, Coriolis forces, cloud collision rate, and shear (Safronov 1960; Toomre 1964; Jog & Solomon 1984; Romeo 1992; Wang & Silk 1994; Hunter, Elmegreen & Baker 1998; Tan 2000; Rafikov 2001; Elmegreen 2011). Prescriptions that relate ΣSFR to dynamical properties (or dynamical time-scales) are able to fit both regular star-forming galaxies and starbursts on a single relation, which has been a struggle for laws that relate star formation and gas density alone (Daddi et al. 2010; Genzel et al. 2010; Utreras, Becerra & Escala 2016). Additional support for the relevance of dynamical properties comes from observations of ‘star formation thresholds’, rapid drops in the ΣSFR at the presumed radius where discs stabilize (Kennicutt 1989; Martin & Kennicutt 2001) according to the Q parameter of Toomre (1964). However, these interpretations have been challenged by commonly observed (although typically weak) star formation at radii beyond these ‘thresholds’. In particular, studies that trace star formation using ultraviolet (UV) continuum find much less extreme radial declines in star formation compared to studies that use Hα emission (Ferguson et al. 1998; Ryan-Weber et al. 2004; Gil de Paz et al. 2005; Boissier et al. 2007; Thilker et al. 2007; Christlein, Zaritsky & Bland-Hawthorn 2010; Hunter, Elmegreen & Ludka 2010; Werk et al. 2010; Lemonias et al. 2011; Moffett et al. 2012). One physical explanation for the observed difference between Hα and UV profiles is that SFR has dropped low enough in outer discs that there are simply too few massive, short lived O stars to generate Hα emission, whereas the UV emission is more visible because it is sensitive to slightly less massive, longer lived B stars (Boissier et al. 2007). None the less, studies have found that star formation efficiency or SFE (here defined as |${\rm SFE=\frac{\Sigma _{\rm SFR}}{\Sigma _{\rm g}}}$|) is significantly lower (by a factor of ∼10) in extended outer discs compared to inner discs (Kennicutt 1989; Zasov & Bizyaev 1994; Bigiel et al. 2010a). It is possible that although star formation can occur at large radii in the presence of localized overdensities – due to e.g. tidal interactions, spiral density waves, and/or cold accretion (Thilker et al. 2007; Bush et al. 2008; Roškar et al. 2010) – outer discs are on average dynamically stable against fragmentation, explaining their extremely low SFE.
Many of the proposed models for star formation are at least partially valid because they relate the conditions of the ISM to the presence and/or rate of star formation. Nevertheless, it is still debated which physical prescription best describes the underlying conditions that eventually lead to widespread star formation in galaxies. As an alternative way of posing this question, let us consider radial annuli within a galaxy. At some large radius the gas in an annulus will be dynamically stable (likely supported by thermal gas pressure at T ≳ 104 K) and not self-shielded against the background UV field. Presumably, this annulus will have no star formation, or at least extremely low efficiency of star formation (as mentioned above, density fluctuations may drive localized star formation, but in an annulus-averaged sense, the disc is not conducive to star formation). Conversely, at some smaller radius, the disc will be unable to resist fragmentation, will be shielded against background radiation, and will be forming stars. What defines this transition? As we move from large to small radius, do annuli first become unstable and fragment, only after which the gas self-shields? Or, does the gas reach its self-shielding threshold first, only after which instabilities and fragmentation can occur?
Multiple studies have attempted to address this question, with differing results. Work by Schaye (2004) and Krumholz et al. (2009) suggest that instability occurs only after a cold ISM phase develops that lowers the gas velocity dispersion. In these models, star formation is tied to the dust optical depth, τ, which determines the ability of gas to self-shield. In contrast, Orr et al. (2017) examine the fire simulations (Hopkins et al. 2014) and find that star formation is prevalent throughout regions that are not self-shielded on average. Instead, the onset of vigorous star formation (ΣSFR > 10−3 M⊙ yr−1 kpc−2) occurs very close to where galaxies cross the threshold where discs can no longer support themselves through thermal gas pressure (Qthermal ≲ 1), which occurs well before they cross the threshold for self-shielding. In fact, additional tests where Orr et al. (2017) remove the ability of gas to self-shield and cool below 104 K yield distributions of star formation that are very similar to the full physics runs. Meanwhile, tests where only self-shielded gas can form stars yield almost no star formation beyond ∼1/3Re (where Re is the half-light radius), in significant disagreement with the full physics runs. The discrepancies between different studies highlight the need for observational studies to constrain which of these theoretical pictures is correct.
We use two independent data sets to observationally constrain the link between star formation, disc stability (Qthermal), and dust optical depth (τ). The first data set, drawn from the compilation of Leroy et al. (2008), is composed of a small sample of nearby galaxies with high-quality measurements of gas content. The second sample is drawn from the significantly larger and more representative Mapping Nearby Galaxies at APO (MaNGA) survey (Bundy et al. 2015), but lacks estimates of gas surface density needed to estimate τ and Qthermal directly. However, we describe how the product of these two parameters, Qthermalτ, can be used to distinguish whether the conditions for self-shielding or gravitational instability will be met first, and can be constrained without direct gas measurements. Thus, we address the science questions of this paper from two different angles with data sets that each have their respective strengths and weaknesses.
In Section 2 we describe the parameters used to quantify the conditions of the ISM and how these parameters are used to test different physical models of the onset of star formation in galaxies. In Section 3 we describe the data sets used in this study. Our results are presented in Section 4, and in Section 5 we give a more detailed discussion of important systematic errors and the implications of our findings. Our conclusions are presented in Section 6.
2 METHODOLOGY
2.1 |$\boldsymbol {\tau }$| and |$\boldsymbol {Q_{\rm thermal}}$|
Qg,thermal is not the same as Q commonly measured in cold gas. Qg,thermal quantifies the ability of the disc to stabilize itself explicitly via thermal gas pressure assuming all the gas has T = 104 K, which characterizes the typical conditions in the non-star-forming outer gas disc. We expect that regions with Qg,thermal < 1 will fragment and form stars, which in reality can generate other forms of support (e.g. turbulence) through gravitational instabilities and feedback that drive the observed Q back towards ∼1 even though Qthermal < 1. However, the fact that such regions are experiencing non-thermal means of support, which either lead to star formation or result from it, suggests that they have entered a ‘star-forming’ regime. Therefore, Qg,thermal is a conservative indicator of the ability of a gaseous annulus to resist fragmentation, while also capturing the relevant conditions of the outer gas disc.
Although we have chosen Qthermal as our indicator of disc stability, it is not the only proposed means to describe the threshold for gravitational instability. Hunter et al. (1998) proposed a scenario in which the formation of dense clouds is regulated by competition with shear. Their formalism primarily affects inner regions of galaxies with rising rotation curves, whereas our study will be focused on larger radii where rotation curves are typically flat, in which case the shear-regulated threshold reduces to approximately the same form as Qthermal.
2.2 The onset of widespread star formation and |$\boldsymbol {Q_{\rm thermal}\tau }$|
We consider two basic scenarios that describe the transition between non/weakly star-forming outer discs to vigorously star-forming inner regions of galaxies. This simple picture assumes that at some large radius, the gas disc is gravitationally stable from thermal pressure (Qthermal > 1) and unshielded (τ < 1), while the centre is gravitationally unstable (Qthermal < 1) and self-shielded (τ > 1). The two scenarios differ in their assumptions about whether self-shielding or disc instabilities determine the onset of widespread star formation in galaxy discs as we move from large to small radius, which is essentially a question of which threshold for star formation is met first. These two scenarios are illustrated in the top row of Fig. 1.
Self -shielding-driven: disc instabilities and fragmentation occur after self-shielding (e.g. Schaye 2004; Krumholz et al. 2009). In this scenario, a galaxy will cross the threshold for self-shielding before it crosses the threshold for disc instabilities. Therefore, as we move from large to small radius, we will encounter annuli that are on average self-shielded (τ > 1) but still gravitationally unstable (Qthermal > 1).
Fragmentation-driven: disc instabilities occur before self-shielding (e.g. Orr et al. 2017). In this scenario, the threshold for gravitational instability from thermal support is crossed before the threshold for self-shielding. Therefore, as we move from large to small radius, we will encounter annuli with that are on average gravitationally unstable (Qthermal < 1) but not yet self-shielded (τ < 1).
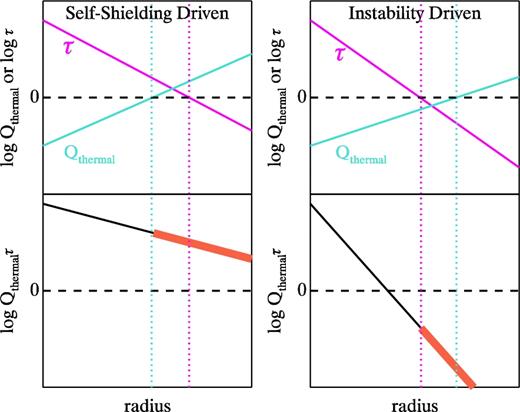
Schematic models illustrating the radial behaviour of Qthermal and τ (top panels), and Qthermalτ (bottom panels) under two different scenarios to describe the onset of widespread star formation in galaxy discs. The horizontal dashed line indicates the threshold for star formation, and the vertical dotted lines indicate where each parameter crosses this threshold. The thick red line in the bottom panels highlights the region in the outer disc where Qthermalτ can be used to discriminate the two scenarios. Even in regions where neither threshold has been crossed (e.g. at very large radius in both models), Qthermalτ still indicates which threshold will be crossed first if the gas density is increased.
Note that under the second scenario where Qthermal < 1 and τ < 1, we are not implying that any localized star-forming regions are unshielded. Instead, they are almost definitely self-shielded, but since self-shielding occurs after disc fragmentation, the point at which the disc on average has τ > 1 lags behind the point at which the disc on average has Qthermal < 1.
Both τ and Qthermal depend on Σg, which is often unknown. However, we argue that the product, Qthermalτ can provide useful constraints on whether fragmentation or disc opacity is the underlying driver of widespread star formation in galaxy discs, and this product can be constrained even in the absence of direct gas estimates.
Although we would ideally compare independent measures of Qthermal and τ against one another, we can still place constraints on Qthermalτ without such information. To illustrate the utility of Qthermalτ further, we revisit the two basic scenarios shown in Fig. 1.
Self -shielding-driven. This scenario is characterized by the presence of annuli that are on average self-shielded (τ > 1) but not gravitationally unstable (Qthermal > 1). These annuli will have Qthermalτ > 1.
Fragmentation-driven. This scenario is characterized by the presence of annuli that are on average gravitationally unstable (Qthermal > 1) but not self-shielded (τ < 1). These annuli will have Qthermalτ < 1.
The behaviour of Qthermalτ is illustrated in the bottom panels of Fig. 1. The key difference between these scenarios is whether Qthermalτ is greater than or less than unity in the outer discs of galaxies. Formally, Qthermalτ measures whether Qthermal or τ is closest to its relevant threshold, but does not imply either threshold is currently met. In the case where neither threshold is satisfied (e.g. at the largest radii in Fig. 1), Qthermalτ indicates which threshold would be easier to reach if the gas surface density were larger. In this sense, Qthermalτ allows us to ‘roll back the clock’ in annuli where star formation is occurring but neither threshold is currently satisfied; we can infer which threshold is more likely to have been reached first to initiate star formation in the past.
We must be cautious when interpreting Qthermalτ at small radii. Qthermalτ is informative at and beyond the region where one threshold has been reached, but the other has not. For example, in Fig. 1Qthermalτ > 1 for both the self-shielding and instability-driven models at small radius. For this reason, we will focus our analysis on the value of Qthermalτ at large radii (typically >1.5Re).
Throughout this work, we define ΣSFR > 10−3 M⊙ yr−1 kpc−2 as the boundary between regions with widespread star formation and those with weak/no star formation. This specific value has little physical significance. Although it roughly corresponds to the typical value where ΣSFR profiles tend to more rapidly decline (star formation ‘thresholds’), such behaviour may simply reflect the failure of Hα emission as a star formation tracer at low surface brightness. We largely highlight 10−3 M⊙ yr−1 kpc−2 to facilitate comparison with Orr et al. (2017), who use the same value to separate star-forming and non-star-forming annuli. The key results of this paper are not explicitly tied to this value of ΣSFR.
Choosing ΣSFR = 10−3 M⊙ yr−1 kpc−2 as the definition of ‘star-forming’ annuli also essentially guarantees that star formation is present in annuli that are currently not self-shielded on average. Our definition of self-shielded corresponds to |$\Sigma _{\rm H_2}/\Sigma _{\rm H\, \small {I}} \sim 1$|, which is expected in gas densities of ∼27 M⊙ pc−2 (Krumholz et al. 2009), and these gas densities typically correspond to ΣSFR ∼ 10−2 M⊙ yr−1 kpc−2 (Bigiel et al. 2008). This fact does not immediately rule out the ‘self-shielding-driven’ star formation scenario. Instead, the important test being conducted in this study is whether disc instabilities occur before or after self-shielding. It is more important to consider the conditions of the ISM at the start of star formation rather than at the present, and as discussed above, Qthermalτ allows us to consider which threshold would have been easier to reach first.
3 DATA AND DERIVED QUANTITIES
We employ two independent data sets for our analysis. The first, drawn from Leroy et al. (2008, hereafter L08), contains direct measurements of gas surface density for a small subset of nearby galaxies. The second, drawn from the MaNGA survey, lacks direct estimates of gas surface density but is significantly larger and more representative of the galaxy population. In the following section, we discuss these data sets and derived quantities.
3.1 The Leroy et al. (2008, L08) sample
To compose a sample of galaxies with resolved gas data, we use the compilation from L08 who combine data from the Spitzer Infrared Nearby Galaxies Survey (SINGS; Kennicutt et al. 2003), The HI Nearby Galaxy Survey (THINGS; Walter et al. 2008), HERA CO-Line Extragalactic Survey (HERACLES; Leroy et al. 2009), Berkeley–Illinois–Maryland Association (BIMA) Survey of Nearby Galaxies (SONG; Helfer et al. 2003), and Galaxy Evolution Explorer (GALEX) Nearby Galaxy Survey (NGS; Gil de Paz et al. 2007) surveys to create radial surface density profiles of H i, H2, stellar mass, and SFR with sub-kpc radial spacing for 23 nearby galaxies. We refer the reader to L08 for more specific details about the calculation of these profiles.
3.1.1 Kinematics
Rotation velocities, vrot, were derived from THINGS velocity fields. L08 provide fits to these data of the form |$v_{\rm rot}=v_{\rm flat}[1-{\rm e}^{-r/l_{\rm flat}}]$|. We use the analytical fits to estimate κ as a function of radius.
3.1.2 Gas-phase metallicity
Gas-phase metallicities are taken from Moustakas et al. (2010) who compile metallicities of individual H ii regions in galaxies from the SINGS sample. This compilation provides two different estimates of metallicity using the calibrations of Kobulnicky & Kewley (2004, hereafter KK04) and Pilyugin & Thuan (2005), both of which employ the R23 parameter (Pagel et al. 1979). Because of the notoriously large systematic errors between different strong-line calibrations, we must be cautious when choosing our metallicity estimate and drawing conclusions from it. We opt to use the KK04 metallicities because of their relatively good agreement with the N2O2 calibration we employ for the MaNGA sample (see Section 3.2.2); the two calibrations yield mass–metallicity relationships with similar slopes and systematic offsets no larger than 0.1 dex (Kewley & Ellison 2008). The impact of systematic errors in metallicity estimates is discussed further in Section 4.
Since the Moustakas et al. (2010) compilation provides metallicities for individual H ii regions, it does not always evenly sample the metallicity profile at all radii. Therefore, to estimate gas-phase metallicity as a function of radius, we fit linear functions to the H ii region metallicities (12 + log O/H) as a function of radius for each galaxy. We require at least five data points for our linear fits.
3.1.3 Sample selection
We limit our sample to galaxies with stellar masses above M* = 109 M⊙ to match the approximate minimum stellar mass of MaNGA. After removing any additional galaxies with insufficient metallicity information, we are left with 13 galaxies in our final sample.
3.2 MaNGA data
Our second data set comes from the SDSS-IV MaNGA survey (Bundy et al. 2015; Drory et al. 2015; Law et al. 2015, 2016; SDSS Collaboration et al. 2016; Yan et al. 2016a,b; Blanton et al. 2017), an integral field unit (IFU) survey of 10 000 z ∼ 0 galaxies with M* > 109 M⊙. This survey uses the SDSS 2.5-m telescope (Gunn et al. 2006) and Baryon Oscillation Spectroscopic Survey (BOSS) spectrographs (Smee et al. 2013), with a wavelength coverage of 3500–10000 Å, spectral resolution R ∼ 2000 (instrumental resolution ∼60 km s−1), and an effective spatial resolution of 2.5 arcsec [full width at half-maximum (FWHM)] after combining dithered observations.
3.2.1 Kinematics
Assuming a parametric form for rotation curves, tilted thin-disc models from Andersen & Bershady (2013), which determines the best-fitting kinematic geometry [position angle (PA) and inclination (i)], are fit to stellar and ionized gas (Hα) kinematic fields from the MaNGA data analysis pipeline. One-dimensional profiles sampled every 2.5 arcsec are extracted using the data within ±30° of the major axis. These profiles are fit with a model of the form vrot(R) = vflattanh (R/hrot), where vflat and hrot are free parameters, in order to estimate κ. Although this formula is different from that employed by L08, the two have a very similar shape and we do not expect this difference to impact our results.
Our analysis is limited to disc galaxies that are ‘kinematically regular’, defined by similar kinematic geometries for the stars and gas and disc inclinations consistent with photometric estimates based on the NASA Sloan Atlas (NSA).2 The kinematic modelling process is further described in Westfall et al. (in preparation).
Although MaNGA technically measures stellar velocity dispersions, the expected values are ∼30 km s−1 in the outer discs of galaxies (e.g. Bottema 1993; Shapiro, Gerssen & van der Marel 2003; Martinsson et al. 2013), well below the MaNGA's velocity resolution of ∼60 km s−1. Therefore, we again indirectly estimate σ* using equation (6). Disc scale lengths are taken from the bulge–disc decompositions of Simard et al. (2011).
3.2.2 Gas-phase metallicities
Two different strong-line calibrations are used to estimate gas-phase metallicity. The first, N2O2, uses the [N ii] λ6584/[O ii] λ3727 flux ratio and is based on photoionization models (Kewley & Dopita 2002). It is relatively insensitive to the ionization parameter and diffuse interstellar gas (Zhang et al. 2017). The second method, O3N2, uses the [O iii] λ5007/Hβ and [N ii]/Hα flux ratios (Marino et al. 2013), and while more sensitive to ionization and diffuse interstellar gas, it is calibrated directly from observations using electron temperature (i.e. the ‘direct’ method). The N2O2 and O3N2 methods differ on their merits but helpfully bracket the metallicity range of ∼0.4 dex spanned by available calibrations. We assume a solar metallicity of 12 + log (O/H)⊙ = 8.69 (Asplund et al. 2009).
All emission line fluxes are corrected for foreground extinction using Schlegel, Finkbeiner & Davis (1998). Internal extinctions are estimated from the Balmer decrement assuming Hα/Hβ = 2.86 (Osterbrock & Ferland 2006). We limit our analysis to regions where the Hα and Hβ flux signal-to-noise ratio (S/N) is larger than 3. All corrections use the extinction curve from Fitzpatrick (1999) with RV = 3.1.
Radial metallicity profiles are extracted for each galaxy using physical radii determined from the kinematic modelling (see Section 3.2.1). Radial bins are spaced by 2.5 arcsec along the major axis. The final metallicity in each bin is the median of all spaxels in that bin. We only use spaxels with [O iii]/Hβ and [N ii]/Hα in the H ii region of the Baldwin–Phillips–Terlevich (BPT) diagram (Kewley et al. 2006). We ignore any spaxels flagged as unreliable by the MaNGA data reduction and analysis pipelines (Law et al. 2016; Westfall et al., in preparation) and only include annuli with at least five usable spaxels.
3.2.3 Stellar surface densities
Estimates of Σ* come from the pipe3d analysis pipeline that uses a modified version of fit3d, a fitting tool for analysing the properties of stellar populations and ionized gas with moderate resolution optical spectra of galaxies, where linear combinations of simple stellar populations (SSPs) are fit to each spaxel to determine Σ*. We refer the reader to Sánchez et al. (2016a,b) for further details about the fitting procedure. Radial profiles of Σ* are determined using the average of all spaxels in annuli identical to those used to calculate metallicity profiles.
3.2.4 Sample selection
Our sample is drawn from data acquired during the first year of normal MaNGA operations (1368 galaxies), roughly equivalent to the SDSS-IV DR133 sample. In addition to selecting only ‘kinematically regular’ galaxies (Section 3.2.1), we only include galaxies with 40° < i < 70° to further ensure both reliable kinematics and that our analysis focuses on disc material rather than extraplanar gas. We remove any galaxies where the measured rotation curves have not flattened by the outermost radius so that we can reliably extrapolate to estimate vrot at large radii along minor axes. We reject galaxies with NUV − r > 4.5 to avoid extremely gas-poor systems (gas-to-stellar mass ratio <0.05; Catinella et al. 2013), where the NUV and r-band magnitudes are taken from the NSA. Lastly, we remove any galaxies that are obvious mergers. Our final sample is composed of 236 galaxies with stellar masses of ∼109–11.2 M⊙.
Fig. 2 shows our final sample in NUV − r versus M* space in the context of the full MaNGA sample. We also show the position of our sample drawn from L08 using photometry taken from Muñoz-Mateos et al. (2009) and Brown et al. (2014). In three cases SDSS r-band magnitudes were not measured directly, in which case we roughly approximated them by interpolating the optical–infrared spectral energy distributions (SEDs).
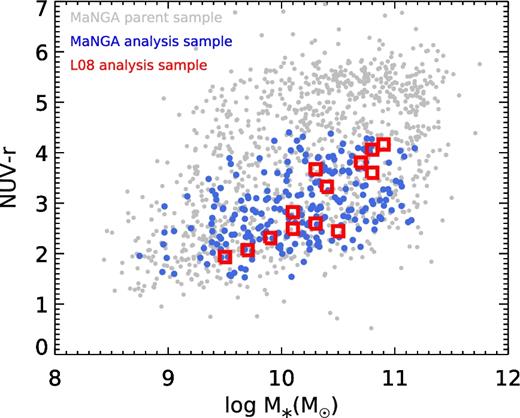
NUV − r versus M* distribution for the parent MaNGA sample (small grey points), the subset of 236 MaNGA galaxies incorporated into our analysis (larger blue points), and the 13 galaxies from L08 (red squares).
4 RESULTS
With our two independent samples, we investigate the behaviour of Qthermal, τ, and Qthermalτ in galaxy discs in order to test the self-shielding-driven and fragmentation-driven star formation scenarios described in Section 2.2.
4.1 The L08 sample
First, we examine the behaviour of the L08 sample with direct measurements of gas content. Radial profiles of Qthermal, τ, Qthermalτ, and ΣSFR are shown in Fig. 3. We also separately show Qthermal and Qthermalτ for just the gas components, giving an indication of how ignoring the stellar component can overestimate these quantities. Note that although we have plotted Qthermalτ as a function of radius, our primary interest is the value of Qthermalτ in the outer discs of galaxies.
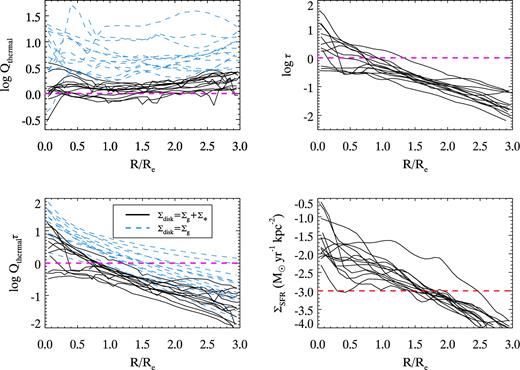
Radial profiles of Qthermal, τ, Qthermalτ, and ΣSFR for our sample of 13 galaxies with resolved gas data from L08. Where applicable, the blue dashed lines show the estimates assuming Σ* is negligible (equation 5). The radii taken from L08 are normalized by the optical disc radius, R25. We convert the radii to units of Re for easier comparison to our MaNGA sample by assuming R25/Re = 2.5 (based on radii tabulated in Jansen et al. 2000). These data show that discs remain at least borderline unstable while their ability to self-shield drops off much more rapidly. Consistent with the behaviour of τ and Qthermal, Qthermalτ < 1 over much of the outer disc.
While there is a mild trend of decreasing Qthermal with decreasing radius, generally Qthermal ∼ 1 over all radii, signalling that the discs are neither drastically stable nor unstable. Notably, the gas discs alone would be stable through thermal support alone; it is the addition of the stellar component that weakens the overall stability of the disc. The ability of the disc to self-shield drops off very rapidly with increasing radius, and in some cases never reaches τ > 1. Significant star formation is present in annuli that are not, on average, self-shielded (as previously noted, we still expect any local star-forming regions within an annulus to themselves be shielded), but are, on average, borderline unstable. This behaviour is similar to that observed in Orr et al. (2017), although we find lower values of Qthermal in star-forming regions. This discrepancy is largely due to our different treatment of the stellar velocity dispersion. Orr et al. (2017) assume σ* ∼ cs, while we estimate values of σ* that are 2–3 times larger.
These data can also be used to test the behaviour of Qthermalτ. Qthermalτ drops off rapidly with radius, reaching values <1 by ∼Re for all galaxies. These low values support the ‘fragmentation-driven’ scenario discussed in Section 2. This interpretation is consistent with the behaviour of Qthermal and τ individually; as radius increases, τ continues to decline while Qthermal remains ∼1, signalling that the outer disc would reach a point of instability well before it reached the threshold for self-shielding.
The τ parameter is not the only means of estimating where the disc is H2 dominated. Alternatively, Blitz & Rosolowsky (2006) provide a calibration relating |$\Sigma _{\rm H_2}/\Sigma _{\rm \small {H\, I}}$| to hydrostatic mid-plane pressure, which is itself a function of gas and stellar surface densities and velocity dispersions. We explored using this parameter instead of τ, but find that the threshold where |$\Sigma _{\rm H_2}/\Sigma _{\rm \small {H\, I}}=1$| does not change significantly.
4.2 The MaNGA sample
Although the L08 sample provides high-quality data, it is extremely small and not representative of the full galaxy population. Therefore, we now examine the behaviour of the much larger MaNGA sample. We cannot examine Qthermal and τ directly with MaNGA, but we can constrain Qthermalτ using equation (5).
In Fig. 4, we show the radial dependence of Qthermalτ. Each small point represents one 2.5-arcsec annulus in a single galaxy. We also show κ and 12 + log O/H, the two quantities go directly into the calculation of Qthermalτ, as well as ΣSFR, where ΣSFR is estimated from Hα luminosity using the calibration from Kennicutt & Evans (2012).
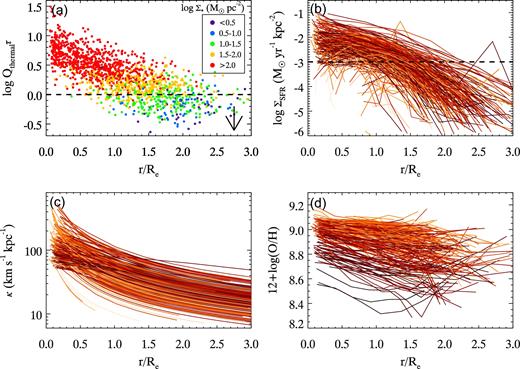
(a) Qthermalτ versus radius normalized by Re, where Qthermalτ is approximated with equation (5). Each point represents one 2.5-arcsec annulus where the N2O2 method is used to estimate Z΄. The colours indicate Σ* in each annulus. The arrow indicates the average amount that Qthermalτ would decrease if the O3N2 method was instead used to estimate Z΄. (b) Stacked ΣSFR profiles for our MaNGA sample determined from Hα surface brightness. (c) Stacked κ profiles for our MaNGA sample determined from ionized gas rotation curves. (d) Stacked 12 + log O/H profiles determined with the N2O2 strong-line method. For easier viewing, stacked profiles are coloured based on their stellar mass, with lower mass galaxies shown in darker shades.
Qthermalτ approaches values around ∼1 as we move away from the centres of galaxies, although there is significant scatter. In contrast to the analysis of the L08 sample, a significant number of galaxies have Qthermalτ > 1 at large radii. However, recall that unless Σg ≫ Σ*, equation (5) is an upper limit on Qthermalτ. Not accounting for any stellar component can significantly overestimate Qthermalτ, as illustrated by the profiles with and without the stellar component in Fig. 3. We see evidence for this bias when we examine the behaviour of the data in Fig. 4 as a function of Σ*, where at fixed radius, annuli with lower Σ* tend to have lower Qthermalτ. If we limit our analysis to annuli with Σ* < 101.5 M⊙ pc−2, Qthermalτ < 1 on average. Given that this subset yields more accurate estimates of Qthermalτ compared to the full sample when applying equation (5) (assuming Σg makes up a larger fraction of the disc surface densities in these regions), these data lend support to the ‘fragmentation-driven’ star formation scenario. In Section 5.1, we revisit the issue of how much Qthermalτ may be overestimated in the presence of an unaccounted for stellar component.
An additional important systematic error to keep in mind is our choice of strong-line metallicity indicator. The R23 and N2O2 methods we use for Figs 3 and 4 provide higher metallicities than most other strong-line calibrations. For instance, in Fig. 4 we expect the upward systematic uncertainty on Qthermalτ to be <0.1 dex based on the comparison of different methods by Kewley & Ellison (2008). The larger uncertainty is downward, and the arrow in Fig. 4 illustrates the mean shift in the data points if we instead adopt the O3N2 strong-line metallicity calibration. Additionally, our assumed gas sound speed is higher than typically used values for gravitational stability analysis. Although this is by design since we are interested in the transition from stable, unshielded, non-star forming T = 104 K disc to one with the opposite properties, it also means Qthermal makes optimistic assumptions about the ability of the gas to resist collapse. In summary, our combination of systematic errors make it more likely that we have overestimated, rather than underestimated, Qthermalτ, which only strengthens our claims that Qthermalτ < 1 in the outer discs of galaxies.
5 DISCUSSION
Using two independent data sets, we have explored the behaviour of Qthermal, τ, and Qthermalτ within galaxy discs in order to constrain whether they first reach the threshold for self-shielding or gravitational instability in star-forming regions. In the first data set from L08, we find star formation proceeding in annuli that are borderline unstable but far from self-shielded on average. With our second data set from the MaNGA survey, we find that the mean value on the upper limit of Qthermalτ at the edge of discs with widespread star formation is ∼1, but when focusing only on those galaxies with the lowest Σ* where the upper limits are most robust, we find Qthermalτ < 1 on average. We begin our discussion of these results by first exploring the extent to which Qthermalτ may be overestimated by equation (5), and how our results may change when we account for this effect. We finish by discussing the implications our results have for what drives widespread star formation in galaxies.
5.1 Overestimation of |$\boldsymbol {Q_{\rm thermal}\tau }$|
In Section 4, we discussed how Qthermalτ may be overestimated in the presence of an ignored stellar component. We now quantify the magnitude of this effect and its impact on our results.
Equation (5) yields the most accurate estimates of Qthermalτ when Σg ≫ Σ*. Within the L08 sample, we find that such conditions are actually very rare; only a small fraction of galaxies have regions with Σg/Σ* > 1, and typically only at r ≳ 2 Re. A major caveat is that the L08 sample is not representative so we cannot explicitly assume these conclusions hold for all MaNGA galaxies.
However, using all available annuli in the L08 sample, we can get a sense for how Σg/Σ* varies as a function of Σ*. Fig. 5 plots the distribution of gas fraction fg = Σg/(Σg + Σ*) as a function of Σ* from L08 (we use all 23 galaxies from L08 regardless of whether metallicity information is available). There is a wide spread in fg as a function of Σ*, but there is a clear upper envelope in the point distribution. Only at very low values of Σ* (log Σ* ≲ 0.8 M⊙ pc−2) do gas surface densities begin to dominate over stellar surface densities. Using of the upper envelope of fg in Fig. 5, we estimate the maximum possible values of Σg as a function of Σ*, using fg values4 of 0.8, 0.7, 0.4, 0.2, and 0.2 for log Σ* regimes of <0.5, 0.5–1.0, 1.0–1.5, 1.5–2.0, and >2.0 M⊙ pc−2. These estimates are conservative towards instabilities in the sense that they illustrate the minimum relative impact of any stellar component on Qthermal while maximizing the potential for self-shielding.
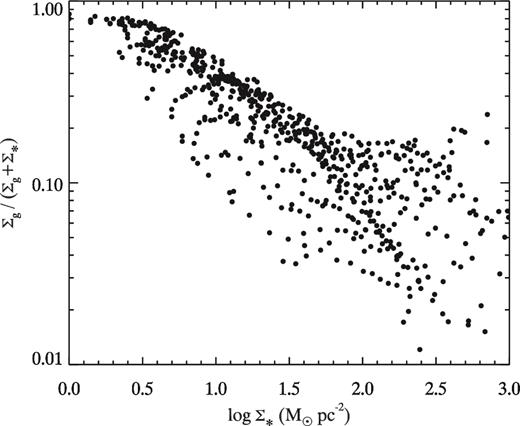
Fig. 6 shows radial profiles of Qg, thermal, Q*, Qthermal, τ, and Qthermalτ using our estimates of Σg. As expected, the combination of gas and stars has lowered Qthermal such that it largely falls below unity at large radius. Similarly, τ < 1 at large radius, even though our estimates of Σg are the maximum possible values. Additionally, Qthermalτ < 1 consistently in the outer disc, and the secondary dependence on Σ* is much weaker compared to Fig. 4. In summary, this analysis supports the fragmentation-driven scenario by showing that annuli will cross the threshold for gravitational instability before they cross the threshold for self-shielding.
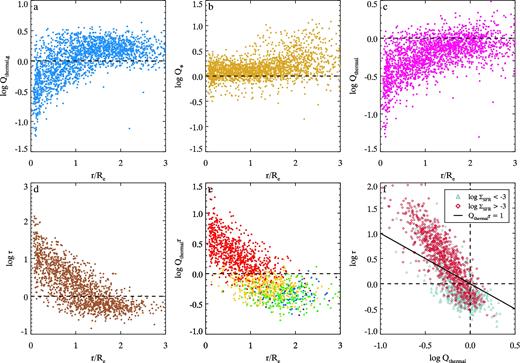
Properties of our MaNGA sample after approximating Σg based on the data in Fig. 5 and incorporating the stellar component. Panels (a)–(e) show the radial dependence of Qg, thermal, Q*, Qthermal, τ, and Qthermalτ. The colour coding in panel (e) is the same as that of Fig. 4(a). Panel (f) shows the distribution of annuli in τ, Qthermal parameter space. This analysis supports our claim that disc will reach the threshold for disc stability before they reach the threshold for self-shielding.
Fig. 6 also shows the distribution of annuli in τ versus Qthermal parameter space, which is the observational equivalent to fig. 8 from Orr et al. (2017) who examine this distribution in the fire simulations. Consistent with Orr et al. (2017), we find that star-forming annuli (ΣSFR > 10−3 M⊙ yr−1 kpc−2) begin to appear around Qthermal ∼ 1 and τ < 1. Our data do not show the locus on non-star-forming annuli extending into the Qthermal > 1, τ > 1 quadrant shown by Orr et al. (2017), but this is due observational limitations (i.e. we cannot measure rotation velocity or metallicity without the presence of emission lines). Independent of how we divide star-forming and non-star-forming annuli, this figure illustrates how the regime with τ > 1 and Qthermal > 1 is essentially unpopulated, emphasizing the point that galaxies appear to first reach gravitational instability and then self-shield, not vice versa.
The above analysis has been done assuming the highest reasonable value of Σg at a given Σ*. Although this choice maximizes τ, it biases us towards lower Qthermal. However, Q* sets an upper limit on Qthermal, and we estimate Q* to be only slightly above 1. Therefore, any decrease in Σg will lead to an increase in Qthermal that is much slower than the corresponding decrease in τ. Therefore, even with lower estimates for Σg, our discs will still be much closer to the threshold for gravitational instability than the threshold for self-shielding.
5.2 Implications for star formation in galaxy discs
Through both direct means (via measurements of Qthermal and τ) and indirect means (using Qthermalτ), we find results consistent with the existence of widespread star formation in galaxy discs in regions that are on average not self-shielded, but are unstable (or at least borderline unstable) in the presence of thermal gas support. Regardless of whether or not the discs are formally gravitationally unstable, their distance from the threshold for disc instability is far smaller than their distance from the threshold for self-shielding, indicating that an annulus will first become unstable and fragment before it becomes self-shielded. These data are consistent with a star formation scenario where widespread star formation in galaxy discs begins once a disc can no longer thermally support itself, at which point it fragments and triggers the growth of dense clouds that can locally self-shield. Our data are in agreement with Orr et al. (2017) that examine the onset of star formation within the fire galaxy simulations.
Our results may appear somewhat at odds with the findings of Schaye (2004) who argue that it is the formation of a molecular phase (even at very low levels) that leads to disc instabilities due to the associated sudden drop in gas temperature. Our findings essentially argue that such a drop in temperature is not a necessary ingredient to obtain disc instabilities; even when the gas is assumed to be 104 K, the discs are at least borderline unstable. Similar results are seen in Orr et al. (2017) where they find widespread gravitational collapse and star formation even when gas cooling is turned off. It is important to note that Schaye (2004) associate this cooling with |$\Sigma _{\rm H_2}/\Sigma _{\small {H\, I}}\ll 1$| and do not argue that the disc is fully self-shielded by when the cooling takes place, and in their models, |$\Sigma _{\rm H_2}/\Sigma _{\small {H\, I}}=1$| occurs at a much smaller radius. Therefore, our results are not entirely inconsistent with the findings of Schaye (2004), although we do not require any explicit drop in gas temperature/cs to lead to disc instabilities. If such temperature drops do occur, this will lead to lower Q and strengthen our results.
Although this study provides support for gravitational instabilities as the initial trigger that eventually leads to star formation in galaxy discs, we are not making any claims about the local efficiency of star formation once it begins, nor are we dismissing the importance of self-shielding on local scales. We are simply examining the large-scale conditions within galaxies that are conducive to dense cloud formation and widespread star formation. We claim that Qthermal is the more fundamental condition for star formation on large scales, and this is because the star-forming disc appears to become on average unstable before it becomes on average self-shielded. None the less, even in annuli that are on average not self-shielded, self-shielding is undoubtedly instrumental in local star-forming regions.
Our study does not explicitly explain the very inefficient star formation that occurs in extreme outer discs (Bigiel et al. 2010b). Based on the radial profiles of Qthermal in Fig. 3, we expect the extended regions of galaxies to have Qthermal > 1, consistent with other studies that find outer discs to generally be dynamically stable (Kennicutt 1989; Martin & Kennicutt 2001). As discussed in Section 1 it is possible for star formation to occur locally in a disc that is on average stable and unshielded if localized overdensities can be created. Without explicitly arguing what may drive such overdensities, we do note that we measure values of Qthermalτ that continue to decrease below unity at large radius. Even though these discs are neither gravitationally unstable or self-shielded, Qthermalτ < 1 implies that an increase in gas density will lead to gravitational instability before self-shielding, so the fragmentation-driven picture of star formation may still apply in the extreme outer discs of galaxies.
6 CONCLUSIONS
We have presented a new analysis on the relative importance of gravitational disc instabilities (parametrized by Qthermal) and self-shielding (parametrized by τ) to the onset of star formation in galaxy discs. We consider two basic scenarios for star formation where the primary condition for widespread star formation differs: the ‘self-shielding-driven’ model where discs first self-shield themselves against the background UV field and then become unstable and fragment, and the ‘fragmentation-driven’ model where discs first become unstable and fragment, only after which they are able to self-shield.
Using a small sample of galaxies with high-quality gas data where we can independently examine Qthermal and τ, we find evidence that galaxies will be able to reach the threshold for gravitational instability well before they cross the threshold for self-shielding in their outer discs. Using a larger sample from the MaNGA survey lacking direct gas information, we show that the value of Qthermalτ (which can be constrained in the absence of direct gas measurements) is consistent with galaxies being able to cross the threshold for disc instabilities first. The results from both of these samples lend support to the ‘fragmentation-driven’ scenario for star formation in galaxies.
Future observations that can directly resolve gas distributions in large and diverse samples of galaxies out to large radii will be highly valuable to further test the fragmentation-driven star formation scenario. Wide field interferometric surveys like Widefield ASKAP L-band Legacy All-sky Blind Survey (WALLABY) and Aperture Tile in Focus (APERTIF) survey that overlap MaNGA and other IFU surveys will be particularly beneficial. Similarly, the upcoming Local Volume Mapper (LVM) will yield high-quality optical spectroscopy to compliment the growing radio/mm-wave inventory of nearby galaxies. The combination of complete data for large samples will also enable exploration into whether the behaviour of Qthermal, τ, and Qthermalτ is universal for all galaxies, or whether they vary with other galaxy properties or their environments, potentially providing additional insight into the physical processes that regulate widespread star formation in galaxy discs.
Acknowledgements
We thank our anonymous referee for constructive feedback that greatly improved this work. We would also like to thank Christy Tremonti and Eric Emsellem for useful discussions. This work was supported by World Premier International Research Centre Initiative (WPI Initiative), MEXT, Japan. MB acknowledges NSF-AST-1517006. A-MW acknowledges support of a Leverhulme Trust Early Career Fellowship. DB acknowledges support from RSF grant RSCF-14-50-00043. MEO was supported by the National Science Foundation Graduate Research Fellowship under Grant No. 1144469. Funding for the Sloan Digital Sky Survey IV has been provided by the Alfred P. Sloan Foundation, the US Department of Energy Office of Science, and the Participating Institutions. SDSS-IV acknowledges support and resources from the centre for High-Performance Computing at the University of Utah. The SDSS web site is www.sdss.org.
SDSS-IV is managed by the Astrophysical Research Consortium for the Participating Institutions of the SDSS Collaboration including the Brazilian Participation Group, the Carnegie Institution for Science, Carnegie Mellon University, the Chilean Participation Group, the French Participation Group, Harvard-Smithsonian Centre for Astrophysics, Instituto de Astrofísica de Canarias, The Johns Hopkins University, Kavli Institute for the Physics and Mathematics of the Universe (IPMU)/University of Tokyo, Lawrence Berkeley National Laboratory, Leibniz Institut für Astrophysik Potsdam (AIP), Max-Planck-Institut für Astronomie (MPIA, Heidelberg), Max-Planck-Institut für Astrophysik (MPA, Garching), Max-Planck-Institut für Extraterrestrische Physik (MPE), National Astronomical Observatories of China, New Mexico State University, New York University, University of Notre Dame, Observatário Nacional/MCTI, The Ohio State University, Pennsylvania State University, Shanghai Astronomical Observatory, United Kingdom Participation Group, Universidad Nacional Autónoma de México, University of Arizona, University of Colorado Boulder, University of Oxford, University of Portsmouth, University of Utah, University of Virginia, University of Washington, University of Wisconsin, Vanderbilt University, and Yale University.
Footnotes
These correction factors are judged by eye.
REFERENCES
