


Abstract
We put constraints on the properties of the progenitors of peculiar calcium-rich transients using the distribution of locations within their host galaxies. We confirm that this class of transients do not follow the galaxy stellar mass profile and are more likely to be found in remote locations of their apparent hosts. We test the hypothesis that these transients are from low-metallicity progenitors by comparing their spatial distributions with the predictions of self-consistent cosmological simulations that include star formation and chemical enrichment. We find that while metal-poor stars and our transient sample show a consistent preference for large offsets, metallicity alone cannot explain the extreme cases. Invoking a lower age limit on the progenitor helps to improve the match, indicating these events may result from a very old metal-poor population. We also investigate the radial distribution of globular cluster systems, and show that they too are consistent with the class of calcium-rich transients. Because photometric upper limits exist for globular clusters for some members of the class, a production mechanism related to the dense environment of globular clusters is not favoured for the calcium-rich events. However, the methods developed in this paper may be used in the future to constrain the effects of low metallicity on radially distant core-collapse events or help establish a correlation with globular clusters for other classes of peculiar explosions.
INTRODUCTION
Supernovae (SNe) are luminous events caused by the explosions of stars. They are divided into observational sub-classes according to line features from different chemical elements appearing in the spectra; Type Ia supernovae (SNe Ia) are generally attributed to the thermonuclear disruption of a white dwarf (see e.g. Hillebrandt & Niemeyer 2000), while Type Ib/c supernovae (SNe Ib/c) and Type II supernovae (SNe II) result from the gravitational collapse of the core of a massive star at the end of its life (main-sequence mass ≳8 M⊙, Smartt 2009). However, details of the progenitor systems, the physics of the explosions and the evolutionary paths leading to those explosions are still unclear and under investigation.
Automated wide field optical transient surveys, e.g. the Texas Supernova Search (TSS; Quimby 2006)/ROTSE Supernova Verification Project (RSVP; Yuan 2010), the Catalina Real-Time Transient Survey (CRTS; Drake et al. 2009), the Palomar Transient Factory (PTF; Rau et al. 2009) and the Panoramic Survey Telescope and Rapid Response System (Pan-STARRS; Kaiser et al. 2002), have in recent years not only discovered hundreds of new SNe of all types, but discovered new types of transient events in hitherto unexplored regions of parameter space.
An increasing number of unusual events are being discovered by these surveys, often occurring in host environments poorly sampled by previous SN surveys, which targeted nearby massive galaxies. For example, PTF10ops is a peculiar SN Ia ∼ 148 kpc away from the nearest galaxy (Maguire et al. 2011). It is puzzling to also find core-collapse explosions at remote locations, given the expected low local star formation rate. The massive star progenitors of these core-collapse events either have very low metallicity (e.g. SN 1983K, Niemela, Ruiz & Phillips 1985; Phillips et al. 1990) or have gained very high velocity and migrated outward from the galaxy centre (Zinn, Grunden & Bomans 2011). Alternatively, a core collapse could be delayed if it is the result of the merger of two white dwarfs (e.g. an ONeMg and a He white dwarf; cf. Yoon, Podsiadlowski & Rosswog 2007). At present, it is not clear whether such mergers prefer old populations and/or low-metallicity environments.
Perets et al. (2010) identified a group of faint events, spectroscopically similar to Type Ib/c SNe and displaying prominent calcium lines in the nebular phase. Whether these events constitute a homogeneous class with a common physical explosion mechanism remains unclear, as does the nature of that mechanism (thermonuclear versus core collapse). A core-collapse scenario has been put forward for one of these events, SN 2005cz, in which an 8–12 M⊙ progenitor lost its hydrogen-rich envelope through binary interaction (Kawabata et al. 2010). However, detailed studies at and around the SN location do not reveal evidence of a young stellar population (Perets et al. 2011). The core-collapse scenario for these transients also struggles to explain the large fraction found in early-type host galaxies. An alternative explanation for the small amount of 56Ni synthesized in these explosions is a scenario involving a helium detonation on the surface of an accreting white dwarf (Bildsten et al. 2007; Perets et al. 2010; Shen et al. 2010; Waldman et al. 2011; Sim et al. 2012). Both the core collapse and the thermonuclear models can reproduce qualitatively a large Ca/O line ratio (Kawabata et al. 2010; Waldman et al. 2011), but comprehensive spectral series modelling across the range of observed calcium-rich transients is still lacking.
Several more events were discovered by PTF that share some common properties with this calcium-rich group. In particular, Kasliwal et al. (2012) identified a class of five objects (including two events from Perets et al. 2010) using both photometric and spectroscopic criteria. Interestingly, all these peculiar PTF transients are found at large distances from their host galaxies (Maguire et al. 2011; Sullivan et al. 2011).
No single model so far has successfully reproduced all the observed features of the peculiar ‘calcium-rich’ transients. In this paper, we take an alternative, model-independent approach to constrain the properties of their progenitors by statistically comparing their locations to the overall stellar population in their host galaxies. We define our sample selection in Section 2. We quantitatively evaluate the transient locations relative to the stellar mass distribution in Section 3. We compare the observed distribution with theoretical predictions of cosmological simulations in Section 4 and investigate the expected radial distribution of objects associated with globular clusters (GCs) in Section 5. The implications are discussed in Section 6 and we conclude in Section 7.
SAMPLE OF TRANSIENTS
We first consider the collection of five transients selected based on both photometric and spectroscopic properties by Kasliwal et al. (2012). This will be referred to as the K12 sample. This sample includes two events (SN 2005E and SN 2007ke) from Perets et al. (2010), as well as three events selected from a sample of over a thousand transients discovered by PTF in its first two years of operation: PTF09dav, PTF10iuv (aka SN 2010et) and PTF11bij. Compared to typical SNe, the defining characteristics are a moderately faint peak luminosity (absolute R magnitude of ∼−16), relatively fast rise/decay (∼12–15 d), normal photospheric velocity, a quick spectral transition into the nebular phase and nebular spectra dominated by calcium emission.
Another five events (SN 2000ds, 2001co, 2003H, 2003dg and 2003dr) have been spectroscopically selected as peculiar calcium-rich Type Ib/c SNe (Filippenko et al. 2003; Perets et al. 2010). Their photospheric spectra resemble that of typical SNe Ib/c, lacking silicon, hydrogen and sometimes helium lines. Their nebular spectra are dominated by calcium emission. While it is impossible to verify the photometric properties for these objects, there is evidence that they are sub-luminous compared to normal SNe (Perets et al. 2010), and consistent with the objects in the K12 sample. We therefore include them in the ‘calcium-rich’ group to maximize our sample size for statistical study.
All seven events from Perets et al. (2010) were discovered/observed by the Lick Observatory Supernova Search (LOSS; Filippenko et al. 2001). We regard them as a reasonably complete and uniform set, although we will discuss possible selection effects in both the PTF and LOSS samples in Section 6.1. Observations of SN 2005cz, a single event discovered by another group (Kawabata et al. 2010), show it to be a convincing member of the ‘calcium-rich’ class. It is, however, excluded in our study to avoid further complicating the understanding of its selection bias.
We follow Kasliwal et al. (2012) in identifying the host as the nearest galaxy in projected distance at a redshift consistent with the transient. The measured distance between a transient and the centre of its host is thus a lower limit on the real distance.
LOCATIONS COMPARED TO STELLAR MASS
In this section, we compare the distribution of the ‘calcium-rich’ transients with the stellar mass distribution of their host galaxies. We use K-band photometry from the Two Micron All Sky Survey (2MASS) catalogue (Skrutskie et al. 2006) to trace the overall stellar mass.
We analyse images from the 2MASS All-Sky Data Release. For the host of SN 2005E and SN 2007ke, several overlapping images must be stitched together to get good coverage of the target galaxies. We subtract bright stars near the galaxies using the iraf1daophot package. We extract the moments of the galaxy isophotes using SExtractor (Bertin & Arnouts 1996), then use the iraf package ellipse to extract fluxes in elliptical annuli, with the semimajor axis increased in one-pixel increments and a common centroid, ellipticity, and position angle for all annuli fixed at the values obtained from SExtractor. We fit the smooth part of the surface brightness profile between one-half and one Kron radius (2.5 times the first moment radius, Kron 1980) with a Sérsic model (Sérsic 1968), but allow the Sérsic index to vary freely. We integrate the resulting surface brightness profile to estimate the total flux of the galaxy. Fractions of stellar light enclosed by elliptical apertures defined by the transient locations are calculated and listed in Table 1.
Locations of calcium-rich transients in their host galaxies.
| Transient | Host | Host | Host | Host reffa | Distance from | Fraction of mass | Fraction of mass |
|---|---|---|---|---|---|---|---|
| name | typeb | (MK) | (kpc) | host (kpc) | enclosedc | enclosedd | |
| SN 2000ds | NGC 2768 | E | −24.8(−0.1, +0.2) | 6.2 | 3.3 | 0.58(−0.05, +0.11) | 0.43(−0.04, +0.08) |
| SN 2001co | NGC 5559 | SBb | −24.2(−0.1, +0.0) | 5.6 | 6.6 | 0.70(−0.08, +0.02) | 0.77(−0.08, +0.03) |
| SN 2003H | IC 2163 | Sc | −24.6(−0.1, +0.4) | 6.6 | 6.7 | 0.43(−0.04, +0.17) | 0.61(−0.06, +0.23) |
| SN 2003dg | UGC 6934 | Sc | −23.0(−0.2, +0.0) | 4.4 | 1.4 | 0.11(−0.02, +0.00) | 0.26(−0.05, +0.00) |
| SN 2003dr | NGC 5714 | Sc | −22.7(−0.1, +0.0) | 3.8 | 2.5 | 1.00(−0.10, +0.00) | 0.55(−0.06, +0.02) |
| SN 2005E | NGC 1032 | S0/a | −24.3(−0.2, +0.0) | 3.6 | 23.9 | 1.00(−0.04, +0.00) | – |
| SN 2007ke | MCG +07-07-003 | E/S0 | −23.1(−0.1, +0.0) | 0.9 | 8.2 | 1.00(−0.05, +0.00) | – |
| PTF09dav | 2MASX J22465295+2138221 | S? | −23.0(−0.3, +0.0) | 5.5 | 40.7 | 1.00(−0.03, +0.00) | – |
| PTF10iuv | CGCG 170−011 | S? | −23.4(−0.2, +0.0) | 2.6 | 35.6 | 1.00(−0.02, +0.00) | – |
| PTF11bij | IC 3956 | S? | −24.1(−0.1, +0.0) | 3.1 | 34.0 | 1.00(−0.04, +0.00) | – |
aMajor axis of the ellipse enclosing half of the galaxy K-band light.
bClassification from HyperLeda (Paturel et al. 2003).
cEstimated in elliptical apertures defined by the transient locations.
dEstimated in circular apertures defined by the transient locations.
SN 2003H lies between a pair of interacting galaxies. We ignore the brightening on the outskirts of IC 2163 due to contamination from NGC 2207. Nevertheless, it is likely that the local environment has been affected by the interaction and therefore cannot be fully represented by its distance to either galaxy in the pair.
For SN 2007ke, both the transient and the identified host MCG +07-07-003 lie in the bright galaxy NGC 1129. We remove the background light from NGC 1129 by modelling its surface brightness profile in the same way as described above. If NGC 1129 is the host galaxy, the location of SN 2007ke will not be as extreme (within ∼50 per cent of light), but uncertainty in this single event does not change our main conclusions.
If the surface brightness in the host galaxy drops faster (slower) than our model in the outer regions of the galaxy, the fraction of light enclosed by the elliptical isophote passing through the transient’s location will be larger (smaller) than our calculation. We estimate the systematic uncertainty in the surface brightness by considering profiles with Sérsic indices of 0.2 (steep profile) and 4 (flat profile) outside the fitted region.
Fig. 1 shows that the ‘calcium-rich’ transients do not follow the distribution of K-band light, a proxy for the stellar mass, in their host galaxies. Instead, they have a strong preference for remote locations. A Kolmogorov–Smirnov (K–S) test shows that even the limiting case of a flat profile (Sérsic index of 4) is inconsistent at greater than 99 per cent confidence with a scenario in which the transient locations uniformly track the K-band flux.
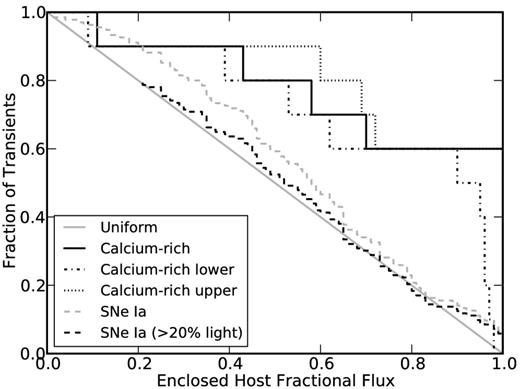
Distribution of ‘calcium-rich’ transients versus enclosed fractional galaxy K-band light. The upper and lower limits are derived by fixing the galaxy Sérsic index to 0.2 and 4, respectively (see the text). The grey line shows the expectation if the transients follow the light distribution. The grey and dark dashed histograms represent, respectively, SNe Ia and SNe Ia found outside 20 per cent K-band light.
For comparison, we also estimate the fraction of K-band light enclosed by isophotes passing through the locations of 135 SNe Ia in early-type hosts discovered between 1990 January and 2011 September. The SN types, coordinates and host galaxy identifications were obtained from the IAU Central Bureau for Astronomical Telegrams (CBAT) website.2 An SN Ia is included in the sample if its host galaxy has a morphology type of E, S0 or SA0 as classified in the NASA/IPAC Extragalactic Database (NED)3 and has a redshift below 0.07. Our full SN Ia sample shows a deficit in the inner region of galaxies. To determine whether this reflects a true deficiency in the underlying distribution, we need to know the search efficiency as a function of projected galactocentric distance, especially for small distances. This factor is hard to determine precisely, since our sample is not drawn from a single survey with a well-understood selection function. We can proceed by making the reasonable assumption that the discovery efficiency drops towards the bright core of galaxy due to low contrast or blending, but is relatively flat outside 20 per cent of stellar light. If we only include SNe Ia found outside 20 per cent of stellar light (and assume 20 per cent of events are cut by this criteria), the remaining SNe Ia track the light well, as seen in Fig. 1. This agrees with the result found in r-band by Förster & Schawinski (2008), although K-band is a better tracer of mass than r-band (Rix & Rieke 1993). The decreased efficiency near galaxy centres has a minimal impact on our results regarding the ‘calcium-rich’ sample.
Using a different fractional flux measurement, Kelly, Kirshner & Pahre (2008) have shown that SNe Ia and SNe II follow the distribution of g′-band light while SN Ic and long GRBs are concentrated in the brightest regions of their hosts (Fruchter et al. 2006). The ‘calcium-rich’ transients appear to be distributed differently with respect to host galaxy light from any of these samples.
METALLICITY AND AGE CONSTRAINTS
We now translate the distribution of the ‘calcium-rich’ transients with respect to host galaxy surface brightness into constraints on the age and metallicity of their progenitors.
Galaxies are complex systems, often containing multiple stellar populations each with a different age and metallicity. Central or average metallicities of host galaxies can be quite different from local metallicities at the SN sites. Attempting to extrapolate the metallicity from the bright centre of a galaxy to its outskirts, where most of our events are located, is also dangerous since there is a large scatter in the gradient–mass relation (Spolaor et al. 2010). If the progenitors are very old, they may also have travelled far from the original formation site by the time of explosion, so the local metallicity may not give an accurate estimate of the progenitor metallicity. Finally, there is a significant scatter in the metallicity distribution function at a given radius, i.e. there are some metal-poor stars in the centre and metal-rich stars in the outskirts of galaxies. To take all of these effects into account, we statistically compare the distribution of projected galactocentric distances in our sample with the predicted distribution of stars with known metallicity in self-consistent cosmological simulations.
The simulations used in this comparison include the relevant physics such as hydrodynamics, star formation, SN feedback and chemical enrichment, the details of which are described in Kobayashi, Springel & White (2007). Here, we use a new simulation run with a resolution of 5 × 10⁶ M⊙, Wilkinson Microwave Anisotropy Probe-5 (WMAP-5) cosmology and the Kroupa initial mass function (Kroupa 2001). A star formation parameter c = 0.02 and number of feedback neighbours (NFB = 576) are used in order to match the observed cosmic star formation rate history and the mass–metallicity relations of galaxies. Metallicities, elemental abundances, ages and positions of stars are recorded for analysis. Collections of particles in the simulation are identified as galaxies with the friend-of-friends method.
We define metallicity as the logarithm of the mass fraction of elements heavier than helium compared to that of the Sun ([M/H]). From the simulations, we calculate the metallicity distributions as a function of projected enclosed stellar mass within host galaxies. We use circular apertures, since the mass distributions are approximately spherical in the outer regions of galaxies. We integrate the stellar masses along the line of sight since the observational data are measured in projected radii. To be consistent with the simulations, we remeasure the enclosed K-band flux of our peculiar events in circular apertures. In cases where the transient is too far from the host to accurately determine the enclosed flux, we use the flux ratios from the previous section (see Table 1). We expect the choice of aperture shape to have a minimal effect on our results.
The observed K-band total luminosities (LK) of the host galaxies are converted to stellar masses for comparison with simulations. M/LK values of 0.8, 0.7 and 0.5 are used for E/S0, S0a/b and Sbc/d type galaxies, respectively (Bell & de Jong 2001) and M/LK of 0.5 is used for the three hosts of unknown type. The resulting mass range is about 1.2 × 10¹⁰–1.4 × 10¹¹ M⊙, and therefore, we select the galaxies in the simulation whose total stellar masses fall in the range 1 × 10¹⁰ –1 × 10¹¹ M⊙. Note that the result does not change qualitatively if a wider range of galaxies is included, as the stellar mass distribution peaks within the selected host mass range.
Fig. 2 shows the distribution of ‘calcium-rich’ transients compared to the stellar distribution for different metallicity ranges inferred from our simulations. In general, the ‘calcium-rich’ transients lie further away from the host than stars of [M/H] ≲ −0.5, consistent with a relatively low-metallicity origin.
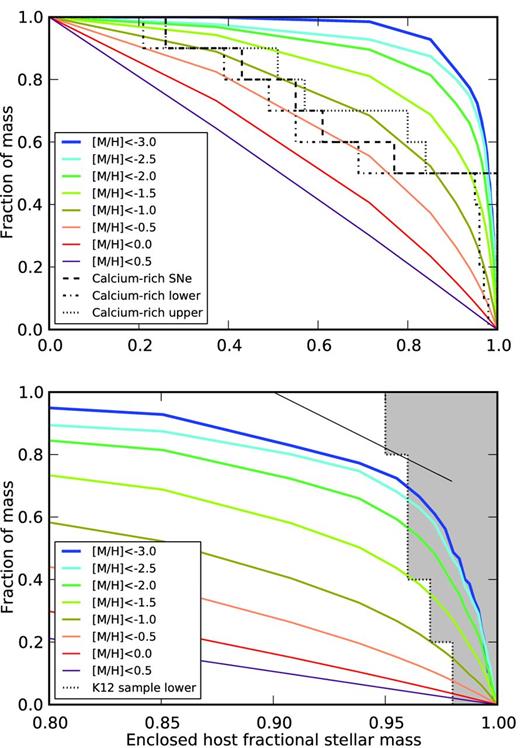
Observed distribution of the peculiar transients compared to those of stars of different metallicity within galaxies as predicted by our simulation. The full sample is shown in the top panel. In the bottom panel, the shaded area represents the contour for the K12 sample. Note that in the bottom panel, the x-axis range is zoomed in by a factor of 5 to enable the reader to distinguish visually between curves corresponding to different models.
If only the five events in the K12 sample are considered, the distribution is skewed further from the host and is completely different than any of our stellar metallicity curves in Fig. 2. One way to resolve the discrepancy is to introduce an age limit on the stellar population. In the cold dark matter (CDM) picture, old stars form in small galaxies, which successively merge to form a large galaxy. Old stars that formed in a deep potential well tend to be located in the galactic bulge at present, and the chemical enrichment time-scale is so short that the metallicities of the majority of such old stars are not very low. On the other hand, old stars that formed in a shallow potential well, whose parent galaxy/cluster is disrupted, tend to be located in the outer halo at present, where no young stars form.
Our sample does not have the statistical power to constrain the age. For illustrative purpose, we set a cut-off age of 10 Gyr, corresponding to the lifetime of a star with zero main-sequence mass of about 1 M⊙. If we only trace stars that are older than 10 Gyr in our simulation, a dominant fraction of the metal-poor population is found at large distances from the galaxy centres. As can be seen in the bottom panel of Fig. 3, even at this old age, the curve that comes close to the K12 sample has extremely low metallicity ([M/H] ≲ −3).
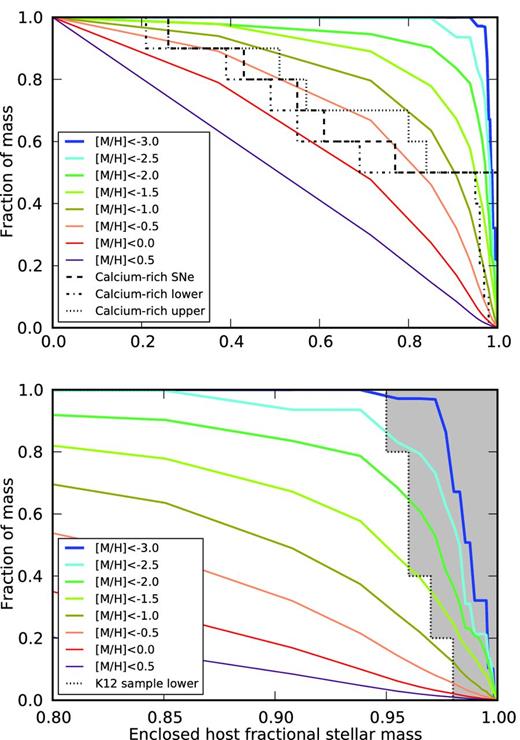
Observed distribution of the peculiar transients compared to those of the stars of different metallicity and older than 10 Gyr within galaxies as predicted by our simulation. The full sample is shown in the top panel. In the bottom panel, the shaded area represents the contour for the K12 sample. As in Fig. 2, in the bottom panel the x-axis range is zoomed in by a factor of 5 to enable the reader to distinguish visually between curves corresponding to different models.
CORRELATION WITH GLOBULAR CLUSTERS
Another possibility leading to such large offset for classes of objects is if they are associated with GCs. GCs are detected throughout the extended haloes of galaxies (sometimes over 100 kpc away from the centre, Brodie & Strader 2006). The high stellar densities in GCs lead to an enhanced rate of close binaries and unusual objects, which could provide unique channels for exotic transients. In this section, we test whether the progenitor population could be correlated with GC systems.
Direct photometric observations have failed to detect GCs of typical brightness at the sites of some of our nearby events. For SN 2000ds, Hubble Space Telescope imaging revealed no progenitor brighter than MV ∼ −5.5 (Van Dyk, Li & Filippenko 2003), ruling out an association with a typical GC at MV ∼ −7. For SN 2005cz, a likely ‘calcium-rich’ member that is not included in our statistical study, a non-detection down to MV ∼ −6.9 was obtained (Perets et al. 2011). This turns into a fairly restrictive limit, particularly considering that brighter GCs tend to be more massive and more centrally concentrated (cf. McLaughlin 2000) and thus more likely to harbour unusual objects. Because the calcium-rich class is still poorly defined, and there exists potentially other large-offset transient populations (e.g. PTF10ops) we, despite these photometric limits, carry out the following comparison. This analysis should be useful for further studies where observations of comparable absolute depth are not achievable for more distant SNe. The method described can also be generalized and applied to statistical studies of other transient classes which currently have too few members for study.
For each host, we attempt to model the GC profile and calculate the fraction of GCs within (or outside) the transient location, as we did for the stellar light in Section 3. The projected radial distribution of GCs in a galaxy is often described by a power law, with slopes between ∼−2.5 and ∼−1.5 (Brodie & Strader 2006, and references therein). More luminous galaxies tend to have shallower profiles while no obvious trend is found with galaxy type (Harris 1986). This luminosity–slope relation is at least partly related to the fact that brighter galaxies are often larger in their physical extent.
Since the GC radial distribution tends to flatten at the centre of a galaxy, we describe the GC-projected surface density at radius r as ρ0(1 + (r/rc)−α)−1. The core size rc is derived using the relation illustrated in fig. 10 of Forbes et al. (1996). The slope α is estimated with equation 11 in Harris (1986). Integrated V-band magnitudes of the galaxies are obtained from the NED data base or converted from SDSS g and r model magnitudes. For three hosts without V-band or SDSS photometry, we assume (V − K) = 3.2 mag (the median for the other seven galaxies). We also apply a realistic but somewhat arbitrary cut-off for the GC population extent of 120 kpc. The projected distance between a transient and the centre of its apparent host is derived using the angular separation and the cosmic microwave background (CMB) rest-frame distance in the NED data base, assuming H0 = 70 km s−1 Mpc−1, Ωm = 0.27 and ΩΛ = 0.73. The resulting distribution is shown in Fig. 4. While the histogram seems to suggest that the ‘calcium-rich’ transients may have a slightly flatter distribution than the GCs at the inner regions of the galaxies, the discrepancy is not statistically significant. We show that the result is not very sensitive to the choice of cut-off distance as all of our transients lie within 50 kpc. On the other hand, we see a stronger dependence on the core sizes. Given the many uncertainties in our GC profile estimate, we can only conclude that we do not rule out the possibility that ‘calcium-rich’ transients originate in GCs.
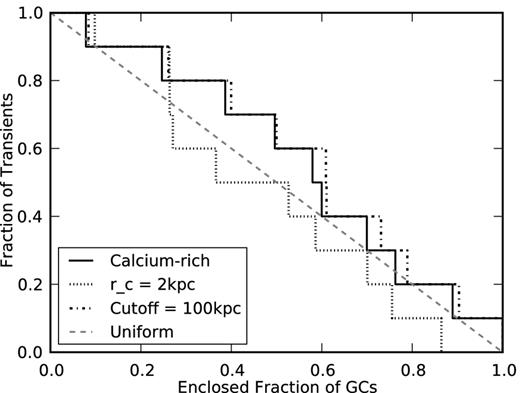
Cumulative distribution of ‘calcium-rich’ transients as a function of enclosed fraction of GCs. The dashed line shows the expectation if the transients follow the GC distribution. The dotted line is for a fixed GC profile core size of 2 kpc and the dash–dotted line is for a cut-off of GC extent at 100 kpc.
The number of GCs per unit stellar mass increases with decreasing galaxy mass at low masses (Miller & Lotz 2007). This trend, combined with the galaxy stellar mass function (e.g. from Baldry et al. 2012), means that a significant fraction of GCs exist in relatively faint/small galaxies. Unfortunately, seven of our 10 SNe were discovered in the LOSS survey, which targets large nearby galaxies and which may under-represent low surface brightness hosts (Leaman et al. 2011). The tight distribution of K-band magnitudes of the identified hosts roughly agree with the typical luminosity of a LOSS galaxy. For a GC-related sample collected entirely through untargeted surveys in future, we would expect to see a wider range of host masses/luminosities.
DISCUSSION
Sample Bias
Although the PTF ‘calcium-rich’ transients all occurred far from the centres of their respective host galaxies, this is not a selection criterion for the class. The survey strategy can potentially introduce a bias, but PTF regularly discovers SNe at a range of galactocentric distances, suggesting that selection bias is not primarily responsible for the observed locations of the ‘calcium-rich’ transients. On the other hand, the targeted LOSS survey imposes a bias in their sample against objects lying far away from any bright host. By simply combining events from PTF and LOSS, we run the risk of mixing two samples drawn from different populations. A larger sample drawn from ongoing and future untargeted surveys will improve the situation. For now, we try to verify that each of our sub-samples is statistically consistent with the overall population.
The LOSS survey monitors a predefined nearby galaxy population with the 0.76 m Katzman Automatic Imaging Telescope (KAIT) (Filippenko et al. 2001). We estimate the equivalent scale radii covered by KAIT’s relatively small (6.7 × 6.7 arcmin2) field of view at the distances of the seven LOSS discoveries. For the two (four) nearest events, this value is less than 30 (40) kpc. KAIT may therefore have missed transients with separations from their host galaxy larger than this.
If the three events from PTF are drawn from the distribution of all 10 ‘calcium-rich’ transients, we expect another one (two) events detected inside about 50 per cent (70 per cent) stellar mass. Recognizing a low luminosity ‘gap’ transient near the bright core of a host galaxy can be challenging. For example in the host of PTF10iuv (r = 14.2), a 19th magnitude object would be ∼25 per cent brighter than the underlying host at around 70 per cent stellar mass. However, the number of transients potentially missed is still roughly consistent with fluctuations from Poisson statistics given the small sample size.
Implications
A metallicity effect remains an appealing explanation for the large offsets of the ‘calcium-rich’ transients. In either a thermonuclear or a core-collapse model, metallicity can affect the evolution of a progenitor star, impacting on its age, structure and chemical composition at the time of explosion. For example, production of a normal SN Ia (in a single-degenerate scenario) is inhibited at low metallicity, if the wind from the accreting white dwarf is not strong enough to stabilize the mass transfer (Kobayashi et al. 1998). Perhaps an exotic sub-luminous explosion can occur under these circumstances. In the case of a massive star, wind-driven mass-loss is closely related to metallicity. At lower metallicity, the mass-loss becomes weaker and a larger helium core is retained, which may form a black hole directly, resulting in a faint SN (Kobayashi, Tominaga & Nomoto 2011) or no explosion (Heger et al. 2003).
Moreover, the extreme cases of ‘calcium-rich’ transients (the K12 sample) seem to lie further away from the host than the region where metallicity falls steeply. An additional parameter may be needed to interpret this distribution. While we cannot strongly constrain the age with our sample, our simulation show that extremely metal-poor stars older than 10 Gyr are expected to be predominantly found at the same distant locations in galaxies as the K12 transients. This trend also argues strongly against any massive star origin. This conclusion is consistent with the fact that some of the hosts are early-type galaxies without evidence for recent star formation.
We also investigated if these peculiar transients could be associated with GC systems, which often have a more extended spatial distribution than stellar light. In Section 5, we showed that the radial distribution of the ‘calcium-rich’ transients is consistent with the GC distributions. However, deep photometric observations argue otherwise and the discussed sample is not likely to originate from GCs. The GC connection may be more relevant for transients with suspected binary progenitors (Pfahl, Scannapieco & Bildsten 2009), such as PTF10ops (Maguire et al. 2011). One possible interpretation for this unusual sub-luminous SN Ia is that it arises from the merger of two equal-mass white dwarfs (Pakmor et al. 2010). Sufficiently violent mergers might preferentially occur in the dynamical environment of GCs where non-sychronized and/or eccentric binaries could be more common. Alternatively, Rosswog et al. (2009) have shown that the rate of collision-induced thermonuclear explosions is significantly enhanced in the dense cores of GCs.
Finally, it is worth noting that the classification in Kasliwal et al. (2012) allows for a diversity in the photospheric phase. The spectra of PTF09dav show similarities to those of SNe Ia, but the rest of the sample are better matched to SNe Ib/c. In the nebular phase, differences exist in the detection of oxygen emission. Nevertheless, their observed features imply comparable ejecta mass and energy release. If the ‘calcium-rich’ transients are produced by one explosion channel, the model has to be able to account for this range of behaviour.
CONCLUSIONS
We have carried out a statistical study of the locations of ‘calcium-rich’ transients within host galaxies to look for clues of progenitor properties. In particular, this class shows strong preference for large offsets from their apparent host galaxies, and do not follow the stellar mass distribution within galaxies as approximated by K-band light. For these outlying transients, direct measurement of properties of the local stellar population is impossible, due to low surface brightness. Extrapolations to such large distances are also problematic, as significant uncertainties are involved. For our study, we choose to utilize self-consistent cosmological simulations. We show that as a group, the ‘calcium-rich’ transient locations are consistent with relatively metal-poor progenitors ([M/H] ≲ −0.5).
The sample selected in Kasliwal et al. (2012) includes the most extreme cases. It is not clear at the moment whether this is related to some selection bias, or sub-groups within the overall ‘calcium-rich’ class. If these extreme cases are representative of a distinct class of explosions, their remote locations may imply a combination of low metallicity and old progenitor age. Events related to massive young stars are consequently disfavoured.
The radial distribution of the ‘calcium-rich’ transients is nominally consistent with the GC distributions. However, deep non-detection limits of the progenitors, in the few cases where they are available, disfavour an association of the progenitors with GCs.
We expect ongoing and future surveys to generate a larger sample of transients for statistical studies like our own, including multiple instances of newly discovered rare types of transient events (e.g. PTF10ops). Our method may also be used to quantify the dependence of the properties of normal core-collapse SNe on the metallicity of their progenitors.
This research was conducted by the Australian Research Council Centre of Excellence for All-sky Astrophysics (CAASTRO), through project number CE110001020 and through LF0992131. This research has made use of the NASA/IPAC Extragalactic Database (NED) which is operated by the Jet Propulsion Laboratory, California Institute of Technology, under contract with the National Aeronautics and Space Administration. We acknowledge use of the HyperLeda data base (http://leda.univ-lyon1.fr). This publication makes use of data products from the Two Micron All Sky Survey, which is a joint project of the University of Massachusetts and the Infrared Processing and Analysis Center/California Institute of Technology, funded by the National Aeronautics and Space Administration and the National Science Foundation.
iraf is distributed by the National Optical Astronomy Observatories, which are operated by the Association of Universities for Research in Astronomy, Inc., under cooperative agreement with the National Science Foundation.
