


Abstract
We report on multiwavelength observations of the blazar PKS 0537−441 (z = 0.896) obtained from microwaves through γ-rays by Submillimeter Array, Rapid Eye Mounting, Automatic Telescope for Optical Monitoring (ATOM), Swift and Fermi mostly during 2008 August–2010 April. Strong variability has been observed in γ-rays, with two major flaring episodes (2009 July and 2010 March) and a harder-when-brighter behaviour, quite common for flat spectrum radio quasars and low-synchrotron-peaked BL Lacertae objects (BL Lacs), in 2010 March. In the same way, the spectral energy distribution (SED) of the source cannot be modelled by a simple synchrotron self-Compton model, as opposed to many BL Lacs, but the addition of an external Compton component of seed photons from a dust torus is needed. The 230 GHz light curve showed an increase simultaneous with the γ-ray one, indicating co-spatiality of the mm and γ-ray emission region likely at large distance from the central engine. The low, average, and high activity SED of the source could be fit changing only the electron distribution parameters, but two breaks in the electron distribution are necessary. The ensuing extra spectral break, located at near-infrared (NIR)–optical frequencies, together with that in γ-rays seem to indicate a common origin, most likely due to an intrinsic feature in the underlying electron distribution. An overall correlation between the γ-ray band with the R band and K band has been observed with no significant time lag. On the other hand, when inspecting the light curves on short time-scales some differences are evident. In particular, flaring activity has been detected in NIR and optical bands with no evident γ-ray counterparts in 2009 September and November. Moderate variability has been observed in X-rays with no correlation between flux and photon index. An increase of the detected X-ray flux with no counterpart at the other wavelengths has been observed in 2008 October, suggesting once more a complex correlation between the emission at different energy bands.
1 INTRODUCTION
PKS 0537−441 (also known as HB89 0537−441, RX J0538.8−4405) was selected as a quasi-stellar source in the Parkes 2700 MHz radio survey (Peterson et al. 1976) and identified as a blazar by Burbidge & Hewitt (1992). According to its spectral energy distribution (SED), the source was classified as a BL Lac object, categorized as a low-energy-peaked BL Lac by Padovani & Giommi (1995), although the determination of the redshift of this source is based on broad emission lines and the object has been listed as a highly polarized quasar (Ledden & Odell 1985; Sambruna et al. 1994), having radio polarization up to 3 per cent (Komesaroff et al. 1984) and optical polarization up to 18 per cent (Impey & Tapia 1988, 1990). PKS 0537−441 has also been suggested to be a transition object between classical BL Lac objects and violently variable and highly polarized quasars (Cristiani 1985; Maraschi et al. 1985; Treves et al. 1993; Giommi, Ansari & Micol 1995; Ghisellini et al. 2011).
Two broad emission lines at 3617 Å and 5304 Å were observed in the optical spectrum of PKS 0537−441, and proposed to correspond to the C iii] λ1909 and MgII λ2798 lines, placing the object at a redshift z = 0.894 (Peterson et al. 1976; Wilkes et al. 1983; Stickel, Fried & Kuhr 1993). Subsequently, Lewis & Ibata (2000) reported a redshift of z = 0.892 ± 0.001, based on the Balmer line series and the [O iii] emission line. PKS 0537−441 was also observed by the Faint Object Spectrograph (FOS) of the Hubble Space Telescope (HST) in 1993 July and September and, on the basis of their measured central wavelengths, the emission lines detected in the HST FOS spectra were identified by Pian, Falomo & Treves (2005) with Lyα, Si iv and C iv at z = 0.896 ± 0.001, a value consistent with the original redshift determination by Peterson et al. (1976). Based on a claimed detection of a galaxy along the line of sight to PKS 0537−441, it was discussed as a case of gravitational lensing (Stickel, Fred & Kuhr 1988; Lewis & Ibata 2000), in which a foreground galaxy lenses the radiation from the quasar, amplifying the continuum with respect to the line emission, but further observations reported in Falomo, Melnick & Tanzi (1992), Pian et al. (2002), Heidt et al. (2003) have not confirmed the presence of a foreground galaxy.
Given its apparent brightness, PKS 0537−441 is an excellent target for studying the properties of blazars and therefore it has been the subject of several monitoring campaigns from radio to optical, showing remarkable variability. Peterson & Bolton (1972), who found Quasi Stellar Objects (QSOs) among the Parkes radio sources, discovered the optical counterpart of the radio source PKS 0537−441 to be 2 mag brighter than that on the Palomar Observatory Sky Survey. Subsequent observations by Eggen (1973) showed a variation between magnitude 16.5 and 13.7 over a few months. The study of the Harvard Observatory photographic plate collection (Liller 1974) over almost a century revealed long-term variations of ∼5 mag with fluctuations of ∼2 mag over less than 2 months. In addition, this source displayed intraday variability at radio (Romero, Surpi & Vucetich 1995) and optical frequencies (Heidt & Wagner 1996; Romero et al. 2002). Although PKS 0537−441 is one of the brightest radio selected BL Lac objects (Stickel et al. 1991) it is a relatively weak X-ray source (Tanzi et al. 1986; Worral & Wilkes 1990), even if the comparison of the ROSAT X-ray spectrum with the Einstein and EXOSAT observations indicates substantial variability both in intensity and spectral slope at X-rays (Treves et al. 1993, and the reference therein). BeppoSAX in 1998 November observed the source with a spectrum and emission state consistent with those measured by EXOSAT and Einstein, but with a flux at 1 keV almost a factor of 2 less than that detected by ROSAT in 1991. Moreover, the BeppoSAX spectrum suggests that a single emission component dominates in the energy range 0.1–30 keV (Pian et al. 2002).
Previous multifrequency observations from NIR to X-rays (Maraschi et al. 1985; Tanzi et al. 1986) showed quasi-simultaneous flares at IR, optical and X-ray frequencies. Its continuum variations throughout the entire electromagnetic spectrum have been discussed in detail by Pian et al. (2002). In 2005 PKS 0537−441 was monitored in the optical and IR by Rapid Eye Mounting (REM; Dolcini et al. 2005) and observed by all the instruments on board Swift in January, July and November (Pian et al. 2007), with a flux that varied by a factor of ∼60 and ∼4 in optical and X-rays, respectively. The V band and X-ray light curves measured in 2004–2005 were highly correlated, although with different variation amplitudes. In contrast, no clear evidence of variability within a single night was found, even though some hints of small flares on day time-scales may be present. Moreover, the X-ray photon index was observed to be steady over the different epochs, as opposed to the variation of the fluxes. The optical spectra collected at different epochs suggest the presence of thermal emission during the low states. Only recently, Impiombato et al. (2011) identified an episode of rapid variability in the J band with a duration of ∼25 min.
PKS 0537−441 was detected in γ-rays as 3EG J0540−4402 by the EGRET telescope on board the Compton Gamma-Ray Observatory (Hartman et al. 1999). The source was detected by EGRET for the first time in 1991 (Michelson et al. 1992; Thompson et al. 1993) and then re-observed at many successive epochs in different states (see also Treves et al. 1993), showing bright and variable emission in γ-rays, with a maximum flux of 9 × 10⁻⁷ photons cm−2 s−1 during 1995 January and a peak with the temporal binning of 2 d of (20 ± 5) × 10−7 photons cm−2 s−1 (Pian et al. 2002). More recently intense γ-ray activity from this source was observed by the Large Area Telescope (LAT) on board Fermi (Tosti 2008; Bastieri 2009; Cannon 2010) and AGILE Gamma-Ray Imaging Detector (AGILE-GRID) (Lucarelli et al. 2010). PKS 0537−441 was listed in both the first and second Fermi––LAT source catalogues (Abdo et al. 2010b; Nolan et al. 2012).
Now the Fermi satellite, with continuous monitoring of the entire γ-ray sky and the excellent sensitivity of the LAT, gives us the opportunity to study the blazars in the γ-ray band not only during flaring states but also during low activity states, broadening correlated investigations of blazars over the whole electromagnetic spectrum. In this context, the Swift satellite, with broad-band coverage and scheduling flexibility creates a perfect synergy with Fermi and provide crucial data in the gap in coverage between the γ-ray data and the radio-to-optical data obtained from ground-based telescopes allowing a deep and complete long-term monitoring of these sources.
In this paper, we report the results of the LAT monitoring of PKS 0537−441 together with the related multiwavelength observations across the electromagnetic spectrum. This paper is organized as follows. In Section 2, we present LAT data and analysis. In Section 3, we present the multifrequency data collected by Swift, REM, ATOM and Submillimeter Array (SMA). In Section 4, we discuss the γ-ray spectral and flux variability, while the correlation with the other energy bands is discussed in Section 5. The general properties of the source and a comparison of the multifrequency data reported in this paper with respect to past observations are discussed in Section 6. In Section 7, we discuss the SED modelling for different epochs. Finally in Section 8 we draw our conclusions.
In the following we use a Λ cold dark matter (ΛCDM) (concordance) cosmology with values given within 1σ of the Wilkinson Microwave Anisotropy Probe results (Komatsu et al. 2009), namely h = 0.71, Ωm = 0.27 and ΩΛ = 0.73, and a Hubble constant value H0 = 100 h km s−1 Mpc−1, with the corresponding luminosity distance dL ≃ 5.78 Gpc (∼1.8 × 1028 cm).
2 LAT OBSERVATIONS
The Fermi–LAT is a pair-conversion γ-ray detector, sensitive to photon energies from about 20 MeV to >300 GeV. It consists of a tracker (composed of two sections, front and back, with different capabilities), a calorimeter and an anticoincidence system to reject the charged-particle background. The LAT has a large-peak effective area (∼8000 cm2 for 1 GeV photons in the event class considered here), viewing ≈2.4 sr of the sky with single-photon angular resolution (68 per cent containment radius) of 0|${^{\circ}_{.}}$|6 at E = 1 GeV on-axis (Atwood et al. 2009).
The data presented in this paper were collected in the first 20 months of Fermi science operation, from 2008 August 4 to 2010 April 4 (∼600 d, from MJD 546 82 to 552 91). The analysis was performed with the standard Fermi–LAT science tools software package1 (version v9r15p6). Only events having the highest probability of being photons, belonging to the ‘Diffuse’ class, in the energy range 0.1–100 GeV were used in the analysis. The instrument response functions p6_v3_diffuse were used. In order to avoid significant background contamination from Earth limb γ-rays, all events with zenith angle >105° were excluded. In addition only photons detected when the spacecraft rocking angle was <52° were selected. This eliminated time intervals with the Earth in the LAT field of view.
The LAT light curves were computed using the maximum-likelihood algorithm implemented in gtlike. The 20-month light curve was built using 3-d time bins (Fig. 1, upper panel); for each time bin integrated flux, photon index and test statistic (TS)2 values were determined. For each time bin, we selected photons included in a region of interest (RoI) of 12° in radius, centred on the position of the source. In the RoI analysis, the source is modelled with a power law, dN/dE = (N(Γ + 1)E− Γ)/(E|${^{\Gamma + 1}_{\rm max}}$| − EminΓ + 1), where N is the normalization, Γ is the photon index, Emin and Emax are the limits of the energy interval chosen for the likelihood analysis.
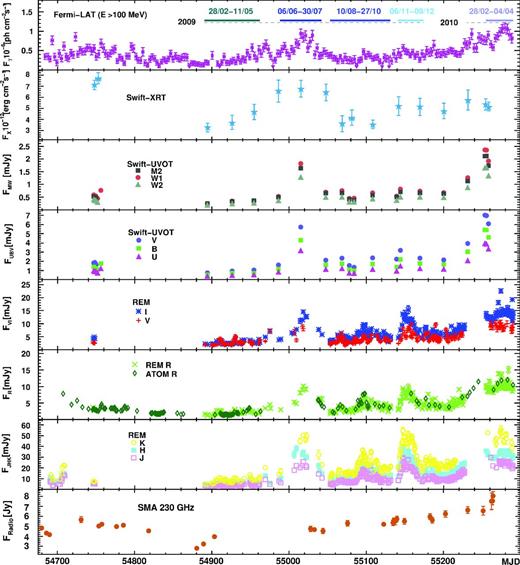
Multifrequency light curve for PKS 0537−441. The period covered is 2008 August 4 – 2010 April 4. The data sets were collected (from top to bottom) by Fermi–LAT (γ-rays), Swift–XRT (0.3–10 keV), Swift–UVOT (W1, M2, W2 and V, B, U filters), REM (V and I bands), REM and ATOM (R band), REM (J, H, K bands), and SMA (230 GHz). The solid lines in the top panel represent the time intervals used in the LAT spectra extraction.
All point sources listed in the First Fermi LAT catalog (1FGL; Abdo et al. 2010a) LAT catalogue (Abdo et al. 2010a) within 19° from PKS 0537−441 with TS >50 and fluxes above 10−8 ph cm−2 s−1 were included in the RoI model using a power-law spectrum. The background model used to extract the γ-ray signal includes a Galactic diffuse emission component and an isotropic component. The Galactic component is parametrized by the map cube file gll_iem_v02.fit. The isotropic background component, which is the sum of residual instrumental background and extragalactic diffuse γ-ray background, was included in the ROI model using the standard model file isotropic_iem_v02.txt.3 In the light-curve computation the photon index value was frozen to the value obtained from the likelihood analysis over the entire period. For each time bin, if the TS value for the source was less than four or the number of model predicted photons Npred < 10, a 2σ upper limit was computed for the flux. The estimated relative systematic uncertainty on the γ-ray flux, which according to Abdo et al. (2010b) reflects the relative systematic uncertainty on effective area, is 10 per cent at 100 MeV, 5 per cent at 500 MeV and 20 per cent at 10 GeV. All errors reported throughout the paper are statistical only.
3 THE MULTIFREQUENCY COVERAGE
The monitoring of PKS 0537−441 by Swift ranged from optical to X-ray bands and was supplemented by data collected in NIR and optical bands by REM and ATOM, as well as sub-mm by SMA. This provided excellent broad-band coverage.
3.1 Swift
The Swift satellite (Gehrels et al. 2004) performed several observations of PKS 0537−441 between 2008 October 7 and 2010 March 4, with all three onboard experiments: the X-ray Telescope (XRT; Burrows et al. 2005), the Ultraviolet/Optical Telescope (UVOT; Roming et al. 2005) and the coded-mask Burst Alert Telescope (BAT; Barthelmy et al. 2005). These observations were obtained both by means of dedicated Target of Opportunities (ToOs) and by activating a monthly monitoring program (PI: F. D’Ammando) covering the period 2009 March–2010 February.
3.1.1 Swift/BAT
The Burst Alert Telescope on board the Swift satellite is a coded-mask telescope operating in the 15–200 keV energy range. Thanks to its large field of view, BAT surveys up to 80 per cent of the sky every day. We selected all observations with PKS 0537−441 in the BAT field of view, between 2004 November and 2009 August. The data were processed using heasoft package (v.6.8) and following the recipes presented in Ajello et al. (2009). The spectrum of PKS 0537−441 was extracted using the method presented in Ajello et al. (2008).
3.1.2 Swift/XRT
The XRT data were processed with standard procedures (xrtpipeline v0.12.6), filtering and screening criteria by using the heasoft package (v.6.11). The source count rate was low during the whole campaign (mean count rate <0.5 counts s−1), so we considered only photon counting (PC) data and further selected XRT event grades 0–12. Pile-up correction was not required. Source events were extracted from a circular region with 20-pixel radius (1 pixel ∼2.36 arcsec), while background events were extracted from an annular region centred on the source and with radii of 55 and 95 pixels. Ancillary response files were generated with xrtmkarf, and account for different extraction regions, vignetting and PSF corrections.
A spectrum was extracted from each observation and fitted with xspec (v12.7.0) adopting an absorbed power-law model with free photon index ΓX and using the photoelectric absorption model tbabs with a neutral hydrogen column fixed to its Galactic value (2.9 × 1020 cm−2; Murphy et al. 1996), consistent with Pian et al. (2007). Data were rebinned to have at least 20 counts per energy bin to allow the χ2 minimization.
3.1.3 Swift/UVOT
During the Swift pointings, the UVOT (Poole, Breeveld & Page 2008) instrument observed PKS 0537−441 in the V, B, U and W1, M2 and W2 photometric bands. The analysis was performed using the uvotsource tool to extract counts from a standard 5 arcsec radius source aperture, correcting for coincidence losses, applying background subtraction and calculating the source flux. The background counts were derived from a circular region of 10 arcsec radius in the source neighbourhood. The fluxes were then de-reddened using the values of E(B−V) taken from Schlegel, Finkbeiner & Davis (1998) with A(λ)/E(B−V) ratios calculated for the UVOT filters using the mean interstellar extinction curve from Fitzpatrick (1999).
3.2 REM
The REM (Zerbi et al. 2001; Covino et al. 2004) is a robotic telescope located at the European Southern Observatory (ESO) Cerro La Silla observatory (Chile). The REM telescope has a Ritchey–Chretien configuration with a 60 cm f/2.2 primary and an overall f/8 focal ratio in a fast moving alt-azimuth mount providing two stable Nasmyth focal stations. At one of the two foci, the telescope simultaneously feeds, by means of a dichroic, two cameras: REMIR for the near-infrared (NIR; Conconi et al. 2004) and REM Optical Slitless Spectrograph (ROSS) (Tosti et al. 2004) for the optical. The cameras both have a field of view of 10 arcmin × 10 arcmin and imaging capabilities with the usual NIR (z, J, H and K) and Johnson–Cousins VRI filters. The REM software system (Covino et al. 2004) is able to manage complex observational strategies in a fully autonomous way. All raw optical/NIR frames obtained with REM telescopes were reduced following standard procedures. Instrumental magnitudes were obtained via aperture photometry and absolute calibration has been performed by means of secondary standard stars in the field reported in Hamuy & Maza (1989) or by 2MASS4 objects in the field. The data presented here were obtained during 2008 August–2010 April by a Guest Observer programme for announcement of observing time AOT18 (PI: D. Impiombato) and AOT19 (PI: F. D’Ammando) and a long-term project for AOT20 and AOT21 (PI: F. D’Ammando).
3.3 ATOM
Optical observations in the Johnson R filter for this campaign were obtained between 2008 August and 2010 April with the 0.8-m optical telescope ATOM in Namibia (Hauser et al. 2004). ATOM is operated robotically by the High Energy Stereoscopic System (H.E.S.S.) collaboration and obtains automatic observations of confirmed or potentially γ-bright blazars. Data analysis (debiassing, flat fielding and photometry with Source-Extractor, Bertin & Arnouts 1996) is conducted automatically using our own pipeline. For differential photometry, the reference stars 2, 3 and 6 from Hamuy & Maza (1989) were used.
3.4 SMA
The 230 GHz (1.3 mm) light curve was obtained at the SMA on Mauna Kea (Hawaii) from 2008 August 1 to 2010 March 9. PKS 0537−441 is included in an ongoing monitoring programme at the SMA to determine the fluxes of compact extragalactic radio sources that can be used as calibrators at mm wavelengths. Details of the observations and data reduction can be found in Gurwell et al. (2007). Data from this programme are updated regularly and are available at SMA website.5 Additional SMA data are from a programme led by A. Wehrle6 to monitor fluxes of blazars on the Fermi—LAT Monitored Source List.7
4 γ-RAY SPECTRAL AND TEMPORAL VARIABILITY
4.1 Spectral behaviour
The γ-ray spectral analysis of PKS 0537−441 was performed both for the first 20 months (2008 August 4 – 2010 April 4; MJD 546 82–552 90) of Fermi–LAT observations, and for five sub-periods: period 1 (2009 February 28–May 11; MJD 548 90–549 62), period 2 (2009 June 6–July 30; MJD 549 88–550 42), period 3 (2009 August 10–October 27; MJD 550 53–551 31), period 4 (2009 November 6–December 9; MJD 551 41–551 74) and period 5 (2010 February 28–April 4; MJD 552 55–552 90). The sub-periods, reported also in Fig. 1, have been chosen for selecting different activity states in γ-rays. The results are reported in Table 1. A hardening of the γ-ray spectrum has been observed during period 5, which corresponds to the highest activity state. This ‘harder-when-brighter’ behaviour was already reported in other bright flat spectrum radio quasars (FSRQs) and low-synchrotron-peaked (LSP) BL Lacs (Abdo et al. 2010d), even if only moderate variation (ΔΓ < 0.3) has been observed. By contrast, we noted that during period 2 no hardening of the spectrum of PKS 0537−441 has been observed despite the high flux, indicating that the ‘harder-when-brighter’ effect is not detected in all high activity periods of the source. The difference could be due to different causes or locations of the different flares. We noted that a ‘harder-when-brighter’ trend is not a universal behaviour in blazar γ-ray flares. For example, in 3C 454.3, there is only very weak evidence of a ‘harder-when-brighter’ trend (Ackermann et al. 2010; Abdo et al. 2011) and there is no evidence for significant correlation between γ-ray flux and photon index in 3C 279 (Hayashida et al. 2012). The 20-month spectrum is shown in Fig. 2. The energy spectrum was built by dividing the whole energy range (0.1–100 GeV) into bands, requiring TS > 50 and/or more than eight photons predicted by the maximum likelihood source for each bin except for the last one. This results in 14 energy bins and one upper limit for the 20-month spectrum, and three bins and one upper limit for the five spectra in the sub-periods. For each energy bin a maximum likelihood analysis, fixing the spectral index at the respective global likelihood values computed in the entire 0.1–100 GeV energy range, was performed.
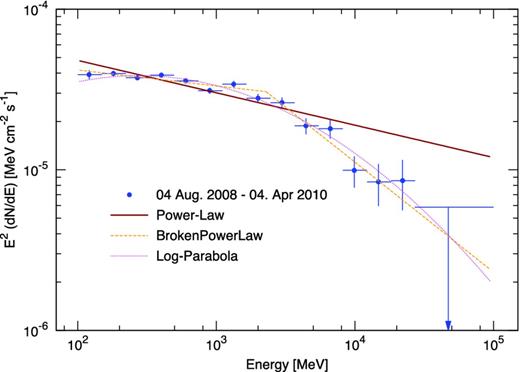
20-month γ-ray spectrum of PKS 0537−441 measured by Fermi–LAT between 2008 August 4 and 2010 April 4. Solid brown line: power-law spectrum fit. Dashed orange line: broken power-law spectrum fit. Dotted magenta line: LP spectrum fit.
Results of the spectral fits to the Fermi–LAT data in the 0.1–100 GeV energy range for the 20 months and the five sub-periods with a power-law model.
| Period | Flux (E > 100 MeV) | Γ | TS |
|---|---|---|---|
| ( × 10−8 ph cm−2 s−1) | |||
| 20 months | 39.9 ± 0.8 | 2.20 ± 0.01 | 15 661 |
| Period 1 | 29.5 ± 1.7 | 2.31 ± 0.04 | 899 |
| Period 2 | 60.9 ± 0.2 | 2.27 ± 0.02 | 2247 |
| Period 3 | 33.0 ± 0.4 | 2.36 ± 0.01 | 1195 |
| Period 4 | 39.7 ± 3.1 | 2.55 ± 0.08 | 2514 |
| Period 5 | 73.1 ± 2.6 | 2.09 ± 0.03 | 4500 |
By visual inspection, the 20-month spectrum seems to be curved (Fig. 2). To explore this curvature, the spectrum was fitted in the 0.1–100 GeV energy band with two alternative spectral models with respect to the simple power law: a broken power law (BPL), dN/dE ∝ |$(E/E_{0})^{-\Gamma _1}$| for E < Eb, dN/dE ∝ |$(E/E_{0})^{-\Gamma _2}$| for E > Eb, where Γ1 and Γ2 are the photon indices below and above the energy break Eb; a LogParabola (LP), dN/dE ∝ |$(E/E_{0})^{-\alpha -\beta \,{\rm log}(E/E_{0})}$|, where the parameter α is the spectral slope at a reference energy E0 and β measures the curvature around the peak (see Landau et al. 1986; Massaro et al. 2004). In order to estimate as accurately as possible the energy break parameter of the BPL function, we studied the profile of the likelihood function, fixing Eb at different values between 100 MeV and 5 GeV with a step of 50 MeV. This likelihood profile was fitted with a parabolic function; the minimum for the parabola corresponds to Eb = (2290 ± 390) MeV. Fixing Eb at this value during the BPL likelihood fit, the results are: prefactor = (3.31 ± 0.13) × 10−12, Γ1 = 2.10 ± 0.02, Γ2 = 2.69 ± 0.07, with TS = 15 733 and an integral flux in the 0.1–100 GeV energy range of (37.6 ± 0.8) × 10−8 ph cm−2 s−1. The LP fit was performed fixing the reference energy E0 at 300 MeV; the normalization was found to be (4.28 ± 0.08) × 10−10, α = 2.01 ± 0.03 and β = 0.09 ± 0.01 with TS = 15 732 and an integral flux in the 0.1–100 GeV energy range of (38.7 ± 0.7) × 10−8 ph cm−2 s−1. We used a likelihood ratio test to check the PL model (null hypothesis) against the BPL model (alternative hypothesis). These values may be compared, following Nolan et al. (2012), by defining the significance of the curvature TScurve = TSBPL – TSPL = 72 corresponding to ∼8.5σ. In the same way for the LP model, we obtain TScurve = 71 corresponding to ∼8.4σ. This shows that the 20-month LAT spectrum of PKS 0537−441 does not follow a power-law function, and the curvature is significant.
4.2 Temporal behaviour
To investigate the temporal activity of PKS 0537−441, we used the light curve of the integrated γ-ray flux over the entire period 2008 August 4–2010 April 4 with 3-d time bins in the band 0.1–100 GeV already presented in Section 2.
In Fig. 3, the first-order structure function (SF) of the γ-ray light curve is reported. The SF analysis shows a power-law increasing trend from zero lag to (147 ± 3)-d lag, resulting in a 1/fa power density spectrum (PDS) with a = 1.5 ± 0.2. This trend implies universality from 3-d to about 5-month time-scales, and the index value represents a temporal variability placed halfway between the flickering (red noise) and the shot noise (Brownian-driven process) behaviour. This slope value is in agreement with the average value of the PDS directly evaluated in the frequency domain using the 3-d bin light curves extracted for the nine brightest FSRQs of the first year of Fermi observations (Abdo et al. 2010c).
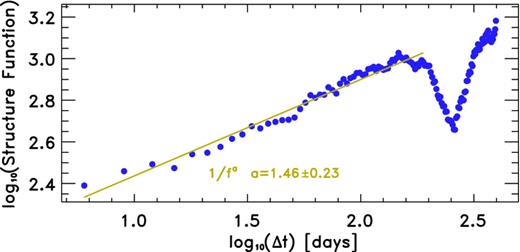
First-order structure function of the 3-d bin γ-ray light curve for the period 2008 August 4–2010 April 4.
A consistent drop is seen in Fig. 3 at lags longer than about 200 d, probably due to both the contamination of finite-series edge effects and to the main outburst and active phase of PKS 0537−441, which can be seen in the central part of the light curve from about MJD 548 85 to about 550 87. A hint of a possible moderate break is found at time-scales between 48 and 51 d, but this does not necessarily imply a local characteristic time-scale, considering that the periodogram of the light curve does not show significant evidence for any characteristic and recurrent time-scale (Fig. 4). The discrete autocorrelation function (DACF) does not show peaks at time lags below the 200-d limit, and the zero-crossing time lag is placed between 69 and 72 d (Fig. 5) .
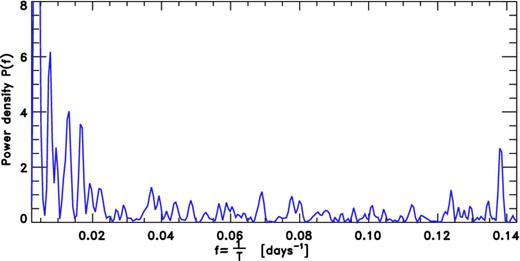
Periodogram P(f) of the 3-d bin γ-ray light curve. No significant peak is present in P(f); therefore no significant power spectrum component and no periodicity is present.
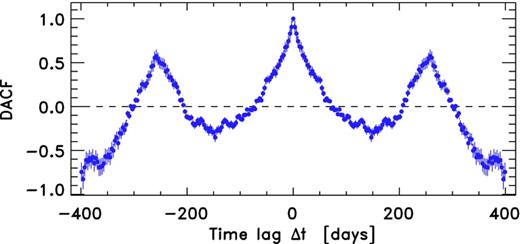
The discrete autocorrelation function applied to the 3-d bin γ-ray light curve. DACF points out a zero-value-crossing time lag between 69 and 72 d.
5 DISCRETE CROSS-CORRELATION ANALYSIS
Correlations between the best sampled multiwavelength light curves of PKS 0537−441 were investigated by computing the discrete cross-correlation function (DCCF), following Edelson & Krolik (1988). Lag and correlation strength were computed by fitting a Gaussian profile to the correlation peak in the DCCF and uncertainties in these parameters were estimated by a Monte Carlo method (see Peterson et al. 1998). DCCFs were calculated both with detrended and non-detrended light curves (see e.g. Welsh 1999, for details about the detrending procedure) in order to look for differences in correlation of the rapid variations and the slower long-term variability.
The combined ATOM and REM R-band data provide the best overlap with the LAT γ-ray light curve. The DCCF between these two data sets, without detrending, is shown in Fig. 6, left-hand panel (here and in the following positive lag in γ-rays–R means that γ-ray flux variations lead those in the R-band). The peak in Fig. 6 (left-hand panel) corresponds to a correlation of 0.92 ± 0.06 when corrected for the effect of measurement errors (which reduces the correlation). A Spearman rank correlation test between the γ-ray and R-band flux gives coefficient rs of 0.6609 with a probability of chance occurrence <10−6, confirming the positive correlation. The correlation between the γ-ray and the K band is weaker, 0.54 ± 0.07 (Fig. 6, centre panel). This is not an effect of the sparser sampling of the K-band light curve, since the difference is present also when the analysis is limited to the time range where both bands are well sampled (MJD 548 90–552 90). Furthermore, the DCCFs show no significant time lag, with an uncertainty of a few days, between the R and K bands (Fig. 6, right-hand panel).
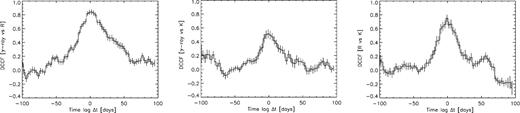
Discrete cross-correlation function between the γ-ray and R-band (left-hand panel), γ-ray and K-band (centre panel), R-band and K-band (right-hand panel) light curves. In each case, the DCCF shows a correlation peak consistent with lag = 0.
It is clear from the light curves that there is a correlation on long time-scales and this is also shown by the results of the DCCFs for the detrended light curves (see Table 2). The correlations are weaker compared to the non-detrended ones and also here no significant time lag was detected. The position of the peak is consistent with zero time lag (1.3 ± 1.5 d). When both light curves were detrended with a second-order polynomial the correlation was reduced to 0.51 ± 0.07, but still consistent with zero time lag (0.3 ± 1.8 d). However, different behaviours are quite evident going into details of the NIR, optical and γ-ray light curves (see Figs 7 and 8). A similar situation has been already observed for other bright γ-ray blazars (e.g. 3C 454.3, 4C +38.41; Raiteri et al. 2011, 2012). This complex behaviour could be in agreement with the turbulent extreme multicells scenario proposed by Marscher (2012). In this context, the slope of the PDS obtained for the γ-ray light curve indicates a significant contribution of red noise and thus of a random process such as the turbulence that is modulating the emission.
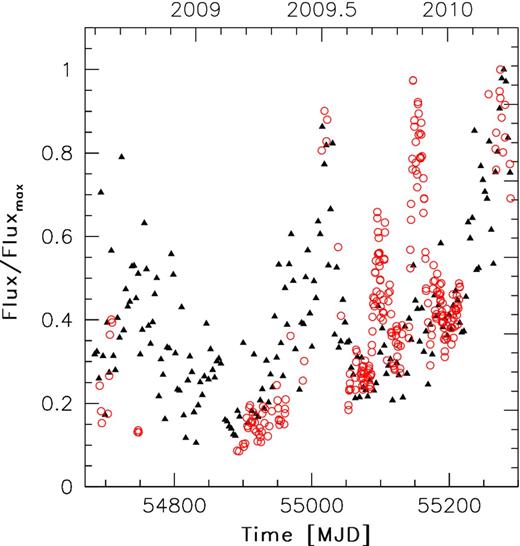
Comparison between γ-ray and K-band light curves. We superimpose γ-ray (black triangles) and K-band (red empty circles) light curves normalizing γ-ray and K flux values over the whole observing period to the respective peak flux values. The time binning is 3 d for γ-ray data and 1 d for the K-band data set.
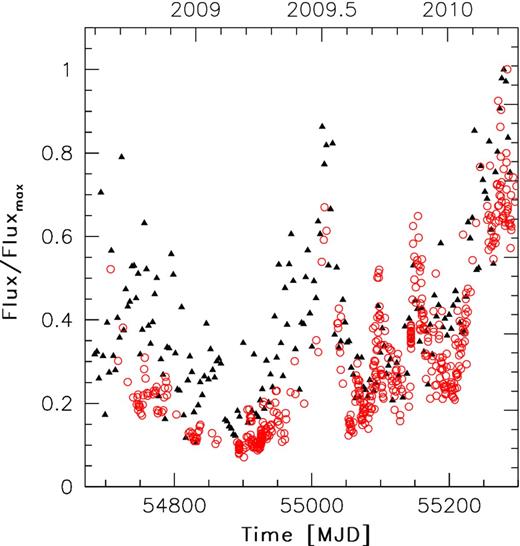
Comparison between γ-ray and R-band light curves. We superimpose γ-ray (black triangles) and R-band (red empty circles) REM light curves normalizing γ-ray and R flux values over the whole observing period to the respective peak flux values. The time binning is 3 d for γ-ray data and 1 d for the R-band data set.
Time lag and strength of the cross-correlation peak estimated by a Gaussian fit. All data were used in the case with non-detrending, while the detrended light curves used data from MJD 548 90 to 552 90. The correlation values have been corrected for the effect of white noise due to measurement errors.
| Non-detrended | Detrended | |||
|---|---|---|---|---|
| DCCF | Lag (d) | Max | Lag (d) | Max |
| γ-rays–R | 3.1 ± 1.9 | 0.92 ± 0.06 | 0.5 ± 2.4 | 0.57 ± 0.07 |
| γ-rays–K | 1.9 ± 2.5 | 0.54 ± 0.07 | 0.1 ± 2.6 | 0.43 ± 0.08 |
| R–K | 0.0 ± 1.1 | 0.71 ± 0.06 | −0.5 ± 0.9 | 0.64 ± 0.05 |
| Non-detrended | Detrended | |||
|---|---|---|---|---|
| DCCF | Lag (d) | Max | Lag (d) | Max |
| γ-rays–R | 3.1 ± 1.9 | 0.92 ± 0.06 | 0.5 ± 2.4 | 0.57 ± 0.07 |
| γ-rays–K | 1.9 ± 2.5 | 0.54 ± 0.07 | 0.1 ± 2.6 | 0.43 ± 0.08 |
| R–K | 0.0 ± 1.1 | 0.71 ± 0.06 | −0.5 ± 0.9 | 0.64 ± 0.05 |
6 X-RAY TO MM BEHAVIOUR
The BAT spectrum of the data collected during 2004 November–2009 August was fitted with a power law (|$\mathrm{d}N/\mathrm{d}E\propto E^{-\Gamma _{\rm BAT}}$|) with a photon index ΓBAT = 1.5 ± 0.5 and a 15–150 keV flux of (1.5|${^{+ 0.7}_{- 0.5}}$|) × 10−11 erg cm−2 s−1 [χ|${^{2}_{\rm red}}$| = 0.968, with 6 degrees of freedom (d.o.f.)]. As a comparison the same photon index with a flux a factor of 2 higher was obtained for the BAT spectrum extracted from 2004 December to 2005 November, dominated by episodes of more intense activity (Pian et al. 2007), indicating a quite stable spectral shape in hard X-rays.
During 2008 October–2010 March, Swift/XRT observed the source with a 0.3–10 keV flux in the range (3.2–7.7) × 10−12 erg cm−2 s−1, with a photon index varying in the range 1.6–1.9. The interval of photon index values is very similar to that previously observed by Swift/XRT spanning a larger flux range (ΓX = 1.6–1.8, Pian et al. 2007). A Spearman rank correlation test between the γ-ray and the X-ray flux gives a coefficient rs of 0.6176 with a probability of chance occurrence of 8 × 10⁻³, indicating a positive correlation. The small variability amplitude (calculated as the ratio of maximum to minimum flux) observed in X-rays (∼2.5) with respect to the γ-rays (∼11) could be an indication that the X-ray emission is produced by the low-energy tail of the same electron distribution. The peak flux observed in 2008 October is a factor of 2 lower with respect to the 2004–2005 Swift/XRT observations (Pian et al. 2007). Interestingly, the high X-ray flux in 2008 October coincides with a low activity state both in NIR-to-UV and γ-ray bands, suggesting that a second emission component can give a significant contribution in soft X-rays in that period (e.g. an increase of the synchrotron self-Compton component). We noted that X-ray flux variations had no optical/UV counterpart also in 2005 November (Pian et al. 2007). Similarly an X-ray flare with no counterpart at other frequencies has been observed in 3C 279 (Abdo et al. 2010; Hayashida et al. 2012).
Fig. 9 shows the XRT photon indices as a function of the fluxes in the 0.3–10 keV band; no significant change in the X-ray spectrum with the increase in the flux has been observed, and thus there is no hint of a hard spectrum additional component becoming persistent and significant at higher fluxes. However, we note a relatively hard spectrum (Γ ∼ 1.6–1.7) during the 2008 October observations (red circles in Fig. 9). The high correlation between the X-ray and optical (V-band) light curves reported in Pian et al. (2007) is not completely confirmed by our long-term monitoring of the source. In fact the peak of the activity in V-band observed by Swift/UVOT in 2010 March has no counterpart in the X-ray light curve. This, together with the increase of the flux observed in X-rays in October 2008 with no counterpart at other wavelengths, suggests a more complex connection between optical, X-ray (and γ-ray) emission over a long period. However, the sparse sampling of the X-ray light curve does not allow us to make a precise comparison with the NIR, optical as well as γ-ray light curves. By contrast, the K band and R band are well sampled and a comparison with the γ-ray light curve showed an overall correlation (see Section 5). However, on inspecting the light curves on short time-scales we note a significant increase of the NIR and optical fluxes in 2009 September and November with a smaller variability amplitude in γ-rays (see Figs 7 and 8), peaking on 2009 September 21 (MJD 550 95) and November 12 (MJD 551 47) (see Fig. 1). The largest amplitude variations are usually detected in γ-rays (Abdo et al. 2010c), and thus this behaviour is quite peculiar. Recently, a different behaviour between γ-ray and NIR/optical light curves has been observed in the intermediate-frequency-peaked BL Lac 3C 66A in 2008 and 2009–2010, with a good correlation in 2008 and an increasing NIR/optical flux with no counterpart in γ-rays during 2009–2010 (Itoh et al. 2012). In the same way, notwithstanding a significant correlation estimated between optical and γ-ray bands during 2008–2011, a strong optical flare without a γ-ray counterpart has been detected from the FSRQ 4C +38.41 in 2011 July (Raiteri et al. 2012).
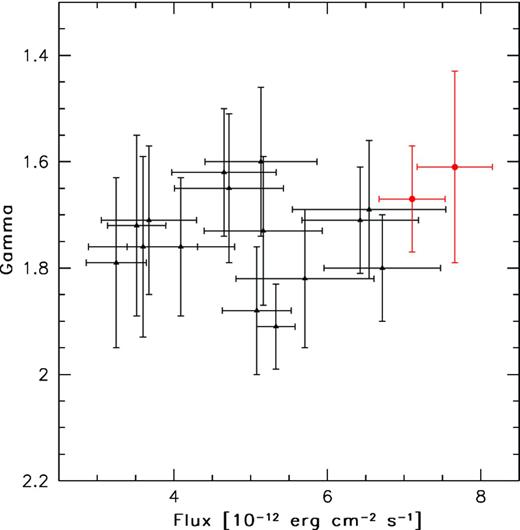
Swift/XRT photon index of PKS 0537−441 as a function of the 0.3–10 keV flux. The observations performed on 2008 October are shown with red circles.
During 2008–2010 an increase with an amplitude of a factor of ∼7 was observed in V band, significantly lower with respect to 2004–2005 observations (a factor of ∼60), confirming the huge flaring activity observed by REM and Swift in 2005 (Dolcini et al. 2005; Pian et al. 2007). A decreasing variability amplitude was observed from NIR (a factor of ∼12–13) to UV (a factor of ∼5). In particular, a clear change of variability amplitude was observed between R band (a factor of ∼14) and V band (a factor of ∼7).
There appears to be a good correlation between the 23 GHz light curve collected by SMA and the γ-ray light curve, in particular a similar increase was observed in 2010 reaching a peak value of 8.05 Jy on 2010 March 9 for SMA during the brightest γ-ray flaring period. The lack of SMA observations after this date does not allow us to determine if the 230 GHz flux density is still increasing and whether the mm peak is strictly simultaneous with the γ-ray peak. However, the contemporaneous increase in the two energy bands in 2010 seems to indicate that the emission region at mm and γ-rays is co-spatial and thus the γ-ray flaring activity probably originates at large distance from the central engine, beyond the broad line region.
7 MODELLING THE SEDs
We build three SEDs for PKS 0537−441 in three different activity states: low, average and high. We used REM, ATOM and Swift data collected on 2009 March 4 (MJD 548 94), 2009 June 4 (MJD 549 86) and 2010 March (MJD 552 58), and LAT spectra calculated over the period 2009 February 28–May 11 (MJD 548 90–549 62), 2008 August 4–2010 February 4 (MJD 546 82–552 31) and 2010 February 28–April 4 (MJD 552 55–552 90) for the low, average and high activity states, respectively. For each SED, we used the SMA observation available nearest to the Swift observation, i.e. 2009 February 27, 2009 July 15 and 2010 March 7. For the high activity state also the Planck and Wide-Field Infrared Survey Explorer (WISE) data collected on 2010 March 7–22 (from Giommi et al. 2012) and March 4–7, respectively, has been reported. Finally, we report in the SED the average BAT spectrum.
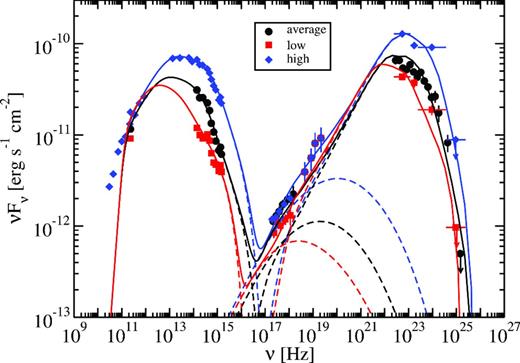
Modelling of the SEDs of PKS 0537−441 in a low, average and high state including Fermi, Swift, ATOM, REM and SMA data. See the text for details.
Model parameters for the SEDs of PKS 0537−441.
| Parameter | Symbol | Low state | Average state | High state |
|---|---|---|---|---|
| Redshift | z | 0.896 | 0.896 | 0.896 |
| Bulk Lorentz factor | Γ | 50 | 50 | 50 |
| Doppler factor | δD | 50 | 50 | 50 |
| Magnetic field | B | 0.2 | 0.2 | 0.2 G |
| Variability time-scale | tv | 2 × 10⁵ | 2 × 10⁵ | 2 × 10⁵ |
| Comoving radius of blob | |$R^{^{\prime }}_{{\rm b}}$| | 1.6 × 1017 cm | 1.6 × 1017 cm | 1.6 × 1017 cm |
| Jet height | r | 3.7 × 1018 cm | 3.7 × 1018 cm | 3.7 × 1018 cm |
| First electron spectral index | p1 | 2.0 | 2.0 | 2.0 |
| Second electron spectral index | p2 | 3.1 | 3.1 | 3.1 |
| Third electron Spectral Index | p3 | 3.9 | 4.6 | 4.6 |
| Minimum electron Lorentz factor | γ′min | 4.0 | 1.0 | 3.0 |
| Break electron Lorentz factor | γ′brk, 1 | 3.0 × 10² | 4.7 × 10² | 7.0 × 10² |
| Break electron Lorentz factor | γ′brk, 2 | 9.0 × 10² | 2.6 × 10³ | 4.2 × 10³ |
| Maximum electron Lorentz factor | γ′max | 1.3 × 10⁴ | 2.3 × 10⁴ | 3.0 × 10⁴ |
| Dust torus luminosity | Ldust | 3.3 × 1042 erg s−1 | 3.3 × 1042 erg s−1 | 3.3 × 1042 erg s−1 |
| Dust torus temperature | Tdust | 3 × 10² K | 3 × 10² K | 3 × 10² K |
| Dust torus radius | Rdust | 9.4 × 1018 cm | 9.4 × 1018 cm | 9.4 × 1018 cm |
| Jet power in magnetic field | Pj, B | 1.9 × 1046 erg s−1 | 1.9 × 1046 erg s−1 | 1.9 × 1046 erg s−1 |
| Jet power in electrons | Pj, e | 1.2 × 1046 erg s−1 | 1.2 × 1046 erg s−1 | 1.3 × 1046 erg s−1 |
In the ‘average state’, the LAT spectrum shows a clear deviation from a single power-law (see Section 3). This has been found for numerous other FSRQs and LSP BL Lacs (Abdo et al. 2010d), most notably for the extremely γ-ray bright FSRQ 3C 454.3 (Abdo et al. 2009; Ackermann et al. 2010; Abdo et al. 2011). The cause of this curvature, often characterized as a spectral break (when fitted with a double power law) is a bit of a mystery. It has been suggested that it is due to a feature in the electron distribution (Abdo et al. 2009); due to γγ absorption of γ-rays with He ii Lyα broad line photons (Poutanen & Stern 2010; Stern & Poutanen 2011); due to a combination of Compton scattering of two seed photon sources, for example, directly from the accretion disc, and from broad line emission (Finke & Dermer 2010); or due to Klein–Nishina effects from Compton scattering of H i Lyα photons (Ackermann et al. 2010). In the ‘high-state’ SED for PKS 0537−441, there is clearly a spectral break in the IR–optical spectrum, around 3 × 10¹⁴ Hz ( ∼ 1 μm). The combination of a break found in both the synchrotron and Compton-scattered spectrum seems to indicate a common origin for the break, most likely due to an intrinsic feature in the underlying electron distribution. Indeed, that is how we model it for this source. Although the broken IR/optical spectrum in the ‘high state’, and the curved γ-ray spectrum in the ‘average state’ are not contemporaneous, there does seem to be a hint of curvature in the ‘high-state’ LAT spectrum, especially when the upper limit in the highest energy bin is considered. It is certainly possible, maybe even likely, that the cause of the γ-ray spectral breaks in all blazars which show them is related to features in the electron distribution, although one should be careful not to overgeneralize. Simultaneous IR, optical and γ-ray observations of other blazars could be very useful for making this determination, although contamination in the IR by a dust torus (e.g. Malmrose et al. 2011) or another synchrotron component (e.g. Ogle et al. 2011) could make this difficult.
The three states differ very little in the radio and X-rays. This emission is caused by synchrotron and EC emission, respectively, of the lower portion of the electron distribution, although there is some additional SSC emission for the X-rays. Consequently, the jet power in electrons (see Table 3) varies little between states, since the p1 = 2.0 portion of the electron distribution contains most of the electrons’ energy. The model implies emission very close to equipartition between electrons and Poynting flux for all model fits, with a slight dominance of Poynting flux.
8 CONCLUSIONS
We presented multiwavelength observations of PKS 0537−441 during a period of 20 months (2008 August–2010 April) including Fermi, Swift, ATOM, REM and SMA data. Strong variability has been observed in γ-rays, with two major flaring episodes (2009 July and 2010 March) and a harder-when-brighter spectral behaviour, quite common for FSRQs and LSP BL Lacs, in 2010 March. The average LAT spectrum accumulated over 20 months showed a significant curvature, well described both by a BPL model with Eb = (2290 ± 390) MeV and a LP model. A quite steep PDS slope (α = 1.5 ± 0.2) has been estimated, in agreement with those observed for the brightest FSRQs (Abdo et al. 2010c), suggesting a random-walk underlying mechanism.
Only moderate variability has been observed in X-rays with no correlation between flux and photon index. An increase of the flux in the X-ray band with no counterpart at the other wavelengths has been observed in 2008 October, suggesting a significant contribution of a second component (e.g. SSC emission) in some high activity states. No clear correlation of the X-ray emission with the NIR or optical bands has been found. Only a correlation with the γ-ray band has been observed. In addition, we observed correlation between the γ-ray band with the R band and more weakly with the K band, with no significant time lag. However, together with this ‘overall’ correlation we note that on finer time-scales the light curves showed differences. In particular, two flaring episodes in NIR and optical bands have been observed in 2009 September and even more strongly in 2009 November with no significant counterparts in γ-rays.
As seen for FSRQs and LSP BL Lacs, the SED of the source cannot be modelled by a simple SSC model. We included an EC component of seed photons from a dust torus. The 230 GHz light curve showed an increase simultaneously with the γ-rays, suggesting co-spatiality of the mm and γ-ray emission regions at large distance from the central engine and thus the dust torus as the possible main source of seed photons. The low, average and high activity SEDs of the source could be fit by changing only the electron distribution parameters. This has been observed previously for Mrk 501 (Petry et al. 2000), although this is a high-synchrotron-peaked BL Lac, while PKS 0537−441 is an LSP BL Lac/FSRQ. In our modelling, we have found that two breaks in the electron distribution are necessary. A spectral break in the NIR–optical spectrum has been found, in agreement also with a significant change of the flux variability amplitude below and above the R band. This break together with the curvature observed in γ-rays (possibly characterized as a spectral break) seems to indicate a common origin for them, most likely due to an intrinsic feature in the underlying electron distribution.
Broad emission lines have been observed during a low activity state of PKS 0537−441 (Pian et al. 2005), in contrast with the initial classification as a BL Lac object. However, recent studies of a large sample of blazars showed that a classification depending only on their optical/UV spectral properties is not efficient to distinguish FSRQs and BL Lac objects (Abdo et al. 2010a; Ghisellini et al. 2011). Variability and spectral properties in γ-rays indicate an FSRQ-like behaviour, in agreement also with the SED properties. The observed isotropic γ-ray luminosity in the 0.1–100 GeV energy range is 8.2 × 1047 erg s−1 for the 20-month interval considered, reaching a peak value of 2.6 × 1048 erg s−1 on 3-d time-scale at the end of 2010 March. These values are comparable to those of the bright FSRQs (Ghisellini et al. 2010).
The multifrequency observations presented here give new clues, but also offer new questions on the astrophysical mechanisms at work in PKS 0537−441. Furthermore, mm to γ-ray observations will be fundamental to investigate in even more detail the correlations by using the long-term variability in different energy bands to achieve a complete understanding of the fundamental processes that underlie the behaviour of this source.
The Fermi–LAT Collaboration acknowledges generous ongoing support from a number of agencies and institutes that have supported both the development and the operation of the LAT as well as scientific data analysis. These include the National Aeronautics and Space Administration and the Department of Energy in the United States, the Commissariat à l’Energie Atomique and the Centre National de la Recherche Scientifique / Institut National de Physique Nucléaire et de Physique des Particules in France, the Agenzia Spaziale Italiana and the Istituto Nazionale di Fisica Nucleare in Italy, the Ministry of Education, Culture, Sports, Science and Technology (MEXT), High Energy Accelerator Research Organization (KEK) and Japan Aerospace Exploration Agency (JAXA) in Japan and the K. A. Wallenberg Foundation, the Swedish Research Council and the Swedish National Space Board in Sweden. Additional support for science analysis during the operations phase is gratefully acknowledged from the Istituto Nazionale di Astrofisica in Italy and the Centre National d’Études Spatiales in France. The SMA is a joint project between the Smithsonian Astrophysical Observatory and the Academia Sinica Institute of Astronomy and Astrophysics and is funded by the Smithsonian Institution and the Academia Sinica. We thank the Swift team for making these observations possible, the duty scientists and science planners. This publication makes use of data products from the Wide-field Infrared Survey Explorer, which is a joint project of the University of California, Los Angeles, and the Jet Propulsion Laboratory/California Institute of Technology, funded by the National Aeronautics and Space Administration. This paper is partly based on observations obtained with Planck (http://www.esa.int/Planck), an ESA science mission with instruments and contributions directly funded by ESA Member States, NASA, and Canada. We thank the anonymous referee, Y. Tanaka, C. Dermer, S. Digel, and E. Charles for useful comments and suggestions. Some authors acknowledge financial contribution from grant PRIN-INAF-2011.
The test statistic (Mattox et al. 1996) is defined as TS = −2(log L0 − log L), where L0 is the likelihood for the null hypothesis (i.e. no source exists at the given position) and L1 is the alternative hypothesis (the source exists).
http://sma1.sma.hawaii.edu/callist/callist.html. Use in publication requires obtaining permission in advance.
