


Abstract
We investigate the potential to improve optical tracers of cluster mass by exploiting measurements of the magnitude gap, m12, defined as the difference between the r-band absolute magnitudes of the two brightest cluster members. We find that in a mock sample of galaxy groups and clusters constructed from the Bolshoi simulation, the scatter about the mass–richness relation decreases by ∼15–20 per cent when magnitude gap information is included. A similar trend is evident in a volume-limited, spectroscopic sample of galaxy groups observed in the Sloan Digital Sky Survey (SDSS). We find that SDSS groups with small magnitude gaps are richer than large-gap groups at fixed values of the one-dimensional velocity dispersion among group members σv, which we use as a mass proxy. We demonstrate explicitly that m12 contains information about cluster mass that supplements the information provided by group richness and the luminosity of the brightest cluster galaxy, LBCG. In so doing, we show that the luminosities of the members of a group with richness N are inconsistent with the distribution of luminosities that results from N random draws from the global galaxy luminosity function. As the cosmological constraining power of galaxy clusters is limited by the precision in cluster mass determination, our findings suggest a new way to improve the cosmological constraints derived from galaxy clusters.
1 INTRODUCTION
Galaxy clusters have long been exploited to probe the composition of the universe. The utility of galaxy clusters as cosmological probes using a broad range of techniques has been reviewed extensively by Allen, Evrard & Mantz (2011). Galaxy cluster observations are a key component of any effort to constrain the cause of cosmological acceleration (see the review by Weinberg et al. 2012). Among many advances in cluster cosmology, modern optical surveys have enabled the construction of large samples of optically identified clusters which, in turn, have led to competitive cosmological constraints from optically identified cluster abundances (e.g. Gladders et al. 2007; Rozo et al. 2010).
Much of the constraining power of clusters results from determinations of their abundance as a function of their mass. The abundance of clusters by mass may be reliably predicted (e.g. Tinker et al. 2008), but cluster mass is not directly observable. Optical cluster cosmology efforts generally rely on using the number of cluster members (richness) as a proxy for mass to concurrently fit for cosmological parameters and the mass–richness relation (although, see Newman et al. 2002, for another technique). In detail, richness must be defined precisely for the observational sample under consideration, so that the specific definitions of richness vary depending upon survey characteristics and cluster identification methods.
One way to improve cosmological constraints from optically identified clusters is to reduce the scatter between the observable (richness) and the predicted quantity (mass) (Rozo et al. 2010; Rykoff et al. 2012). In this paper, we suggest that the differences in absolute magnitude between the most luminous cluster members, data already contained within optical surveys aiming to perform cluster cosmology, can be harnessed to reduce the scatter in cluster mass for a fixed set of observables. Specifically, we show that magnitude gap, the difference in r-band absolute magnitude between the brightest and second brightest members of a galaxy group, can aid in the determination of group mass at both fixed richness and fixed r-band luminosity of the brightest group member. We provide theoretical and observational support for this suggestion using the Bolshoi simulation of cosmological structure growth (Klypin, Trujillo-Gomez & Primack 2011) and galaxy group and cluster data from Data Release 7 of the Sloan Digital Sky Survey (SDSS) (Abazajian et al. 2009). In Section 2, we describe mock galaxy catalogues constructed from the Bolshoi simulation. A brief description of the SDSS group data is given in Section 3. We present results from our mock galaxy catalogue in Section 4 and from our analysis of the SDSS groups in Section 5. We draw brief conclusions from these results in Section 6.
2 SIMULATIONS AND MOCK GALAXY CATALOGueS
We use the Bolshoi N-body simulation (Klypin et al. 2011) to study the connection between magnitude gaps within galaxy groups and the mass–richness relation. Bolshoi models the growth of structure in a cubic volume 250 h−1 Mpc on a side within a Λ cold dark matter (ΛCDM) cosmology with total matter density ΩM = 0.27, Hubble constant h = 0.7, power spectrum tilt ns = 0.95 and power spectrum normalization σ8 = 0.82. The Bolshoi data are available at http://www.multidark.org and we refer the reader to Riebe et al. (2011) for additional information. Our analysis requires reliable identification of self-bound subhaloes within virial radii of distinct haloes. We utilize the ROCKSTAR (Behroozi et al. 2013) halo finder in order to identify haloes and subhaloes within Bolshoi.
Once brightnesses have been assigned to haloes according to equation (1), we construct mock galaxy samples by imposing a brightness cut Mr < −18 on all the mock galaxies in Bolshoi. This brightness cut corresponds to Vmax > 92 km s−1, well above the 50 km s−1 completeness limit of Bolshoi (Klypin et al. 2011). In this mock catalogue, we consider galaxy groups to be collections of subhaloes associated with the same host halo. We study the properties of these mock groups in Section 4.
3 OBSERVATIONAL DATA
To study the mass–richness relation observed in low-redshift groups and clusters we use a volume-limited catalogue of galaxy groups identified in Data Release 7 of the SDSS using the algorithm described in Berlind et al. (2006). This is an update of the Berlind et al. (2006) groups (based on SDSS Data Release 3) to SDSS Data Release 7. All of the members of this sample are members of the main galaxy sample of SDSS Data Release 7. The group catalogue is constructed using a redshift-space friends-of-friends algorithm that has been corrected for incompleteness due to fibre collisions. The particular group catalogue we use is constructed from galaxies in a volume-limited spectroscopic sample in the redshift range 0.02 < z < 0.068 with r-band absolute magnitude Mr − 5 log h < −19. We refer to this catalogue as the ‘Mr19’ group catalogue. Each of the 6439 groups in the Mr19 catalogue contains N > 2 members. We refer the reader to Berlind et al. (2006) for further details on the group finding algorithm.
4 PREDICTIONS FOR THE POTENTIAL UTILITY OF GAP INFORMATION
In this section, we use the mock galaxy catalogue described in Section 2 to study the predictions of abundance matching for the dependence of host halo mass on galaxy group richness and magnitude gap. Such a study is idealized for several reasons, including the relative simplicity of the SHAM algorithm and the fact that groups can be unambiguously identified with haloes of a particular mass. Nevertheless, this demonstration has the distinct advantage that the masses of the host haloes in the Bolshoi simulation are known and do not need to be inferred imperfectly from observational data. To proceed, we define richness N as the number of mock galaxies within the host halo brighter than our specified absolute magnitude threshold. We take the magnitude gap to be the difference between the r-band absolute magnitude of the brightest galaxy within the halo and the second brightest galaxy within the halo, m12 = Mr, 1-Mr, 2, where Mr, i is the r-band absolute magnitude of the ith brightest galaxy in the halo.
We illustrate our motivation for exploring the utility of gap information in Fig. 1, in which we plot the mass distributions of host haloes in Bolshoi in a narrow range of richness, 12 < N < 18. The grey, hatched histogram traces the mass distribution for all host haloes in this richness range, while the thin red (thick blue) curve pertains to host systems with a large (small) magnitude gap m12. Evidently, large-gap systems tend to be more massive than their small gap counterparts at fixed richness. Of course the trend in Fig. 1 could simply be due to the finite width of the richness bin we have chosen, rather than following as a consequence of the mass–richness residual being correlated with m12. To explore this issue more rigorously, we employ standard regression analysis techniques to find the linear relationship between ln(N) and ln(M) that minimizes σ(ln M). The use of a linear regression is well motivated by previous results (for example, Becker et al. 2007) that find the mass–richness relation to be well described by a power law. We find that our best-fitting model, Mfit(N) = CNα, with C = 2.2 × 10¹² M⊙ and α = 1.1, gives an accurate description of the mass–richness relation for the rich groups (N ≥ 10) in our mock sample, yielding a mean residual 〈δln M〉 ≃ 0.02, and a residual dispersion of σ(ln M) ≃ 0.33.
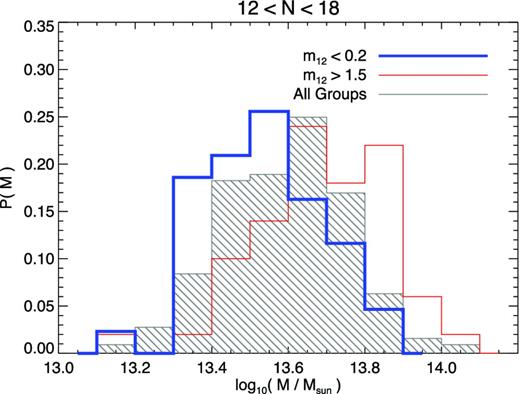
Plot of the mass distribution of host haloes in Bolshoi in the richness range 12 < N < 18. The mass distribution for all host haloes in this richness range appears as the hatched, grey histogram. The thin red curve traces this distribution for the subsample of host systems with a very large magnitude gap (m12 > 1.5). The mass distribution of host haloes with m12 < 0.2 is plotted with the thick blue curve. Note that most objects are not in either m12 bin traced by the red or blue histograms, which is why the full distribution plotted in grey does not resemble a combination of the red and blue. Evidently, large-gap systems tend to be more massive at fixed richness, suggesting the possibility that m12 can be used to improve the calibration of the mass–richness relation.
In Fig. 2, we plot the mean residual δ ln M as a function of m12. The trend suggested by Fig. 1 is borne out: groups and clusters with a large (small) magnitude gap m12 are more (less) massive than the average M at a given richness. A linear fit to the results illustrated in Fig. 2 indicates that δ ln M ∝ 0.18 m12, implying that there may be significant information about a cluster's mass contained in the magnitude gap m12 that is not contained in the richness alone. Moreover, the mass dispersion about the m12-N plane determined by a two-dimensional linear regression improves by 18 per cent to σ(ln M) ≃ 0.27, further demonstrating the potential improvement in mass determination provided by the use of magnitude gap information.
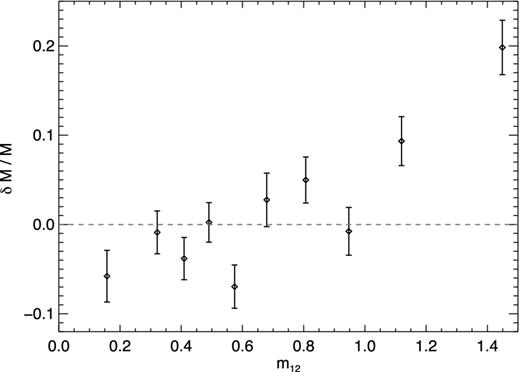
Plot of the residual δ ln M of the best-fitting mass–richness power-law relation exhibited by groups and clusters in Bolshoi as a function of m12. A linear fit to the residuals indicates that δ ln M ∝ 0.18 m12, suggesting that exploiting the magnitude gap may significantly improve cluster mass estimation techniques that rely only on richness.
While the trend in the mass–richness relation with m12 as seen in Fig. 2 is the novel feature of this work, the tendency for large-gap systems to be more massive at fixed richness appears in a variety of guises in the literature on fossil groups, which are typically defined to be galaxy groups with m12 > 2. The picture of fossil groups that is the most prevalent in the literature is that these are groups which assembled most of their mass at high redshift, so that processes such as dynamical friction and mass-loss have had ample time to deplete these systems of their most massive satellite galaxies, leaving behind a very bright central galaxy with few comparably bright satellites (Jones et al. 2003; D'Onghia et al. 2005; Zentner et al. 2005).1
In the above scenario for the origins of fossil groups, the same processes that lead to the formation of a large magnitude gap are also at work in the depletion of the number of group members above a given brightness threshold. In other words, this picture posits a dynamical connection between m12 and richness. However, even in the complete absence of such dynamical processes, we may still expect large-gap systems to have fewer members than small-gap systems. This is a consequence of the shape of the Schechter function: for any luminosity function Φ(L) with a slope that steepens with brightness, the average gap m12 obtained from a set of N random draws from Φ(L) increases as N decreases.
The extent to which dynamical processes influence the relationship between m12 and N remains an open question, but we point out here that if m12 were purely statistical, resulting from N random draws from a Schechter function, the magnitude gap would contain no information about mass that would not already be provided by knowledge of richness. This follows from Bayes’ theorem. If m12 were determined strictly by N random draws from a common luminosity function, then P(m12|M, N) = P(m12|N). Then it follows directly from Bayes’ theorem that P(M|N, m12) = P(M|N); that is, the probability distribution of mass is unchanged by knowledge of m12 when the richness is known. This is sensible because in this scenario the m12 distribution is determined entirely by N, so knowledge of m12 provides no new, independent information about the system. Thus the trend exhibited by the mass–richness relation seen in Fig. 2 reflects a relationship between the magnitude gap and the mass of host haloes in our mock sample beyond that expected from sampling a luminosity function a finite number of times.
The SHAM-based results presented in this section show that a simple and well-supported model for populating haloes with galaxies makes a definite prediction for the relationship between halo mass, magnitude gap and richness in groups. To be sure, there are many factors that will tend to wash out the clear trend seen in Fig. 2. For example, group/cluster membership (and hence, richness) is determined by halo membership, so contamination by interlopers due to projection effects is not included; the simulations do not suffer from edge effects that may alter the richnesses of groups in real surveys and the fidelity with which the SHAM prescription for identifying haloes and subhaloes with luminous galaxies correctly describes richness has not been extensively tested in this context. As we will see in the next section, despite these complicating factors the dependence of the mass–richness relation on m12 appears to be significant in a spectroscopic sample of galaxy groups observed in SDSS.
5 THE OBSERVED CONNECTION BETWEEN MASS, RICHNESS AND MAGNITUDE GAP
We now examine the mass–richness scaling relation seen in groups and clusters in the volume-limited Mr19 galaxy group catalogue described in Section 3. The principal result of this section appears in the bottom-right panel of Fig. 3, which we will argue demonstrates that the magnitude gap contains information about cluster mass that is independent of both richness and LBCG. Most of the work described in this section, illustrated in the remaining three panels of Fig. 3, addresses a variety of possible systematics and selection effects that are germane to our primary conclusion.
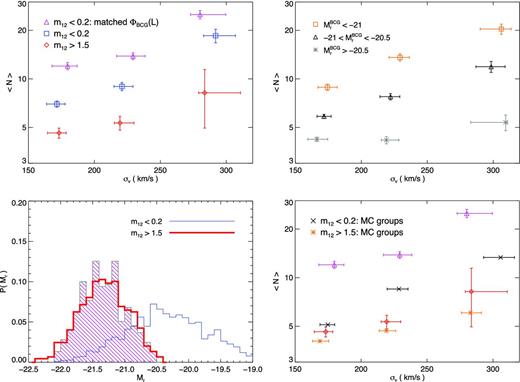
Upper Left: richness as a function of mass proxy, σv. Points are placed at the median σv in each bin. Horizontal error bars represent the inner quartiles of the σv distribution in each bin. Vertical error bars show the error on the mean. The red diamonds show systems exhibiting a large magnitude gap m12 > 1.5, while blue squares show small-gap systems. The magenta triangles represent a randomly selected subsample of small-gap systems with a BCG luminosity function ΦBCG(L), matched to that of the large-gap systems. Lower Left: thick (thin) histograms show the distribution of BCG luminosity ΦBCG(L) (normalized to unit area) of large- (small-) gap systems in Mr19. The magenta, hatched histogram traces the BCG luminosity function of a random subsample of small-gap systems selected to match ΦBCG(L) of the large-gap systems. Upper Right: mean richness as a function of σv for galaxy groups with different BCG brightnesses. Lower Right: the σv − N scaling relations for large-gap groups and small-gap groups. All samples have the same ΦBCG(L). The orange asterisks and black crosses represent results from Monte Carlo (MC) simulation of the group population in a model assuming that gap does not explicitly depend upon σv (the group mass proxy). MC groups have negligible errors on the mean richness. The red diamonds and magenta triangles represent large- and small-gap groups in the SDSS data, as in the upper-left panel. The differences between large-gap and small-gap groups in the data are significant compared to the MC groups, demonstrating that the magnitude gap m12 contains information about group/cluster mass that is independentofboth richness and LBCG.
In the upper-left panel of Fig. 3, we plot the mean richness of galaxy groups in Mr19 as a function of σv. This panel illustrates the results of a calculation in which we have divided the Mr19 groups into logarithmically spaced bins over the range 150 ≤ σv ≤ 350 km s− 1, and computed the mean richness in each bin. Evidently, large-gap systems do indeed appear to be less rich at fixed σv (mass) than small-gap systems. However, prior to drawing this conclusion we now address several possible selection effects and complicating factors that could influence this result. The primary result of this section is shown in the lower, right-hand panel of Fig. 3 in which we exhibit the σv-N relation after controlling for the uninformative, intrinsic correlations between m12 and richness as well as m12 and the absolute magnitude of the brightest galaxy in the group.
Before proceeding, we draw attention to a contrast between our presentation of the predictions of the standard cosmological model in Section 4 and our present analysis of the observed SDSS DR7 groups. In the present analysis, we begin by presenting results by binning the sample according to the mass proxy (σv) rather than richness, which we have found gives a clearer demonstration of our principal result. However, this choice introduces several possible systematics (for example, errors on σv are correlated with richness). In Section 5.3, we address these systematics in two distinct ways. First, we verify that the conclusions we draw based on our principal methodology are robust to systematic errors pertaining to noisy measurements of σv. Second, at the end of Section 5.3 we provide an alternative demonstration of our conclusions by instead binning our sample according to the richness N. Regardless of whether we bin on richness or our mass proxy, our conclusions remain the same: large-gap groups exhibit a different mass–richness scaling relation than small-gap groups, with large-gap groups being more massive at fixed richness than small-gap groups.
5.1 Controlling for the magnitude gap–BCG correlation
Selecting groups with a large magnitude gap biases one to select groups with a luminous BCG. For example, the Mr19 galaxy sample contains no galaxies dimmer than Mr = −19, so selecting groups with m12 > 1.5 requires the BCG to have a brightness Mr < −20.5. Meanwhile, Reyes et al. (2008) suggested that BCG luminosity provides information on group mass that is independent of richness, so we must account for this bias to ensure that the magnitude gap provides information that is independent of the known correlation between mass and BCG luminosity.
We illustrate the differences in BCG luminosity induced by this selection in the lower-left panel of Fig. 3, with the thin blue (thick red) histogram tracing ΦBCG(L) for small-gap (large-gap) systems. The upper-right panel of Fig. 3 is an illustration of the potential importance of this effect as BCG luminosity clearly informs the σv-N relation of the SDSS galaxy groups. Systems with brighter BCGs are also richer at fixed σv. This trend has the sense that should be expected if LBCG were determined by the brightest of N random draws from a fixed, global luminosity function (e.g. Paranjape & Sheth 2012).
To account for bias from differences in the BCG luminosity distributions between large-gap and small-gap groups, we have drawn a random subsample of 1000 of the low-gap, m12 < 0.2, groups with a BCG brightness distribution that matches that of the large-gap, m12 > 1.5 groups. The magenta, hatched histogram in the bottom-left panel of Fig. 3 shows ΦBCG(L) of the resulting LBCG-matched subsample of the m12 < 0.2 groups. The σv-N scaling relation for the small-gap, matched-BCG systems is shown as the purple triangles in the upper-left panel of Fig. 3. Eliminating any differences between the BCG luminosity distributions of low-gap and high-gap systems increases the disparity between the σv-N relations of low- and high-gap groups. We conclude that m12 informs the σv-N relation in a manner that is independent of BCG luminosity alone.
5.2 Controlling for the statistical magnitude gap–richness correlation
The principal result of our analysis in this section lies in the comparison between the red diamonds and magenta triangles in Fig. 3: at fixed LBCG, large-gap systems are under-rich relative to small-gap systems at fixed σv (mass). However, because of the natural correlation between m12 and N discussed in Section 4 in the context of our simulation analysis, some care is required before interpreting the differences between these points as implying that large-gap and small-gap systems have intrinsically different mass distributions at fixed richness. The difference between the red diamonds and magenta triangles shows that P(N|σv, m12) ≠ P(N|σv), or equivalently, P(m12|σv, N) ≠ P(m12|σv). This inequality would hold even in a universe in which m12 is determined solely by N random draws from a global luminosity function. Yet, as discussed in Section 4, in such a universe the magnitude gap contains no information about cluster mass that is independent of richness. However, it is possible to show that the σv-N scaling relations exhibited by the SDSS groups are distinct from the relations expected if m12 were solely determined by random selection from a global luminosity function.
We demonstrate that this is the case by contrasting the SDSS group data against the following Monte Carlo (MC) simulation. We draw a random galaxy group from our SDSS sample and assign the values of σv and N of this group to the ‘MC’ galaxy group. We populate the MC group by drawing N galaxies from the global luminosity function of all the galaxies in the Mr19 group sample. We assign the MC group a value of m12 by taking the difference between the r-band absolute magnitudes of the brightest and next-brightest galaxies used to populate the MC group. We repeat this procedure 106 times to construct a sample of one million MC groups with the same group multiplicity function and σv-N scaling relation as the Mr19 sample. The objective of this exercise is solely to construct mock samples of group galaxies with identical luminosity functions as the observed sample, but with magnitude gap determined solely by richness.
The MC groups exhibit a correlation between m12 and N at fixed σv, as expected. This is the correlation induced solely by the statistics of random draws from the group galaxy luminosity function. In the bottom-right panel of Fig. 3, we plot the σv-N scaling relation for MC groups with m12 > 1.5 with orange asterisks and MC groups with m12 < 0.2 with black crosses. Both samples of MC groups have been selected so that their LBCG distributions match that of the large-gap systems seen in the data, so that all the samples plotted in the bottom-right panel have the same ΦBCG(L).
Note that the scaling of richness with σv in the two samples of MC groups is distinct even though m12 cannot inform the velocity dispersion of the groups. This demonstrates the purpose of this exercise: if it is possible to use m12 to inform mass determination, then the trend in the mass–richness scaling relation seen in the data must be stronger than it is in the MC sample, in which the gap is uninformative. Indeed, this is the case: the differences in richness at fixed σv between the large-gap and small-gap groups in the SDSS data are clearly significant compared to their MC counterparts. We conclude that the gap distribution is not determined solely by statistical effects, providing strong evidence that having a large magnitude gap is, in fact, correlated with being under-rich at a given mass. Moreover, because we have controlled for the brightness of the BCG as described above, this implies that the magnitude gap m12 contains information about the masses of galaxy groups that is independent of both richness and BCG brightness. These results suggest that it may be possible to use m12 to improve optical estimators of group and cluster masses.
As a further check that the magnitude gap provides information that is independent of richness, we have supplemented the comparison of the Mr19 groups to the MC groups by comparing the m12 distribution of two subsamples of the Mr19 groups: one with 75 < σv < 150 km s− 1 and the other with 200 < σv < 400 km s− 1, both with the same distribution of richnesses. We find that at fixed richness, the groups with larger velocity dispersion have a higher proportion of large m12 values relative to the small σv groups such that the mean m12 values of the two distributions are offset by ∼2.5 σ. The sense of this trend is in keeping with the results presented in Fig. 3. This result explicitly demonstrates that P(m12|σv, N) ≠ P(m12|N), directly implying that P(σv|m12, N) ≠ P(σv|N), i.e. that the magnitude gap is informative about group/cluster mass even when the richness is known.
5.3 Systematics associated with velocity dispersion as mass proxy
We conclude this section by addressing several additional possible systematic errors in our data analysis, each related to our use of σv as a mass proxy. We first note that the design of the MC comparison illustrated in the bottom-right panel of Fig. 3 addresses many of the concerns detailed below. Because each MC group inherits both the velocity dispersion and richness of its counterpart group in the data, a spurious separation between the observed large- and small-gap groups in Fig. 3 due to σv-related systematics would be inherited by the MC groups. Thus, in Fig. 3, the stronger separation in the data than in the MCs is unlikely to be due to systematic errors related to noisy velocity dispersion measurements.
We note, however, that our MC sample is unrealistic in the sense that it makes no distinction between central galaxies and satellite galaxies, in discord with well-tested models based on the conditional luminosity function formalism (e.g. Yang et al. 2007). Moreover, while this MC sample captures the basic features of the gap distribution remarkably well, it has been shown to fail to represent the magnitude gap distribution of our group sample in quantitative detail (Hearin et al. 2012). To address this shortcoming, we have performed a number of additional tests of possible σv-related systematics, which we now address in turn.
First, the two samples plotted in the bottom-right panel of Fig. 3 have different richness distributions, and so their velocity dispersions σv are not determined with equivalent accuracy. In particular, as the error in σv depends upon N, this may induce systematic differences between the measurements of the velocity dispersion of the groups in the two samples, potentially producing a spurious difference in the σv-N relation exhibited by small-gap and large-gap systems. To estimate the significance of this effect we have conducted the following exercise. For every group in each sample, we randomly select four members and use only these members to compute the velocity dispersion. We refer to the dispersion thus computed as the reduced velocity dispersion, σredv. For the small-gap system we find that the slope of the σv-N relation is slightly steeper than the σredv-N relation (as expected, since the σredv measurements are noisier than σv estimates), but the trend with gap persists at similar levels. Our conclusion remains unchanged: at fixed σredv, groups with a large magnitude gap have fewer members than groups with small values of m12.
Secondly, r-band absolute magnitudes Mr, of the galaxies in our sample have been estimated by using each galaxy's redshift. This introduces a correlation between σv and m12: groups with larger velocity dispersions have a greater uncertainty in Mr, which will tend to enhance the small- and large-gap tails of the magnitude gap distributions in groups with larger σv relative to groups with smaller σv. To test the significance of this effect, we have recomputed Mr for all the galaxies in our sample using the redshift of the group centroid and analysed the galaxy sample with adjusted absolute r-band magnitudes. We find that the change to all of our results is negligible, demonstrating that this is not an important source of systematic error in our analysis.
Thirdly, in calculating the velocity dispersion σv of each group we have made no distinction between central and satellite galaxies, even though it is expected that σv of centrals relative to the group is much lower than that of the satellites. This choice introduces an unphysical correlation between velocity dispersion and richness since the contribution of the central galaxy to σv decreases as the number of group members increases. To test for the significance of this effect, we repeated our analysis when only computing σv by using the satellite members of each group. Of course, we cannot unambiguously identify the galaxy closest to the potential minimum in each group, so we performed this test by assuming that the object with the largest r-band luminosity is the central galaxy. The analysis excluding the brightest galaxies within each group (as a proxy for the central galaxy) from the velocity dispersion estimate yielded results that differ only insignificantly from the primary analysis shown above. We conclude that this is not a significant source of systematic error in our results.
Fourthly, there remains the possibility than when binning on true mass, small-gap and large-gap groups could in fact have the same mean richness (that is, it could be that the true signal we are trying to measure is actually zero), but that the map between true mass and σv is different for large-gap and small-gap groups, inducing a spurious separation in N-σv relation. To test for the possible influence of a gap-dependent map between mass and σv, we use the mock catalogues studied in Section 4. To remind the reader, the groups in this exercise are the host haloes in the simulation, whose true mass is known. We begin with a sample of groups with a mass that is within 0.1 dex of some Mgroup, and divide this fixed-mass sample into two subsamples: groups with small (m12 < 0.2) and large (m12 > 1.5) gaps. We find that for all group masses in the range 1013 < Mgroup < 1014 M⊙, the large- and small-gap subsamples always have commensurable σvdistributions (verified by a KS-test with p-values > 0.2). This test confirms that the map between mass and σv is not itself gap dependent, so that using σv as a mass proxy and selecting m12-binned subsamples should not bias our mass–richness measurements.
Finally, we point out that a number of the potential systematics we have considered can be addressed if the data are binned on richness N rather than σv. For example, binning on richness eliminates the need to account for the effective σv cut induced by our richness cut (see previous paragraph). Additionally, the purpose of the MC comparison was to account for the statistical correlation between m12 and richness; binning on N eliminates the need for this comparison since, in this case, the m12-selected group samples are being compared at fixed richness.
We present the trend of the N-σv scaling relation with magnitude gap m12 in Fig. 4. Within each richness bin, small-gap groups have a richer Ndistribution than large-gap groups. To account for this effect, within each richness bin we randomly select subsamples of the small-gap groups with both a richness distribution and an LBCG distribution that matches that of the large-gap groups in that richness bin. We plot results for large-gap groups with red diamonds, and small-gap groups with a matched N and LBCG distributions with black triangles. We have binned evenly in log N over the range 3 ≤ N ≤ 21, where the upper bound on N is set by the largest richness exhibited by our m12 ≥ 1.5 group sample. Horizontal error bars in Fig. 4 (omitted from the plot of small-gap groups for visual clarity) indicate the boundaries of the richness bins, vertical error bars the error on the mean σv. Adding in quadrature the errors on σv from the two group samples, we find that the difference between the σv distribution exhibited by large- and small-gap groups is 3.0 σ discrepant from zero, with large-gap groups having larger velocity dispersions than small-gap groups at fixed richness. This provides an alternative demonstration that, at fixed richness, large-gap groups are more massive than small-gap groups, in keeping with our findings in which we bin instead on σv. As discussed in Section 6, a precise quantification of the improvement to cluster mass estimation provided by utilizing m12 information will require the exploration of this technique in a photometric sample, which we leave as a task for future work.
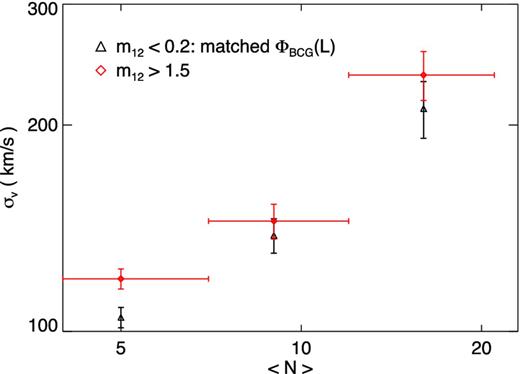
Alternative demonstration of the trend of the mass–richness relation with magnitude gap m12. This figure is analogous to the upper-left panel of Fig. 3, except here we bin our groups on richness N and measure the mean velocity dispersion 〈σv〉 in each richness bin. We plot results for large-gap groups with red diamonds, and small-gap groups with a matched LBCG distribution with black triangles. Horizontal error bars indicate the boundaries of the richness bins, vertical error bars the error on the mean σv in each richness bin. The large-gap groups exhibit larger velocity dispersions than small-gap groups at fixed richness, in keeping with the conclusions drawn from Fig. 3.
6 SUMMARY AND CONCLUSIONS
We have studied the improvement to group and cluster mass determination that may be reaped by exploiting the magnitude gap, m12, between the two brightest group and cluster members in addition to group richness, N. After fitting the mass–richness relation in our mock sample of simulated groups and clusters with a power law, we find a significant correlation between the magnitude gap and group mass residual, δ ln M ∝ 0.18 m12. The strength of this correlation is significant when compared to the scatter about our power-law fit, σ(δ ln M) = 0.33.
We see a similar trend in a volume-limited spectroscopic sample of galaxy groups observed in the SDSS. For group samples with different magnitude gaps, we find that large-gap groups have fewer members than small-gap groups at fixed σv. Reyes et al. (2008) recently suggested that using the luminosity of the BCG could aid in reducing scatter in cluster mass determinations. Similarly, we found that BCG luminosity is correlated with richness at fixed σv in our SDSS groups. By constructing appropriate random samples from the SDSS data, we were able to conclude that m12 contains information about group mass that is not contained in either richness or LBCG.
Our findings are closely related to a recent study by Paranjape & Sheth (2012), who employ a one-point statistical test to show that the abundance of galaxy groups in Mr19 as a function of magnitude gap is consistent with the distribution resulting from a set of random draws from a global luminosity function, implying that group mass is only related to m12 through mutual covariance with richness. Note, however, that Paranjape & Sheth (2012) also use a marked correlation function analysis to show that this conclusion cannot be entirely correct, and so it may not be surprising that our findings are in tension with their results that are based on one-point statistics.
Additionally, our results are in conflict with recent results claiming that the distribution of magnitude gaps is determined purely by richness. Proctor et al. (2011) claim that the fossil fraction, defined as the fraction of groups with m12 > 2, is purely a reflection of the abundance of low-richness systems. In demonstrating that groups with different magnitude gaps exhibit different relationships between σv and richness we have established that P(m12|σv, N) ≠ P(m12|N), explicitly showing that the magnitude gap is not strictly determined by richness.
We have demonstrated that, in principle, magnitude gap can inform cluster mass determination both in simple mock catalogues constructed from N-body simulations and in spectroscopic SDSS data; however, we leave the determination of the extent to which these relations may aid forthcoming cluster cosmology efforts as a subject of future work. Existing cluster cosmology samples differ from the group catalogues we have studied in several ways. For example, the maxBCG clusters (Koester et al. 2007) are selected using photometric (rather than spectroscopic) data with an independent algorithm that uses colour and i-band luminosity criteria. Additionally, the maxBCG clusters extend to higher luminosities and larger richnesses than our groups. Forthcoming cluster cosmology efforts with data from imaging surveys like the Dark Energy Survey (DES) will likewise identify clusters using photometric data and probe larger richnesses. Moreover, the richnesses of maxBCG clusters are defined according to a more complex optimization procedure than the richnesses of our groups (Koester et al. 2007; Rozo et al. 2009). We have analysed the Berlind et al. (2006) clusters because the cluster membership assignments for the maxBCG clusters are not publicly available. We do not anticipate the correlations that we point out here to be particularly strong functions of redshift or richness, but this will need to be tested more extensively both in mock catalogues and forthcoming data.
There are at least two distinct ways in which m12 may be exploited to tighten the relationship between group/cluster mass and richness. First, the magnitude gap could be treated on an equal footing with richness, so that rather than calibrating the mass as a one-dimensional function of richness one could instead treat the mass as a function of N and m12 simultaneously. Simulations coupled with detailed studies of extant and near-future data could provide parametrized forms for the m12-M relation with reasonable priors as they do now for the N-M relation. We studied the potential benefit of this approach in our mock group sample by comparing the difference in the scatter about the residual mass estimation between a one-dimensional linear regression on richness and a two-dimensional linear regression on richness and magnitude gap. We find that the scatter in the residuals δ ln M improves by ∼15–20 per cent when using a fit for mass as a function of N and m12 instead of N alone. While this improvement may seem modest, it comes at no additional observational cost, because the magnitude gap will always be available in the same data set used to measure the richness.
A second approach is suggested by the observation that the relationship between δ ln M and m12 in our mocks appears to be non-linear, with the systems having larger gaps appearing to be outliers in the mass–richness relation (see Fig. 2). The highest-gap systems have inordinately large masses at fixed richness. One may imagine utilizing gap information to identify significant outliers in the mass–richness relation. It may be possible to impose a cut on m12 and restrict consideration to groups and clusters with a modest magnitude gap (m12 ≲ 1.5) to calibrate the mass–richness relation. This may be particularly helpful in photometrically identified groups because interloper contamination will be more significant in the absence of spectroscopic redshifts, but interlopers can only reduce the magnitude gap, so large-gap systems will remain mass–richness outliers. Of course, the effect of any such cut on cluster abundance must be calibrated and accounted for, and this must be a subject for further work. In a forthcoming companion paper (Hearin et al. 2012), we study in detail the global abundance of groups and clusters as a function of m12 over a wide range of masses, providing precisely the information that would be required to carry out this second approach.
As we prepared to submit this paper for publication, we became aware of another paper (Wu et al. 2012) that studies some of the same material that we have addressed. In particular, they focused on the host halo with the most extreme difference between the Vmax value of the host and its largest subhalo, the N-body simulation analogue of a cluster with a very large magnitude gap. They found that this halo also appeared to be an outlier in many of the host halo properties they studied, including the number of subhaloes contained by the host. This finding appears to be in keeping with the second approach described above to using m12 in the calibration of the mass–richness relation.
However the calibration is conducted, our results suggest that the magnitude gap m12 contains information about cluster mass that is independent of both richness and LBCG, the luminosity of the brightest cluster member. Exploiting this additional information to improve existing optical tracers of cluster mass may improve the constraining power of optically identified galaxy clusters on cosmology.
We are grateful to Nick Battaglia, Ted Bunn, Surhud More, Eduardo Rozo and Anja Weyant for helpful discussions, and to Peter Behroozi and Risa Wechsler for making available the ROCKSTAR halo catalogues for the Bolshoi simulation. APH and ARZ are supported in part by the National Science Foundation (NSF) through grants NSF AST 0806367 and NSF AST 1108802. APH has been supported in part by the Pittsburgh Particle physics, Astrophysics and Cosmology Center (PITT PACC) at the University of Pittsburgh. AAB is supported by the Alfred P. Sloan Foundation, as well as the National Science Foundation through grant NSF-AST 1109789. JAN is supported by the United States Department of Energy Early Career programme via grant DE-SC0003960 and NSF AST grant 08-06732.
See also Skibba et al. (2011), who studied a closely related issue: the relative brightness of a group's most luminous satellite and central galaxy.
Note that in Section 5.3 we show that our results are unchanged by whether or not one assumes that the central group galaxy is at rest in the calculation of σv.
