


Abstract
Background: Screening mammography detects breast cancers earlier than those detected symptomatically, and so mammographically detected breast cancers tend to have better prognoses. The so-called stage shift that results from screen detection is subject to lead-time and length biases, and so earlier detection may not translate into longer survival. We used data from three large breast cancer screening trials—Health Insurance Plan (HIP) of New York and two Canadian National Breast Cancer Screening Studies (CNBSS)—to investigate survival benefits of breast cancer screening beyond stage shift. We also address whether method of detection is an independent prognostic factor in breast cancer. Methods: The HIP trial randomly assigned approximately 62 000 women to screening and control groups. The two CNBSS trial cohorts CNBSS-1 and CNBSS-2 included a total of 44 970 women in the screening group and 44 961 in the control group. After adjusting for stage and other tumor characteristics in a Cox proportional hazards model, survival distributions were compared by method of breast cancer detection with both univariate and multivariable analyses. All P values are two-sided. Results: Breast cancers detected by screening mammography had a shift in stage distribution to earlier stages (for HIP, P <.001; for CNBSS-1, P = .03; and for CNBSS-2, P <.001). After adjusting for tumor size, lymph node status, and disease stage in a Cox proportional hazards model, method of detection was a statistically significant independent predictor of disease-specific survival. Patients with interval cancers had a 53% (95% confidence interval [CI] = 17% to 100%) greater hazard of death from breast cancer than patients with screen-detected cancers, and patients with cancer in the control groups had a 36% (95% CI = 10% to 68%) greater hazard of death than patients with screen-detected cancer. Conclusion: There was an apparent survival benefit beyond stage shift for patients with screen-detected breast cancers compared with patients with breast cancers detected otherwise. Method of detection appears to be an important prognostic factor, even after adjusting for known tumor characteristics. This finding suggests that clinical trialists should routinely collect information about method of detection.
Breast cancer is the second leading cause of cancer death and the most frequently diagnosed cancer among North American women. Breast cancers detected via screening mammography or clinical breast examination have markedly better prognosis than those detected otherwise (i.e., symptomatically), in part because they are generally detected at an earlier stage ( 1 – 4 ) . However, at least part of this improvement is spurious because it is due to a lead-time bias (i.e., the time between when the tumor was detected by mammography and when the tumor would have been detected in the absence of screening) ( 1 ) . Another spurious component of the improvement is length bias, in which screening detects disproportionately more slowly growing tumors ( 5 , 6 ) .
Tumors detected by screening tend to be at an earlier stage of their development than those detected otherwise ( 2 , 3 ) , a phenomenon that is called stage shift. Tumors detected in screened women are more likely to be detected as stage I breast cancers; proportionately fewer of these cancers will have spread to the axillary lymph nodes than cancers detected otherwise. Because tumors detected earlier tend to be at an earlier disease stage, stage shift reflects lead-time bias. However, it is not known if the improved prognosis of a cancer patient whose tumor was detected by screening is fully explained by stage shift. The question is whether there is additional prognostic value in knowing method of detection given stage of disease, tumor size, lymph node status, and the woman's age at diagnosis.
The theoretical answer to this question is yes. Fixing the stage of the tumor (by comparing tumors at the same stage) reduces lead-time bias but does not eliminate it because there is a within-stage shift. But any residual effect of lead-time bias is likely to be small. More important is the possible impact of length bias. Fixing tumor stage and tumor size does not reduce the impact of length bias. Screen-detected tumors tend to grow more slowly than tumors detected otherwise. Thus, if a woman's tumor was detected mammographically, her tumor is more likely to be slowly growing. Consequently, this woman is likely to live longer than a woman whose tumor was detected otherwise ( 4 – 8 ) . Joensuu et al. ( 9 ) analyzed data in the Finnish Cancer Registry and found that women with screen-detected cancers have longer time to distant recurrence and live longer than women with cancers detected otherwise.
It is theoretically possible to eliminate length bias by adjusting for the aggressiveness of tumors on the basis of a full biological description of tumors including tumor grade, S-phase fraction, HER-2/neu status, family history, or other characteristics ( 10 – 12 ) . However, known biomarkers and tumor characteristics cannot fully explain the heterogeneity of tumors. Moreover, after Joensuu et al. ( 9 ) adjusted survival for tumor grade, HER-2/neu amplification, expression of TP53 and MK167, and other tumor biomarkers, they still found substantial residual prognostic value for method of detection. To better understand length bias, one should obtain as complete a profile of biological features of cancerous tumors as possible. The development of microarrays and elucidating the mechanism of carcinogenesis may make it possible to compile such a complete biological profile for breast tumors.
Several large randomized trials have addressed the possibility that screening provides a survival benefit ( 13 – 18 ) . Data from these trials can be used to study aspects of the natural history of breast cancer, in particular the extent to which the method of detection is relevant to assessing a patient's prognosis when her disease stage, tumor size, lymph node status, and age are known. In this study, we investigated whether and how breast cancer survival differs by method of detection, given the same tumor characteristics at diagnosis. We consider survival time from the diagnosis to death. We evaluate any potential prognostic advantage and quantify the benefit of early detection “beyond the stage shift.” That is, we address whether method of detection is an independent prognostic factor for breast cancer–specific survival.
D ATA S OURCES AND M ETHODS
Data Sources
We used data from three randomized screening trials: the Health Insurance Plan of New York trial (HIP) ( 19 ) and the two Canadian National Breast Screening Studies (CNBSS-1 and -2) ( 20 , 21 ) . Because the goal of our study was to evaluate survival by method of detection, we restricted our analyses to women detected with breast cancer during the first 5 years of the trials. This was the period when active screening examinations were offered to women who had been assigned to the screening arms and when information regarding method of detection was reliably recorded.
The HIP trial was the first randomized breast cancer screening trial. It was carried out in the 1960s. Approximately 62 000 women aged 40–64 years were randomly allocated equally to screening and control groups ( 13 , 19 , 22 ) . Independent clinical breast examination and mammography were offered to women in the screening group at the initial examination and at three additional annual reexaminations. The women in the control group followed “usual practice.” Tumors were classified from stage I (local disease) to stage IV (distant metastatic disease) ( 2 ) . A total of 608 women were diagnosed with breast cancers during the first 5 years of follow-up—307 in the screening group and 301 in the control group. The median follow-up was 16 years.
HIP investigators excluded women whose breast cancers had been diagnosed before entry into the study. These exclusions were determined differently in the two arms ( 22 ) . Women with preexisting cases of breast cancer were dropped from the screening group at the first scheduled visit. By design, control subjects and women who were randomly assigned to the screening arm but did not attend the first visit (referred to as nonattenders) did not have regular clinic visits, and so the pretrial cancer status of these patients was not routinely determined during the trial. Instead, exclusions for control subjects and nonattenders were made retrospectively. This difference in methodology has the potential for biasing in favor of screening when comparing breast cancer mortality between the two groups. However, there was no obvious bias regarding stage of disease. Because preexisting cancers were permanently excluded from the trial's database, we had no information about the stage of these women's cancers or about how many or which of these patients died of their disease.
The CNBSS trials consisted of two age cohorts at entry into the study in 1980: 40–49 years (CNBSS-1) and 50–59 years (CNBSS-2) ( 20 , 21 ) . Participants had no history of breast cancer and no mammograms in the previous 12 months. Each participant was randomly assigned to the screening group or to the control group. In CNBSS-1, the 25 235 women in the screening group were scheduled to receive four or five annual screening examinations, consisting of both clinical breast exam and mammography, and the 25 237 women in the control group had a clinical breast examination at the initial screening but no mammography. In CNBSS-2, 19 735 women were randomly assigned to the same screening schedule as in CNBSS-1, and 19 724 women were randomly assigned to the control group. In the first 5 years after randomization, 611 and 708 women were diagnosed with breast cancer in CNBSS-1 and CNBSS-2, respectively ( 14 , 15 ) . Median follow-up in the two studies was 12 years.
Data regarding pathologic stage, tumor size, lymph node status, and age at diagnosis are available for most of the women in these trials. In the HIP trial database, some noninvasive breast cancers—including intraductal, intraductal comedo, intraductal papillary, and lobular in situ—were classified as stage I disease ( 2 ) . In the CNBSS trials, stage was based on the tumor–node–metastasis (TNM) system ( 23 ) .
For this study, the methods of detection are defined as follows: Screen-detected breast cancers are those detected in the screening group as a result of a positive screen at a scheduled examination; interval/incident cancers are those that occur only in the screening group, with interval cancers defined as cancers clinically detected less than 1 year after the last negative screening examination, with incident cancers defined as those diagnosed more than 1 year after the last negative examination, and with control breast cancers defined as those diagnosed by any means in a control group.
Statistical Analysis Methods
We used data from the HIP and the two CNBSS trials to estimate stage distributions separately for screen-detected cancers and interval/incident cancers from the screening arm and for breast cancers in the control arms. To analyze the association between stage shift and method of detection, we used standard chi-squared tests. Our primary endpoint was time to breast cancer–specific death, as measured from the time of diagnosis; survival times of patients still alive or who died of other causes were censored as of the date of last follow-up. We estimated the Kaplan–Meier survival curves and used the log-rank test to test for differences in survival distributions depending on method of detection. We separated out method of detection as a prognostic factor for breast cancer–specific survival by use of a Cox proportional hazards model in which we adjusted for tumor and patient characteristics, including tumor size, lymph node status, age at diagnosis, and pathologic stage. Tumor size was categorized as small (≤2 cm) or large (>2 cm). Lymph node status was categorized as positive or negative. Pathologic stage was categorized as stage I, stage II, or stages III/IV. We checked the proportional hazards model assumption by use of methods based on martingale residuals ( 24 ) . All P values are two-sided. SPLUS version 6.0 (Insightful Corp., Seattle, WA) and SAS version 8.02 (SAS Institute, Cary, NC) software were used for the analyses.
R ESULTS
Stage Shift and Tumor Characteristics at Diagnosis
Although interval and incidence tumors may have some different biological features, our initial analyses did not show any statistically significant difference in breast cancer–specific survival by interval or incidence status. Thus, we combined interval and incidence breast cancers in the following analyses. In the three trials, we found a clear shift toward earlier stage in screen-detected cancers ( Table 1 ). In the HIP trial, about one-third (i.e., approximately 10 000) of the women who were randomly assigned to the screening arm did not attend any of the scheduled screening examinations, and breast cancer was diagnosed in 81 of these women during the first 5 years of the study ( 22 , 25 ) . Among women randomly assigned to screening, approximately 20 200 attended at least one screening examination, and breast cancer was diagnosed in 226 of them during the first 5 years. In the HIP trial, 76% of screen-detected breast cancers were in stage I, whereas 51% of interval/incident cancers, 43% of breast cancers in nonattenders, and 49% of breast cancers among control subjects were in stage I. Nonattenders and control subjects had the highest percentage of stage III/IV breast cancer, 22% and 14%, respectively. As expected, the stage distributions were statistically significantly different by method of detection ( P <.001).
Distribution of breast cancers in HIP, CNBSS-1, and CNBSS-2 *
| Trial | Screen-detected group | Interval/incident cancer group | Nonattender group | Control group | P† | |
|---|---|---|---|---|---|---|
| Analysis by Stage | ||||||
| HIP | ||||||
| Total No. randomly assigned ‡ | 20 200 | 9931 | 30 565 | |||
| I § , No. (%) | 100 (76) | 48 (51) | 35 (43) | 149 (49) | ||
| II, No. (%) | 26 (20) | 38 (40) | 26 (32) | 105 (35) | ||
| III/IV, No. (%) | 6 (4) | 7 (8) | 18 (22) | 41 (14) | ||
| Unknown, No. (%) | 0 | 1 (1) | 2 (3) | 6 (2) | ||
| Total No. cases | 132 | 94 | 81 | 301 | <.001 | |
| CNBSS-1 | ||||||
| Total No. randomly assigned | 25 235 | 25 237 | ||||
| In situ, No. | 46 | 11 | 28 | |||
| I, No. (%) | 115 (55) | 34 (40) | 109 (47) | |||
| II, No. (%) | 62 (30) | 33 (38) | 91 (39) | |||
| III/IV, No. (%) | 29 (14) | 19 (22) | 29 (13) | |||
| Unknown, No. (%) | 2 (1) | 3 (1) | ||||
| Total No. cases | 254 | 97 | 260 | .03 | ||
| CNBSS-2 | ||||||
| Total No. randomly assigned | 19 735 | 19 724 | ||||
| In situ, No. | 55 | 11 | 25 | |||
| I, No. (%) | 169 (62) | 34 (44) | 126 (47) | |||
| II, No. (%) | 79 (29) | 30 (38) | 96 (36) | |||
| III/IV, No. (%) | 18 (7) | 14 (18) | 46 (17) | |||
| Unknown, No. (%) | 5 (2) | 0 | 0 | |||
| Total No. cases | 326 | 89 | 293 | <.001 | ||
| Analysis by tumor characteristics | ||||||
| HIP | ||||||
| Size ≤2 cm, No. (%) | 46 (35) | 34 (36) | 28 (34) | 72 (24) | ||
| Size >2 cm, No. (%) | 47 (36) | 36 (38) | 24 (30) | 129 (43) | ||
| Unknown, No. (%) | 39 (29) | 24 (26) | 29 (36) | 100 (33) | .03 | |
| Lymph node–negative, No. (%) | 93 (70) | 47 (50) | 32 (40) | 136 (45) | ||
| Lymph node–positive, No. (%) | 30 (23) | 42 (45) | 33 (41) | 123 (41) | ||
| Unknown, No. (%) | 9 (7) | 5 (5) | 16 (19) | 42 (14) | <.001 | |
| Total No. cases | 132 | 94 | 81 | 301 | ||
| CNBSS-1 | ||||||
| Size ≤2 cm, No. (%) | 198 (78) | 66 (68) | 174 (67) | |||
| Size >2 cm, No. (%) | 54 (21) | 31 (32) | 83 (32) | |||
| Unknown, No. (%) | 2 (1) | 0 | 3 (1) | .02 | ||
| Lymph node–negative, No. (%) | 191 (75) | 60 (62) | 186 (71) | |||
| Lymph node–positive, No. (%) | 63 (25) | 36 (37) | 72 (28) | |||
| Unknown, No. (%) | 0 | 1 (1) | 2 (1) | .06 | ||
| Total No. cases | 254 | 97 | 260 | |||
| CNBSS-2 | ||||||
| Size ≤2 cm, No. (%) | 266 (82) | 68 (76) | 196 (67) | |||
| Size >2 cm, No. (%) | 57 (17) | 21 (24) | 97 (33) | |||
| Unknown, No. (%) | 3 (1) | 0 | 0 | <.001 | ||
| Lymph node–negative, No. (%) | 256 (78) | 56 (63) | 196 (67) | |||
| Lymph node–positive, No. (%) | 67 (21) | 33 (37) | 97 (33) | |||
| Unknown, No. (%) | 3 (1) | 0 | 0 | <.001 | ||
| Total No. cases | 326 | 89 | 293 | |||
HIP = Health Insurance Plan; CNBSS = Canadian National Breast Cancer Screening Studies.
P value is from the chi-squared statistic that tests the overall association between stage and method of detection among invasive cancer only. All statistical tests were two-sided.
Total number of participants who were randomly assigned in HIP [see pp. 21–22 in Shapiro et al. ( 22 ) ].
Among invasive breast cancers in CNBSS-1, 55% of screen-detected cancers, 40% of interval/incident cancers, and 47% of breast cancers in the control group were in stage I. The corresponding percentages in CNBSS-2 were 62%, 44%, and 47%. Among the three methods of detection, interval/incident cancers had the highest percentage of stage III/IV breast cancer: 22% for CNBSS-1 and 18% for CNBSS-2. The association between stage and method of detection was statistically significant for CNBSS-1 ( P = .03) and for CNBSS-2 ( P <.001). Stage distributions in each of two CNBSS trials had similar patterns ( Table 1 ); however, among screen-detected cancers, the percentages of stage I and of in situ carcinomas were higher in the older cohort (i.e., CNBSS-2) than in the younger cohort (i.e., CNBSS-1).
The distribution of tumor sizes by method of detection is shown in Table 1 . In the HIP trial, although the tumor sizes for about one-third of the breast cancers were missing, the overall association between tumor size and method of detection was statistically significant ( P = .03). For the CNBSS trials, the proportion of smaller tumors (≤2 cm in diameter) was larger in the screen-detected group than in interval/incident groups or in the control group ( P = .02 for CNBSS-1 and P <.001 for CNBSS-2). Among tumors diagnosed in the control group, smaller tumors (≤2 cm) were half as common as larger tumors in the HIP trial, but smaller tumors were twice as common as larger tumors in both CNBSS trials.
The distribution of lymph node status by method of detection is shown in Table 1 . In the HIP trial, there was a statistically significantly higher proportion of lymph node–negative breast cancers among screen-detected cancers than among those diagnosed otherwise ( P <.001). The CNBSS trials showed a similar association ( P = .06 for CNBSS-1 and P <.001 for CNBSS-2). Again, overall, patients with tumors in HIP had worse prognoses, in that the proportion of lymph node–positive tumors was greater.
Survival by Method of Detection
We found no difference in survival among the 81 breast cancer diagnosed among nonattenders in the screening arm and the 301 diagnosed in the control arm of HIP. Because breast cancers in nonattenders were, like those in the control arm, also detected on the basis of symptoms, we combined them with breast cancers detected in the control group for the following survival analyses. Women whose breast cancers were detected by screening had the longest survival among the three groups: screen-detected, interval/incident cancer, and control groups ( Fig. 1 ). This result was expected because the comparison of survival time would be affected by lead time and other biases. To minimize lead-time bias in the following analyses, we compared survival distributions by method of detection for patients whose breast cancers had the same stage and other tumor characteristics.
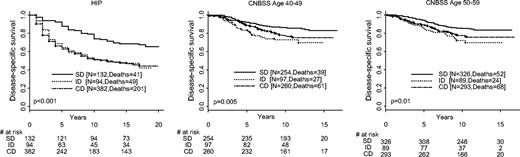
Disease-specific survival distribution by method of detection. Results from the three trials are labeled. Deaths refer to deaths from breast cancer. HIP = Health Insurance Plan; CNBSS = Canadian National Breast Cancer Screening Study; SD = screen-detected cancer; ID = interval/incident cancer; CD = cancer detected control group. All statistical tests are two-sided.
Stage of Disease
Figure 1 shows a large survival advantage for patients with screen-detected cancers. Part of this advantage is due to stage shift. We then removed the stage shift by fixing stage ( Fig. 2, A for HIP and Fig. 2, B for the CNBSS trials). The survival advantage of screen detection remains, but it is not as large. Although the difference is clear, the comparisons are not all statistically significant within the various subsets, perhaps because of small sample sizes.
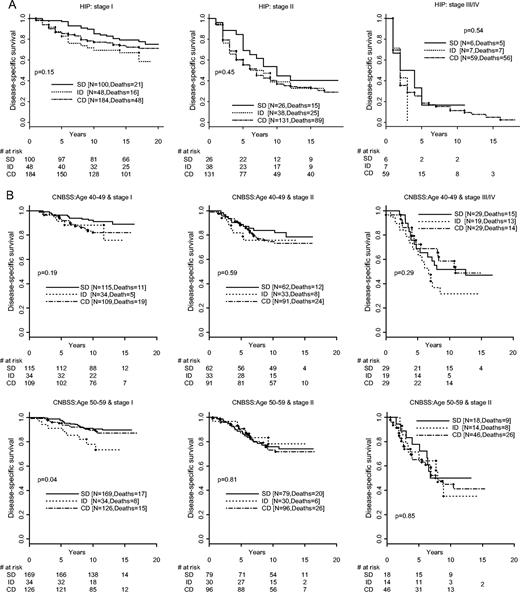
Disease-specific survival distributions by stage and method of detection. A ) Health Insurance Plan (HIP) Trial. SD = screen-detected cancer; ID = interval/incident cancer; CD = cancer detected control group. All statistical tests are two sided. B ) The Canadian National Breast Cancer Screening Study (CNBSS) Trials. SD = screen-detected cancer; ID = interval/incident cancer; CD = cancer detected control group. All statistical tests are two-sided.
Lymph Node Status
The results of fixing lymph node status were similar to those of fixing stage and tumor size ( Fig. 3 ). Namely, women with screen-detected tumors generally had longer survival than those diagnosed otherwise for both lymph node–positive and lymph node–negative diseases. However, given lymph node status, the differences in survival by method of detection were statistically significant only among lymph node–negative patients in both CNBSS trials ( P = .002 for CNBSS-1 and P = .003 for CNBSS-2).
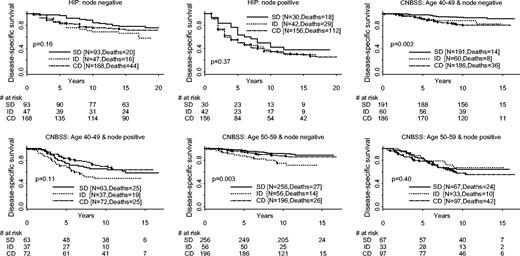
Disease-specific survival distributions by lymph node status and method of detection. Results from the three trials are labeled. HIP = Health Insurance Plan; CNBSS = Canadian National Breast Cancer Screening Study; SD = screen-detected cancer; ID = interval/incident cancer; CD = cancer detected control group. All statistical tests are two-sided.
Tumor Size
The comparisons of survival distributions by fixing tumor size were similar to those of fixing stage. Given a small tumor size at diagnosis (≤2 cm), patients with screen-detected breast cancers had somewhat longer survival than those diagnosed otherwise ( Fig. 4 ). The differences in survival by method of detection were not statistically significant for patients having a large tumor at diagnosis (>2 cm).
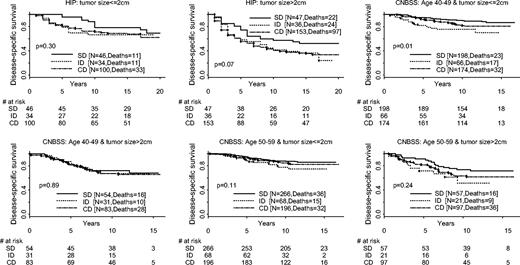
Disease-specific survival distributions by tumor size and method of detection. Results from the three trials are labeled. HIP = Health Insurance Plan; CNBSS = Canadian National Breast Cancer Screening Study; SD = screen-detected cancer; ID = interval/incident cancer; CD = cancer detected control group. All statistical tests are two-sided.
Multivariable Analyses
The results of univariate and multivariable analyses of Cox proportional hazards models comparing screen-detected breast cancers with interval/incident cancer and with cancers in the control group are shown in Table 2 . The multivariable model adjusted for tumor stage within each trial. The relative risks (RRs) of breast cancer death are similar in the HIP and CNBSS trials, either with or without adjusting for tumor characteristics. Therefore, we combined all three trials and used a model with a fixed trial effect for HIP and CNBSS as a covariate. Age at diagnosis was not statistically significantly associated with survival in these multivariable models after adjusting for tumor characteristics. The adjusted relative risk of breast cancer death was 53% (95% CI = 17% to 100%) greater for patients with interval/incident cancer than for those with screen-detected cancer. The adjusted relative risk of breast cancer death was 36% (95% CI = 10% to 68%) greater for patients with breast cancers in the control group than for those with screen-detected cancers. These relative risks were estimated across all stages, with higher stages having greater relative risks. The hazard of breast cancer death for patients with interval/incident cancers was not statistically significant different from that for patients with breast cancers in the control group. We also carried out a multivariable analysis including interactions between method of detection and disease stage at diagnosis. These interactions were not statistically significant, perhaps because of the small number of patients diagnosed with breast cancer in stages III or IV, and thus they were not included in the final models of Table 2 .
Relative risks (RRs) of breast cancer death in the univariate and multivariable analyses among patients with invasive cancer *
| Unadjusted | Covariate-adjusted † | |||||
|---|---|---|---|---|---|---|
| Trial | RR (95% CI) | P | RR (95% CI) | P | ||
| HIP | ||||||
| Method of detection | ||||||
| Interval/incident cancer vs. screen-detected | 2.14 (1.41 to 3.24) | <.001 | 1.64 (1.07 to 2.50) | .02 | ||
| Control vs. screen-detected | 2.21 (1.58 to 3.09) | <.001 | 1.39 (0.99 to 1.97) | .06 | ||
| Stage | ||||||
| II vs. I | 3.50 (2.65 to 4.64) | <.001 | ||||
| III/IV vs. I | 11.53 (8.22 to 16.18) | <.001 | ||||
| CNBSS-1 and -2 | ||||||
| Method of detection | ||||||
| Interval/incident cancer vs. screen-detected | 2.06 (1.46 to 2.96) | <.001 | 1.49 (1.04 to 2.14) | .03 | ||
| Control vs. screen-detected | 1.61 (1.23 to 2.11) | <.001 | 1.29 (0.98 to 1.71) | .07 | ||
| Stage | ||||||
| II vs. I | 2.02 (1.49 to 2.74) | <.001 | ||||
| III/IV vs. I | 5.66 (4.13 to 7.75) | <.001 | ||||
| HIP and CNBSS | ||||||
| Method of detection | ||||||
| Interval/incident cancer vs. screen-detected | 2.33 (1.80 to 3.03) | <.001 | 1.53 (1.17 to 2.00) | <.001 | ||
| Control vs. screen-detected | 2.22 (1.81 to 2.71) | <.001 | 1.36 (1.10 to 1.68) | .002 | ||
| Trial effect | ||||||
| HIP vs. CNBSS | 2.94 (2.45 to 3.52) | <.01 | ||||
| Stage | ||||||
| II vs. I | 2.79 (2.27 to 3.43) | <.001 | ||||
| III/IV vs. I | 8.25 (6.54 to 10.4) | <.001 | ||||
CI = confidence interval; HIP = Health Insurance Plan; CNBSS = Canadian National Breast Cancer Screening Studies.
Multivariable analyses adjusted for stage variables in the individual trials, and adjusted for both stage variables and trial effect in the combined analysis.
D ISCUSSION
We found that method of detection is an important prognostic factor for breast cancer survival, even after adjusting for known tumor characteristics. By considering data from the HIP and CNBSS trials, both individually and combined, we found a survival benefit beyond stage shift for patients with screen-detected breast cancers compared with those with breast cancers detected otherwise. After adjusting for tumor stage, patients with interval/incident cancers had a 53% (95% CI = 17% to 100%) greater hazard of breast cancer death than patients with screen-detected breast cancers, and patients with cancers in the control groups had a 36% (95% CI = 10% to 68%) greater hazard of breast cancer death than patients with screen-detected cancers. Method of detection remained an independent predictor of overall survival in the covariate-adjusted model: Patients with interval/incident cancer had a 39% (95% CI = 9% to 78%) greater hazard of breast cancer death than patients with screen-detected cancers, and patients with cancers detected in the control groups had a 31% (95% CI = 8% to 58%) greater hazard of breast cancer death than those with screen-detected cancers. Our conclusions support those from the Finnish Cancer Registry ( 9 ) in showing that method of detection is an independent prognostic factor. In the Finnish study, there was an overall 63% (95% CI = 2% to 160%) reduction in risk of death after accounting for number of positive lymph nodes, tumor size, patient age, hormone receptor status, histological grade, and also the expression of ERBB2, TP53, and MK167 and the amplification of ERBB2.
There are several limitations of our study. First, the HIP and CNBSS trials are relatively old. Data regarding ER status, HER2 status, and the status of modern biomarkers such as the expression of ERBB2, TP53, and MK167 and the amplification of ERBB2 ( 9 ) were not available in the HIP and CNBSS trials. Second, mammographic techniques were those of the 1960s and 1980s in HIP and CNBSS, respectively, and our conclusions might not apply for modern techniques. Finally, treatment options in the HIP and CNBSS trials are different from those provided to breast cancer patients today. Modern medical management may affect the prognostic importance of method of detection, although the direction of any modification is not clear.
There were several important differences in the designs of and circumstances of the HIP and CNBSS trials that may account for some of the differences that we observed between the trials. One is that the control arms were different. In HIP, women in the control arm received usual care. In CNBSS-1, women in the control arm received an initial clinical breast examination. In CNBSS-2, control women received an annual clinical breast examination. Some studies suggest that clinical breast examination plays a role in the early detection of breast cancer ( 26 – 29 ) . If so, the differences between the control and screening arms may be reduced. In contrast to CNBSS, in which there were no nonattenders, nonattenders made up about one-third of the HIP screening group. Moreover, the differences in assessment of whether cancers were preexisting potentially confound our conclusions in the HIP trial. The difference in assessment procedure may explain why the numbers of breast cancer cases detected in the first 5 years of the HIP trial were similar in the screening (i.e., 307 breast cancers) and control (i.e., 301 breast cancers) groups. Because screening detects cancer early, one would expect more cancers in the screened groups than in the control groups, such as the 39% more breast cancers observed in the CNBSS trials (766 cancers in screened group versus 553 in the control group). Another difference is that the HIP and CNBSS studies were conducted in different periods. The intervening time saw some improvements in adjuvant chemotherapy and hormonal therapy and in screening technology, and patients in CNBSS had the opportunity to take advantage of such improvements. This opportunity may explain some of the differences in survival between HIP and CNBSS. Finally, the tumor staging system used in HIP was slightly different from the TNM system used in CNBSS.
In all of these trials, we considered interval cancers separately from cancers found in the control groups. Interval cancers are a heterogeneous group of cancers and include those occurring after the last negative screening examination and those missed on previous screening examinations. Nevertheless, we found similar survival distributions for interval/incident cancers and cancers detected in the control groups. Other researchers have found that interval cancers have better prognosis than cancers in control groups ( 30 ) , and still others have found that interval cancers are more aggressive and have worse prognosis ( 10 , 11 , 31 – 34 ) .
The prognosis of cancer patients depends on characteristics of the tumor at diagnosis. In early stages (i.e., stages I and II) of breast cancer, characteristics that are important for determining prognosis include tumor grade, hormone receptor status, and status of other biomarkers, as well as tumor size and axillary lymph node involvement. Because method of detection as a prognostic factor is mediated through stage shift, the method of detection may not have independent prognostic utility. Comparing time to breast cancer death from diagnosis between cancers detected via screening and those detected otherwise is subject to two main types of bias: lead-time bias and length bias ( 6 , 35 ) . Because lead time manifests itself as earlier stage of disease, fixing the stage of disease reduces the magnitude of lead-time bias. There may be a shift within stage, and so the comparison within a given stage may not completely eliminate lead-time bias. Moreover, such adjustment has little or no affect on length bias. Cancers found via screening include a higher proportion of slowly growing tumors, some of which might never be found by other means—which is an extreme form of length bias called overdiagnosis bias. In this article, we quantified the residual lead-time bias and length bias beyond stage shift that is associated with breast cancer screening and that is still present after adjusting stage of disease. Some recent studies indicate that the disease prognosis may be predestined at the time of diagnosis, independent of the tumor characteristics at diagnosis ( 36 , 37 ) . The additional biological characteristics (such as growth and prognosis) are potentially critical factors to determine the aggressiveness of a tumor and, thus, could be used to further quantify the length bias. It is possible—indeed, likely—that, given a complete profile of biologic characteristics of a tumor, the method of detection would not be an independent prognostic factor in predicting breast cancer–specific survival.
Some evidence that our results apply to the modern era of mammographic techniques, chemotherapy, and hormonal therapy is provided by our model presented in Cancer Intervention and Surveillance Modeling Network (CISNET at http://cisnet.cancer.gov ) ( 38 ) . The objective of this model is to apportion the drop in breast cancer mortality observed in the United States between 1990 and 2000 to treatment improvements and screening. The model uses the dissemination of screening mammography, dissemination of tamoxifen, chemotherapy from 1975 through 2000, and information about the benefits of each. We could not duplicate the observed drop in breast cancer mortality by incorporating the benefit of mammography as a function of its stage shift alone. However, we found an excellent fit when we incorporated parameters to allow for the possibility of an added benefit beyond stage shift.
The observation that the method of detection is independently prognostic has important research and clinical implications. Physicians should know that their patients whose breast cancers are detected by screening have improved prognoses simply because of method of detection. This result leads to a paradox. A woman whose nonmetastatic tumor was detected on a mammogram has reason to be happier than a woman who had a tumor with the same characteristics that was detected symptomatically. The paradox is that this result does not mean screening is beneficial. Without screening, some of the women would not have been diagnosed with breast cancer at all. Some of these women might be harmed by not knowing they have the disease, but others would be better off not knowing. (The mortality benefit of screening can be properly assessed only by randomized trials, such as HIP and CNBSS, in which follow-up starts at randomization and not at diagnosis.)
Breast cancer is a heterogeneous disease. Understanding and adjusting for known factors that affect this heterogeneity make it easier to find other prognostic factors. For example, in a treatment clinical trial, accounting for important prognostic factors enables a more precise estimation of treatment effect and stronger conclusions to be drawn about any interactions between therapy and potential prognostic factors, such as biomarkers. However, the method of detection is not routinely reported or even collected in breast cancer clinical trials. Our study supports a suggestion made by Joensuu et al. ( 9 ) , that case report forms and research databases also include the method of detection. In retrospective chart reviews, it is not always possible to determine whether a mammogram was for screening or diagnosis. Alerting researchers to the importance of this difference will improve the accuracy of such records.
Supported by NCI grants U01 CA-088278 and R01 CA-79466.
References
Shapiro S, Goldberg JD, Hutchinson GB. Lead time in breast cancer detection and implications for periodicity of screening.
Chu KC, Smart CR, Tarone RE. Analysis of breast cancer mortality and stage distribution by age for the Health Insurance Plan clinical trials.
Connor RJ, Chu KC, Smart CR. Stage-shift cancer screening model.
Albert A, Gertman PM, Louis TA, Liu SI. Screening for the early detection of cancer—II. The impact of screening on the natural history of the disease.
Kramer BS, Gohagan JK, Prorok PC. Cancer screening: theory and practice. New York (NY): Marcel Dekker;
Otto SJ, Fracheboud J, Looman CW, Broeders MJ, Boer R, Hendriks JH, et al. Initiation of population-based mammography screening in Dutch municipalities and effect on breast-cancer mortality: a systematic review.
Tabar L, Yen MF, Vitak B, Chen HH, Smith RA, Duffy SW. Mammography service screening and mortality in breast cancer patients: 20-year follow-up before and after introduction of screening.
Joensuu H, Lehtimaki T, Holli K, Elomaa L, Turpeenniemi-Hujanen T, Kataja V, et al. Risk for distant recurrence of breast cancer detected by mammography screening or other methods.
Heuser LS, Spratt JS, Kuhns JG, Chang AF, Polk HC Jr, Buchanan JB. The association of pathologic and mammographic characteristics of primary human breast cancers with ‘slow’ and ‘fast’ growth rates and with axillary lymph node metastases.
Hakama M, Holli K, Isola J, Kallioniemi OP, Karkkainen A, Visakorpi T, et al. Aggressiveness of screen-detected breast cancer.
Petersen GM, Parmigiani G, Thomas D. Missense mutations in disease genes: a Bayesian approach to evaluate causality.
Shapiro S. Periodic screening for breast cancer: The HIP randomized controlled trial.
Miller AB, To T, Baines CJ, Wall C. Canadian National Breast Screening Study: update on breast cancer mortality.
Miller AB, To T, Baines CJ, Wall C. Canadian national breast screening study-2: 13-year results of a randomized trial in women aged 50–59 years.
Miller AB, To T, Baines CJ, Wall C. Canadian national breast screening study-1: breast cancer mortality after 11 to 16 year of follow-up. A randomized screening trial of mammography in women aged 40-49 years.
Nystrom L, Andersson I, Bjurstam N, Frisell J, Nordenskjold B, Rutqvist LE. Long-term effects of mammography screening: updated overview of the Swedish randomized trails.
Alexander FE, Anderson TJ, Brown HK, Forrest AP, Hepburn W, Kirkpatrick AE, et al. The Edinburgh randomised trial of breast cancer screening: results after 10 years of follow-up.
Shapiro S, Strax P, Venet L. Evaluation of periodic breast cancer screening with mammography.
Miller AB, Baines CJ, To T, Wall C. Canadian national breast screening study: 1. Breast cancer detection and death rates among women aged 40-49 years.
Miller AB, Baines CJ, To T, Wall C. Canadian national breast screening study: 2. Breast cancer detection and death rates among women aged 50-59 years.
Shapiro S, Venet W, Strax P, Venet L. Periodic screening for breast cancer. The health insurance plan project and its sequelae. Baltimore (MD): Johns Hopkin University Press;
Fleming ID, Cooper IS, Henson DC (editors) . American Joint Committee on Cancer Staging Manual, 5th ed. Philadelphia (PA): Lippincott Williams & Wilkins;
Therneau TM, Grambsch PM. Modeling survival data: extending the Cox model. New York (NY): Springer;
Connor RJ, Eng D, Prorok PC. Issues in the mortality analysis of randomized controlled trials of cancer screening.
Baines CJ, Miller AB, Bassett AA. Physical examination. Its role as a single screening modality in the Canadian national breast screening study.
Baines CJ. Screening for breast cancer: how useful are clinical breast examinations?
Bobo JK, Lee NC, Thames SF. Findings from 752 081 clinical breast examinations reported to a national screening program from 1995 through 1998.
Shen Y, Zelen M. Screening sensitivity and sojourn time from breast cancer early detection clinical trials: mammograms and physical examinations.
Tabar L, Chen HH, Fagerberg G, Duffy SW, Smith TC. Recent results from the Swedish two-county trial: the effects of age, histologic type and mode of detection on the efficacy of breast cancer screening.
Holland R, Mravunac M, Hendriks JH, Bekker BV. So-called interval cancers of the breast. Pathologic and radiologic analysis of sixty-four cases.
Brekelmans CT, van Gorp JM, Peeters PH, Collette HJ. Histopathology and growth rate of interval breast carcinoma. Characterization of different subgroups.
Porter PL, El-Bastawissi AY, Mandelson MT, Lin MG, Khalid N, Watney EA, et al. Breast tumor characteristics as predictors of mammographic detection: Comparison of interval- and screen-detected cancers.
Gilliland FD, Joste N, Stauber PM, Hunt WC, Rosenberg R, Redlich G, et al. Biologic characteristics of interval and screen-detected breast cancers.
Duffy SW, Hill C, Esteve J. Quantitative methods for the evaluation of cancer screening. London (UK): Arnold;
Lacroix M, Toillon RA, Leclercq G. Stable portrait of breast tumors during progression: data from biology, pathology and genetics.

