


Abstract
The retinal degeneration 7 (rd7) mouse is a naturally occurring model of enhanced S-cone syndrome, Goldman-Favre syndrome and clumped pigmentary retinopathy in humans, allelic disorders caused by inactivation of a photoreceptor-specific nuclear hormone receptor, NR2E3. We show here that the rd7 mutation arose from the antisense insertion of a long interspersed nuclear element (LINE-1) (or L1) into exon 5 of the mouse Nr2e3 gene. L1 insertion blocks splicing of Nr2e3 intron 5 by separating an inefficient splice donor from essential splicing enhancers within exon 5, with the result that incompletely spliced transcripts accumulate to high levels at the mutant Nr2e3 locus in photoreceptor nuclei. The high efficiency of transcription through the 7 kb L1 was unexpected and led us to compare the effect on transcript abundance of sense or antisense L1 insertions in transfected cells. In a variety of sequence contexts antisense L1 insertions had little or no effect on transcript levels or the production of full-length transcripts, whereas sense L1 insertions reduced transcript levels from several-fold to more than 10-fold. A bioinformatic analysis of all mouse L1s shows a ∼2-fold under-representation of L1s in introns when compared with bulk genomic DNA, and, within introns, a further ∼2-fold under-representation of sense when compared with antisense L1s. Interestingly, there is no evidence for orientation-specific positive or negative selection within any subregions of the L1 element. These data suggest that L1s have evolved to present the host transcriptional machinery with a minimally disruptive profile in the antisense orientation such that antisense intronic L1s often escape purifying negative selection.
INTRODUCTION
Members of the long interspersed nuclear element (LINE-1) (or L1) family of retrotransposons are the most abundant genomic parasites in mammalian DNA, accounting for ∼20% of typical mammalian genomes (1–4). By analogy with host–parasite interactions in other contexts, it seems reasonable to expect that genomic parasites have evolved mechanisms to promote their continued existence while minimally decreasing the fitness of their hosts. In this article, we describe a series of experiments that began with the discovery and mechanistic dissection of an L1-mediated spontaneous mutation in the mouse and that led to the identification of one such evolutionary mechanism: the near invisibility—with respect to levels of target gene expression—of L1 elements that are inserted into introns in the antisense orientation in a variety of contexts. In contrast, L1 insertion into introns in the sense orientation generally causes a substantial decrease in transcript abundance. These different consequences for cellular gene expression likely account for the ∼2-fold greater abundance of antisense versus sense L1 elements within introns in mammalian genomes.
The work described here began with a molecular analysis of the rd7 mouse, a naturally occurring model for hereditary retinal degeneration that is characterized by retinal folds and late onset retinal degeneration (5). The rd7 retina has been intensively studied as a model of aberrant cell fate determination because it exhibits ectopic S (short wavelength) opsin expressing cells and misexpression of multiple cone-specific genes in rods (6–10). The phenotype of the rd7 mouse resembles enhanced S cone syndrome (ESCS), a human retinal dystrophy characterized by increased sensitivity to short wavelength light (11–13). ESCS patients, as well as patients with Goldman-Favre syndrome and some patients with clumped pigmentary retinal degeneration, carry mutations in the NR2E3 gene, which codes for a photoreceptor-specific nuclear receptor (also known as PNR) (14–17).
The rd7 defect maps genetically to the mouse orthologue of NR2E3 and it was previously reported to arise from multiple mutations in exon 5 as well as deletion of part of exon 4 and all of intron 4 in the mouse Nr2e3 gene (5,6). We recently reported the accumulation of a ∼9 kb photoreceptor-specific Nr2e3 transcript specifically in rd7/rd7 and rd7/+ retinas (hereafter referred to as the ‘rd7 transcript’) at an abundance that is more than 10-fold greater than that of the mature ∼1.5 kb WT Nr2e3 transcript (7). This observation cannot be easily reconciled with the structure of the rd7 allele described earlier, and it is in contrast with previous reports that no Nr2e3 transcripts are detectable in the rd7/rd7 retina (5,6). The work reported below began with the goal of resolving these issues.
RESULTS
A L1 retrotransposon insertion in the rd7 allele
To define the structure of the rd7 allele and the unusual rd7 transcript, a genomic phage library was constructed from rd7/rd7 mouse DNA and screened with a probe corresponding to the coding region of Nr2e3. Surprisingly, restriction mapping and DNA sequencing showed that the nine hybridizing phage clones were derived from two distinct genomic loci. Five of the nine clones come from chromosome 15q and contain an intronless Nr2e3-homologous sequence (GenBank AC144772: bp 145826–146888). This sequence differs from the bona fide Nr2e3 sequence by the presence of numerous small alterations that include those previously reported as responsible for the rd7 mutation [Fig. 1A and B; (5,6)]. The intronless structure and the pattern of mutations argue that this Nr2e3-related sequence is a processed pseudogene that arose via reverse transcription. The same pseudogene was also identified in genomic phage clones from 129sv/J (data not shown). Whole genome Southern blotting independently confirms its presence in both 129sv/J and C57BL/6 mice (Fig. 1D). [The rd7 mouse is a C57BL/6 congenic strain.] A BLAST search reveals no evidence for Nr2e3 pseudogenes in the human or rat genomes, and whole genome Southern blotting of rat DNA also shows no evidence for an Nr2e3 pseudogene (data not shown). Most likely, the Nr2e3 pseudogene arose in the common ancestor of extant mouse strains prior to the appearance of the rd7 mutation. The Nr2e3 pseudogene lacks Nr2e3 promoter sequences and is probably not expressed in the retina, as we see no evidence of pseudogene-derived transcripts in mouse retina RNA either by blotting or RT–PCR (Fig. 2A and data not shown).
![Structure of the rd7 allele. (A) Genomic structure of the Nr2e3 pseudogene (Pseudo), the WT Nr2e3 allele (WT) and the rd7 allele (rd7). Sequences in the Nr2e3 pseudogene that are homologous to the Nr2e3 cDNA are shown in red. Exons of the WT and rd7 alleles are represented by red boxes, with exons 1, 5 and 8 numbered under the WT allele. In the rd7 allele, exon 5 is split by the insertion of a full-length L1 (blue symbols) in the antisense orientation. The L1 consists of a 5′-UTR containing a tandem repeat of six approximately 200-bp sequences, ORF1 and ORF2 (arrows) and a poly(A) tail (An). The positions of the inserts from four overlapping rd7 genomic phage clones and the cDNA segment (containing exons 2–4 and part of exon 5) that was used as a probe for whole genome Southern blotting [panel (D)] are represented by gray lines below the rd7 map. B: BamHI. (B) Genomic structure [enlarged from panel (A)] showing Nr2e3 exons 4 and 5 and the positions of the primers (arrows) used in PCR genotyping [see panel (E)]. s: sense; as: antisense. A single base mismatch between each primer and the pseudogene template is represented by a bump in the arrow representing the primer. Thin lines between the three genomic maps align corresponding sequences. The L1 is represented as a discontinuous blue line. (C) Sense strand sequences at the sites of L1 insertion. From top to bottom: the WT Nr2e3 allele (WT), the rd7 allele (rd7) and the parent L1 on chromosome 4. Nr2e3 sequences are in red with the duplicated target site underlined; antisense L1 sequences (including the 3′ poly(A) tract; TTTT…) are in blue; 5′ transduced sequences from chromosome 4 are in green; and chromosome 4 sequences that flank the donor L1 element are in black. (D) Southern blot of BamHI digested genomic DNA from C57BL6 WT (+/+), rd7/+, rd7/rd7 and 129sv/J (129) mice using the exon 2–5 probe shown in (A). The predicted sizes of the pseudogene, WT and rd7 fragments are indicated by arrows to the left of the blot. Size marker indicated to the right of the blot (from top to bottom): 4.0, 3.0 and 2.0 kb. (E) PCR on tail DNA from mice of the indicated genotypes using the primers shown schematically in (B). The predicted sizes of the pseudogene and WT Nr2e3 PCR products are indicated by arrows to the left of the blot. The identities of both PCR products were confirmed by sequencing them.](https://oup.silverchair-cdn.com/oup/backfile/Content_public/Journal/hmg/15/13/10.1093/hmg/ddl138/2/m_ddl13801.jpeg?Expires=1716396214&Signature=TnvNEj0C37OrjfmCwCi8E2PQrv1p6vXrXYEm9fv3cbEoTCXo1xAuVgasFFnjm9Ni2vmXxbOzC8V7wS9brM8mj9ExvARSRYftlkrqSBJ5KFmw4H5uSPtIni4AHeQI5O-~IaLUxX-OWEnMTXbKJ1efErmip73lr01NGfx4vo0tM60pfPl1utkSALWGk-Rr84yUxdkrP1F-SjK3cqTOM~ISLTiQR~07wfA1JiRbOZe06UP9WaiMszfRFax4eRY8NsiGD728XuQFPskQw7qUaWelGIcgnnp4qEWv2E2NcNSjbMNgMeFJ87XW8xVMz75SjDybZPBVqXbV2dMiq~Si9JQ10g__&Key-Pair-Id=APKAIE5G5CRDK6RD3PGA)
Structure of the rd7 allele. (A) Genomic structure of the Nr2e3 pseudogene (Pseudo), the WT Nr2e3 allele (WT) and the rd7 allele (rd7). Sequences in the Nr2e3 pseudogene that are homologous to the Nr2e3 cDNA are shown in red. Exons of the WT and rd7 alleles are represented by red boxes, with exons 1, 5 and 8 numbered under the WT allele. In the rd7 allele, exon 5 is split by the insertion of a full-length L1 (blue symbols) in the antisense orientation. The L1 consists of a 5′-UTR containing a tandem repeat of six approximately 200-bp sequences, ORF1 and ORF2 (arrows) and a poly(A) tail (An). The positions of the inserts from four overlapping rd7 genomic phage clones and the cDNA segment (containing exons 2–4 and part of exon 5) that was used as a probe for whole genome Southern blotting [panel (D)] are represented by gray lines below the rd7 map. B: BamHI. (B) Genomic structure [enlarged from panel (A)] showing Nr2e3 exons 4 and 5 and the positions of the primers (arrows) used in PCR genotyping [see panel (E)]. s: sense; as: antisense. A single base mismatch between each primer and the pseudogene template is represented by a bump in the arrow representing the primer. Thin lines between the three genomic maps align corresponding sequences. The L1 is represented as a discontinuous blue line. (C) Sense strand sequences at the sites of L1 insertion. From top to bottom: the WT Nr2e3 allele (WT), the rd7 allele (rd7) and the parent L1 on chromosome 4. Nr2e3 sequences are in red with the duplicated target site underlined; antisense L1 sequences (including the 3′ poly(A) tract; TTTT…) are in blue; 5′ transduced sequences from chromosome 4 are in green; and chromosome 4 sequences that flank the donor L1 element are in black. (D) Southern blot of BamHI digested genomic DNA from C57BL6 WT (+/+), rd7/+, rd7/rd7 and 129sv/J (129) mice using the exon 2–5 probe shown in (A). The predicted sizes of the pseudogene, WT and rd7 fragments are indicated by arrows to the left of the blot. Size marker indicated to the right of the blot (from top to bottom): 4.0, 3.0 and 2.0 kb. (E) PCR on tail DNA from mice of the indicated genotypes using the primers shown schematically in (B). The predicted sizes of the pseudogene and WT Nr2e3 PCR products are indicated by arrows to the left of the blot. The identities of both PCR products were confirmed by sequencing them.
![Structure and localized nuclear accumulation of the rd7 transcript. (A) Top: the structure of the rd7 transcript is shown above the map of the rd7 allele. Solid lines represent transcript sequences verified by RACE–PCR or RT–PCR and DNA sequencing. Exons 1 and 8 are labeled. The dashed line is inferred from RNA blotting experiments. Bottom: blots of total RNA from 1- to 2-month-old WT (lane 1), rd7/rd7 (lane 2) and prCAD (−/−) (lane 3) retinas were hybridized with the probes indicated beneath the genomic map. At these ages, rd7/rd7 and prCAD (−/−) retinas show minimal loss of photoreceptors. As shown in panel (B), arrows to the right of the blots indicate the positions of the rd7 transcript (top arrow) and the WT Nr2e3 transcript (bottom arrow). Arrowheads to the right of the blots indicate the positions of the presumptive immature rd7 transcript(s) (top arrowhead) and immature WT Nr2e3 transcript(s) (bottom arrowhead). Exposure times are matched across the blots. (B) Cytoplasmic (c) and nuclear (n) RNA fractions from 1- to 2-month-old WT and rd7/rd7 retinas hybridized with the Nr2e3 5′ exons probe [upper panel; see panel (A)] or with a rhodopsin intron 2 probe (center panel). Bottom panel: ethidium bromide staining of the gel prior to transfer shows the expected cytoplasmic enrichment of ribosomal RNAs. (C) Fluorescent in situ hybridization to sections (left) and dissociated cells (right) from 1- to 2-month-old rd7/rd7 and rd7/+ retinas probed with the coding region of mouse Nr2e3. The rd7 transcript accumulates in discrete foci within nuclei [counterstained with 4′, 6-diamidino-2-phenylindole (DAPI) and then digitally converted to red.] Only the photoreceptor layer is shown in the retina sections. Among dissociated retinal cells, approximately half of which are rods, the histograms to the right show that rd7/rd7 nuclei with any hybridization signal almost invariably exhibit two foci, and rd7/+ nuclei with any hybridization signal almost invariably exhibit only a single focus. In a 3 µm optical section of the retina, the ratio between the number of fluorescent foci and the number of nuclei is 2.20 for rd7/rd7 (n=505 cells) and 1.06 for rd7/+ (n=506 cells). The deviation from ratios of 2.00 for rd7/rd7 and 1.00 for rd7/+ most likely arises from undercounting of nuclei that are superimposed along the Z-axis or that graze the plane of the optical section; by contrast, all foci of hybridization that fall within the 3 µm optical section would be counted. Scale bar: 10 µm. If we assume that all of the rd7 transcripts in the retina localize to the nuclear foci, we can calculate an upper limit on the number of transcripts per hybridizing focus. We observe that the rd7 transcripts from 20% of an rd7/rd7 retina and 83 pg of in vitro synthesized Nr2e3 cRNA of 1.2 kb (MW 3.86×10⁵ g/mole; equivalent to 1.3×10⁸ molecules) hybridize on an RNA blot with nearly the same intensity when probed with a coding region probe which is homologous throughout its length to both targets (data not shown). Therefore, with 6.5×10⁸rd7 transcripts per retina, 6.4×10⁶ rods per retina (42) and two fluorescent foci per rod, we calculate an upper limit of ∼50 rd7 transcripts per fluorescent focus.](https://oup.silverchair-cdn.com/oup/backfile/Content_public/Journal/hmg/15/13/10.1093/hmg/ddl138/2/m_ddl13802.jpeg?Expires=1716396214&Signature=cfH5uBPwob9-93s4eFSeGo1ylBZ3DIdxp8inBIn88zAHulvKLCOCjiWaAWW3sKZfrmFYXJ2I48MfgW5n61Er2IyU3nShZxdkpWrU5QFTXgj7cASGv4mhHNQHEYwfyXUJl4yxsC1LjDhp0aBTKlO3trspbk6mxGhk6M2pCY0S80SZDEFJwRDDmtwMgc3BRCEcJurvnbBkmZyT9XPj5xHX5bwVB~sGA810~pYs7XIwKweU4610fiVCPI5f8TFsE0xAQyvDksg~xhXXh-V9coKWnYd62YiHzaBwWq5nh3gr54xRwfWmFmjBmuwLU8C7p~jU1a4ylw~5nvPpAqVIFL5Btw__&Key-Pair-Id=APKAIE5G5CRDK6RD3PGA)
Structure and localized nuclear accumulation of the rd7 transcript. (A) Top: the structure of the rd7 transcript is shown above the map of the rd7 allele. Solid lines represent transcript sequences verified by RACE–PCR or RT–PCR and DNA sequencing. Exons 1 and 8 are labeled. The dashed line is inferred from RNA blotting experiments. Bottom: blots of total RNA from 1- to 2-month-old WT (lane 1), rd7/rd7 (lane 2) and prCAD (−/−) (lane 3) retinas were hybridized with the probes indicated beneath the genomic map. At these ages, rd7/rd7 and prCAD (−/−) retinas show minimal loss of photoreceptors. As shown in panel (B), arrows to the right of the blots indicate the positions of the rd7 transcript (top arrow) and the WT Nr2e3 transcript (bottom arrow). Arrowheads to the right of the blots indicate the positions of the presumptive immature rd7 transcript(s) (top arrowhead) and immature WT Nr2e3 transcript(s) (bottom arrowhead). Exposure times are matched across the blots. (B) Cytoplasmic (c) and nuclear (n) RNA fractions from 1- to 2-month-old WT and rd7/rd7 retinas hybridized with the Nr2e3 5′ exons probe [upper panel; see panel (A)] or with a rhodopsin intron 2 probe (center panel). Bottom panel: ethidium bromide staining of the gel prior to transfer shows the expected cytoplasmic enrichment of ribosomal RNAs. (C) Fluorescent in situ hybridization to sections (left) and dissociated cells (right) from 1- to 2-month-old rd7/rd7 and rd7/+ retinas probed with the coding region of mouse Nr2e3. The rd7 transcript accumulates in discrete foci within nuclei [counterstained with 4′, 6-diamidino-2-phenylindole (DAPI) and then digitally converted to red.] Only the photoreceptor layer is shown in the retina sections. Among dissociated retinal cells, approximately half of which are rods, the histograms to the right show that rd7/rd7 nuclei with any hybridization signal almost invariably exhibit two foci, and rd7/+ nuclei with any hybridization signal almost invariably exhibit only a single focus. In a 3 µm optical section of the retina, the ratio between the number of fluorescent foci and the number of nuclei is 2.20 for rd7/rd7 (n=505 cells) and 1.06 for rd7/+ (n=506 cells). The deviation from ratios of 2.00 for rd7/rd7 and 1.00 for rd7/+ most likely arises from undercounting of nuclei that are superimposed along the Z-axis or that graze the plane of the optical section; by contrast, all foci of hybridization that fall within the 3 µm optical section would be counted. Scale bar: 10 µm. If we assume that all of the rd7 transcripts in the retina localize to the nuclear foci, we can calculate an upper limit on the number of transcripts per hybridizing focus. We observe that the rd7 transcripts from 20% of an rd7/rd7 retina and 83 pg of in vitro synthesized Nr2e3 cRNA of 1.2 kb (MW 3.86×10⁵ g/mole; equivalent to 1.3×10⁸ molecules) hybridize on an RNA blot with nearly the same intensity when probed with a coding region probe which is homologous throughout its length to both targets (data not shown). Therefore, with 6.5×10⁸rd7 transcripts per retina, 6.4×10⁶ rods per retina (42) and two fluorescent foci per rod, we calculate an upper limit of ∼50 rd7 transcripts per fluorescent focus.
The remaining four Nr2e3-homologous genomic phage clones (Fig. 1A) are derived from the Nr2e3 gene on chromosome 9q. The complete sequence of one of the phage inserts, which encompasses the entire Nr2e3 transcription unit, shows that the rd7 mutation is caused by the insertion of a full length L1 retrotransposon in the antisense orientation in exon 5 of the Nr2e3 gene. Although most L1s are inactive due to mutation and/or 5′ truncation, a small fraction are capable of retrotransposition, and a number of human and mouse disease mutations result from their insertion [reviewed in (2)]. In contrast to the Nr2e3 pseudogene, there are no additional sequence alterations in the coding region of the Nr2e3 allele carrying the L1 insertion, consistent with the recent origin of the rd7 mutation.
Full-length L1 elements have a 5′ untranslated region (UTR) with internal promoter activity, two open reading frames (ORF1 and ORF2), and a poly(A) tail (Fig. 1). The rd7 L1 5′-UTR contains six copies of a ∼200 bp element that is characteristic of the TF subfamily of L1s (18). At the site of insertion, the rd7 L1 has produced a 15 bp target site duplication, a typical consequence of target-primed reverse transcription [Fig. 1C; (19)]. The rd7 L1 also carries an additional 28 bp between the 5′-UTR and the Nr2e3 target sequence (Fig. 1C), which presumably arose via the uncommon process of 5′ transduction of flanking genomic sequences from the site of the donor L1 (1–3). Consistent with this model, a BLAST search of the mouse genome reveals a perfect match for this 28 bp sequence on chromosome 4 immediately 5′ of the only L1 in the mouse genome that is identical to the rd7 L1 (GenBank AL672159: bp 32630–32657). This analysis identifies the chromosome 4 L1 as the donor of the L1 element responsible for the rd7 mutation. To our knowledge, this is the first identification of an active L1 in the mouse, and the first example of 5′ transduction associated with a defined L1 transposition event. Previous work on human L1 elements had identified 3′ transduction as a common event, presumably reflecting a failure to terminate transcription at the L1 polyadenylation signal (20).
The identification of an Nr2e3 pseudogene and the discovery of an exon 5 L1 insertion in the rd7 allele explains the hitherto puzzling PCR analysis reported by Akhmedov et al. (5) and Haider et al. (6) and confirmed by us (Fig. 1B and E). PCR amplification with a sense primer in the center of exon 4 and an antisense primer at the 3′ end of exon 5 produces the expected 339 bp product with WT and rd7/+ genomic DNA templates, but with rd7/+ or rd7/rd7 templates it additionally produces a 239 bp product that is derived from the processed Nr2e3 pseudogene as determined by direct sequencing of the uncloned PCR products. Two factors appear to account for the perfect concordance between the 239 bp pseudogene PCR product and the presence of the rd7 allele, leading to the mistaken conclusion that the former is derived from the latter. First, this particular pair of PCR primers flank the 7 kb L1 insertion in the rd7 allele, and the resulting rd7-specific PCR product is too large to be amplified under standard conditions. Second, there appears to be a delicate competition between amplification of the WT Nr2e3 allele and the Nr2e3 pseudogene. The Nr2e3 pseudogene has a single base mismatch when compared with each of the Nr2e3 PCR primers (Fig. 1B), with the result that the pseudogene produces a detectable PCR product only when one or both of the competing WT alleles is absent. This example calls for caution in interpreting analyses of spontaneous mutations based exclusively on PCR.
Structure and nuclear localization of the rd7 transcript
Next, we sought to define the structure of the rd7 transcript (Fig. 2A). RNA blotting shows that Nr2e3 exons both upstream and downstream of the L1 insertion are present in this transcript, at least two Nr2e3 introns (1 and 7) are efficiently spliced out, and Nr2e3 intron 5 is retained. Sequencing of cloned reverse transcriptase (RT)–PCR and rapid amplification of cDNA ends (RACE)–PCR products shows that intron 5 is the only intron present in the rd7 transcript and that the transcription initiation and polyadenylation sites are the same as for the WT Nr2e3 transcript (5,7). Accurate transcription initiation and photoreceptor-specific expression suggest that the rd7 transcript is produced under the control of the Nr2e3 promoter (7,8). Because of the repetitive nature of the 5′-UTR and the long poly(A) tract in the rd7 L1, we could not amplify the entire rd7 transcript. However, we infer that the complete L1 sequence is present in the major rd7 transcript from the following observations (1): probes from Nr2e3 exons either upstream or downstream of the L1 insertion or from the L1 ORF1 or 5′-UTR all hybridize strongly to an rd7-specific RNA species of ∼9 kb (Fig. 2A); and (2) RT–PCR amplifies the junction between the L1 5′-UTR and the 3′ half of Nr2e3 exon 5 as predicted from the rd7 genomic sequence (data not shown). Not unexpectedly, the L1 ORF1 probe also hybridizes to one or more high molecular weight transcripts in control WT retina RNA, albeit with a signal that is somewhat weaker than that seen with rd7 RNA. These transcripts are presumably derived from one or more L1s elsewhere in the genome that are closely related to the rd7 L1.
The antisense L1 insertion in exon 5 of the Nr2e3 gene introduces multiple stop codons in all three reading frames in a centrally located exon. In general, transcripts with a premature stop codon greater than 50 bases upstream of the 3′ end of the penultimate exon are degraded by the nonsense-mediated decay pathway (21). It is therefore surprising that the rd7 transcript accumulates in the retina to a level at least 10 times that of the native Nr2e3 transcript [Fig. 2A; (7)]. As a first step in investigating this apparent anomaly, we determined that, in contrast to the expected cytoplasmic localization of mature mRNAs, the rd7 transcript accumulates in the nucleus (Fig. 2B). This nuclear accumulation is even more pronounced than the fractionation in Fig. 2B would suggest because there is some leakage of RNA from nuclei during sample preparation, as evidenced by the weak signal in the cytoplasmic fraction seen upon hybridization with an intron 2 probe from the rhodopsin gene (Fig. 2B).
The rd7 transcript accumulates at its site of transcription
The subcellular localization of the rd7 transcript was further defined by fluorescent in situ hybridization to retina sections and to isolated retinal cells. Probes derived from the Nr2e3 coding region (Fig. 2C) or intron 5 (data not shown) gave the same patterns of hybridization: in both cases discrete foci of hybridization were localized over nuclei. Foci of hybridization are not seen in WT retinas, and they are unlikely to be caused by the slow photoreceptor degeneration of the rd7/rd7 retina because they are not seen in the photoreceptor cadherin null [prCAD(−/−)] retina, which exhibits a mechanistically different but similarly slow photoreceptor degeneration (22; data not shown). The foci appear to mark the accumulation of transcripts at the rd7 locus because rd7/rd7 retina sections show two labeled foci per photoreceptor nucleus, whereas rd7/+ retina sections show one labeled focus per photoreceptor nucleus. The same number of foci per nucleus is apparent among dissociated retinal cells, in which case there is no potential for ambiguity in assigning foci among tightly packed cells (Fig. 2C).
Under the assumption that all of the rd7 transcripts in the retina localize to the nuclear foci, we calculate that there are 50 transcripts per hybridizing focus (Fig. 2, legend). Interestingly, the intensity of the hybridizing foci is lower in rd7/+ nuclei relative to rd7/rd7 nuclei, although the rd7 transcript abundance in rd7/+ versus rd7/rd7 retinas are roughly 1:2 as determined by RNA blotting (7). This observation suggests that some fraction of the rd7 transcripts may be dispersed throughout the nucleus in the rd7/+ retina. We also note that the location of rd7 transcript foci at or near the edges of photoreceptor nuclei suggests that active genes may be enriched in these domains, an idea consistent with the classic observation that, in photoreceptor nuclei, highly condensed chromatin is concentrated in the center of the nucleus and decondensed chromatin is found at the nuclear periphery (23).
The RNA localization data suggest that by remaining within the nucleus the rd7 transcript escapes degradation by the translation-based quality control associated with nonsense-mediated decay. Its accumulation at the site of transcription could be caused by sequences within the antisense strand of the L1 element, or it could reflect a failure to remove intron 5. Data described below implicate the latter cause, in agreement with work on globin mRNA processing in transfected cells showing that mutant transcripts that fail to excise one or more introns are retained near the site of transcription (24).
Splicing defects in rd7 transcripts produced in transfected cells
To investigate the unexpectedly high efficiency of transcription through the antisense rd7 L1, the origin of the intron 5 splicing defect, the possibility of alternative RNA processing pathways, and the generality of nuclear accumulation of the rd7 transcript, we introduced various derivatives of the WT or rd7 alleles of Nr2e3 into HEK 293 cells (Fig. 3). WT Nr2e3 transcripts are processed and exported to the cytoplasm as expected (Fig. 3A–D, construct 1). As in photoreceptors, transcription of the rd7 allele in 293 cells proceeds efficiently through the antisense L1 element, generating a major high molecular weight transcript (Fig. 3B, construct 3; upper arrows). In situ hybridization to transfected 293 cells using either an Nr2e3 intron 5 probe or a coding region probe demonstrates greater accumulation of intron 5 sequences in the nucleus (presumably reflecting the production of the high molecular weight transcript) as well as relatively less efficient export of Nr2e3 coding region sequences to the cytosol following transfection with the rd7 allele relative to the WT allele (Fig. 3C).
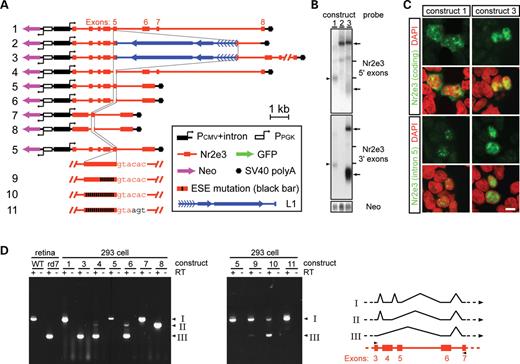
L1 insertion causes an intron 5 splicing defect by separating essential exon 5 ESEs from a sub-optimal intron 5 splice donor. (A) Structure of the constructs analyzed in transiently transfected 293 cells. In constructs 4, 6 and 8, the deletion of nucleotides 6–119 of exon 5 (out of a total length of 158 nucleotides) is represented by a gap. Thin lines between the different maps align the 5′ and 3′ edges of exon 5. In constructs 5–11, exons 6–8 are derived from cDNA and are therefore joined together; similarly, in constructs 7 and 8, exons 1–4 are derived from cDNA and are therefore joined together. At the bottom of this panel, exon 5 and the 5′ edge of intron 5 are shown in greater detail for constructs 5, 9, 10 and 11. Constructs 9 and 10 carry, respectively, mutations in 6 of 14 and all 14 exon 5 consensus ESE sequences (see Materials and Methods). Construct 11 is identical to construct 10 except that the sequence at the 5′ border of intron 5, GTACAC…, has been replaced with the consensus sequence GTAAGT…; PCMV+intron, CMV enhancer and promoter followed by a small intron; PPGK, PGK promoter; arrows from the promoters indicate the direction of transcription. (B) Hybridization to blots of total RNA from 293 cells transfected with the indicated constructs (see Fig. 2A for a description of Nr2e3 5′ or 3′ exons probes). Bottom panel: the same blot hybridized with the Neo probe to control for equal transfection efficiency. Arrowhead to the left of the Nr2e3 blots indicates the mature Nr2e3 transcript. Arrows to the right of the Nr2e3 blot indicate the full-length rd7 transcript (top arrow) and aberrantly spliced low-molecular weight rd7 transcripts (bottom arrow). Other minor hybridizing bands in the Nr2e3 blot probably come from partially processed transcripts. Horizontal lines to the right of the blots show the mobilities of the 28S and 18S ribosomal RNAs. (C) Fluorescent in situ hybridization of 293 cells transfected with the indicated constructs using probes for the coding region (upper panels) and intron 5 (lower panels) of mouse Nr2e3. The cell nuclei were counterstained with DAPI and then digitally converted to red. The wild-type Nr2e3 allele in construct 1 is efficiently transcribed, processed and exported to the cytoplasm: coding region hybridization is observed in both the nucleus and cytoplasm, whereas intron 5 hybridization is confined to the nucleus. In contrast, transcripts from the rd7 allele (construct 3) accumulate mainly in the nucleus; both coding region and intron 5 probes give identical patterns of nuclear hybridization. Scale bar: 10 µm. (D) Left: agarose gel electrophoresis of RT–PCR products using total RNA from mouse retinas of the indicated genotype or 293 cells transfected with the indicated constructs. The ‘+’ and ‘−’ signs above the gel indicate the presence and absence of reverse transcriptase (RT). Right: the structure of the mouse Nr2e3 gene (from exon 3 to exon 7) is shown in red symbols and the positions in exons 3 and 7 of the primers used for RT–PCR are shown as black arrowheads. The major RT–PCR products were gel purified and directly sequenced, and the three observed spliced structures (I, II and III) are marked to the right of each gel and are shown on the schematic diagram.
In 293 cells, the rd7 allele also generates a group of relatively abundant lower molecular weight transcripts (Fig. 3B, lower arrows). These transcripts are several hundred bases smaller than the mature WT Nr2e3 transcript and they hybridize weakly to the Nr2e3 5′ exons probe because, as described below, they are missing exon 4, which constitutes a substantial part of this hybridization probe. In contrast, these transcripts hybridize strongly to the Nr2e3 3′ exons probe, but they do not hybridize to probes from Nr2e3 intron 5 or the rd7 L1 ORF1 (data not shown). These observations rule out the possibility that the lower molecular weight transcripts arise from premature termination, promoter activity within the L1 5′-UTR, or non-specific RNA degradation, a conclusion that is reinforced by their absence from an rd7 construct that lacks exons 6–8 (Fig. 3A and B; construct 2). In keeping with these data, RT–PCR shows that among the rd7 transcripts produced in 293 cells that have spliced out the L1 element, almost all have directly spliced together exons 3 and 6 (Fig. 3D; structure III). In rd7 retinas, the same aberrantly spliced transcripts also represent the major class detected by RT–PCR [Fig. 3D; (5)], although they constitute so small a fraction of the total Nr2e3 transcripts in vivo as to be undetectable by RNA blotting (Fig. 2A). Both in photoreceptors and in transfected 293 cells, the WT Nr2e3 allele generates correctly spliced products with nearly 100% efficiency (Fig. 3D; structure I).
L1 Insertion blocks splicing by separating exon 5 splicing enhancers from a suboptimal intron 5 splice donor
Splicing of some introns is facilitated by the presence of exonic splicing enhancers (ESEs), which act on the adjacent splice junction in a distance-dependent manner (25). To test whether the inefficient excision of Nr2e3 intron 5 from the rd7 transcript reflects the disruption of an ESE and/or the separation of an ESE from the intron 5 splice donor by the L1 insertion, we examined the transcripts produced from an in-frame deletion of exon 5 sequences upstream of the site of L1 insertion, either in the context of the WT Nr2e3 allele (Fig. 3A and D, constructs 1 versus 4) or in the context of two Nr2e3 minigenes in which various introns were precisely excised (Fig. 3A and D, constructs 5 versus 6 and 7 versus 8). In transcripts derived from constructs 3, 4 and 6, both exons 4 and 5 are efficiently skipped (Fig. 3D). In minigene constructs lacking introns 1–3, the deletion of sequences within exon 5 simply results in the skipping of that exon (Fig. 3A and D; compare constructs 7 and 8).
These data suggest that the intron 5 splice donor is suboptimal and that it is dependent on an ESE in exon 5, and either the 7 kb separation of this ESE from the splice donor caused by the rd7 L1 insertion (construct 3) or deletion of the ESE (constructs 4, 6 and 8) promotes the utilization of splicing donors from introns further upstream. To further explore this idea we tested derivatives of construct 5 in which 6 of 14 consensus ESE sites (26) 5′ of the L1 insertion site in exon 5 were mutated (construct 9), or in which all 14 consensus ESE sites 5′ of the L1 insertion site were mutated (construct 10), or in which the intron 5 splice donor (GTACAC…) was converted to an optimal splice donor consensus (GTAAGT…) in the context of construct 10 (construct 11). As determined by the ratio of splicing products I and III (Fig. 3D), the mutation of six ESE consensus sites minimally lowers the efficiency of generating the correctly spliced transcript, whereas the mutation of all 14 ESE mutations substantially lowers this efficiency. Interestingly, the simple conversion of the intron 5 splice donor sequence to a consensus sequence bypasses the requirement for exon 5 ESE sites (Fig. 3A and D). Therefore, it appears that a suboptimal splice donor in intron 5 makes the splicing of this intron dependent on multiple ESEs in exon 5, and in the rd7 allele L1 insertion near the 3′ end of exon 5 disrupts this interaction.
The effect of sense versus antisense L1 insertion on transcript processing and accumulation
Although the experiments described earlier fully account for the structure and localization of rd7 transcripts in vivo, their relatively high abundance was surprising in light of previously published data demonstrating inefficient transcriptional elongation through antisense L1 sequences due to premature termination and polyadenylation (27). To investigate the parameters governing L1 effects on transcriptional elongation and transcript accumulation, L1 insertions in both sense and antisense orientation were constructed in a variety of sequence contexts and the size and abundance of the resulting transcripts measured by RNA blotting (Fig. 4).
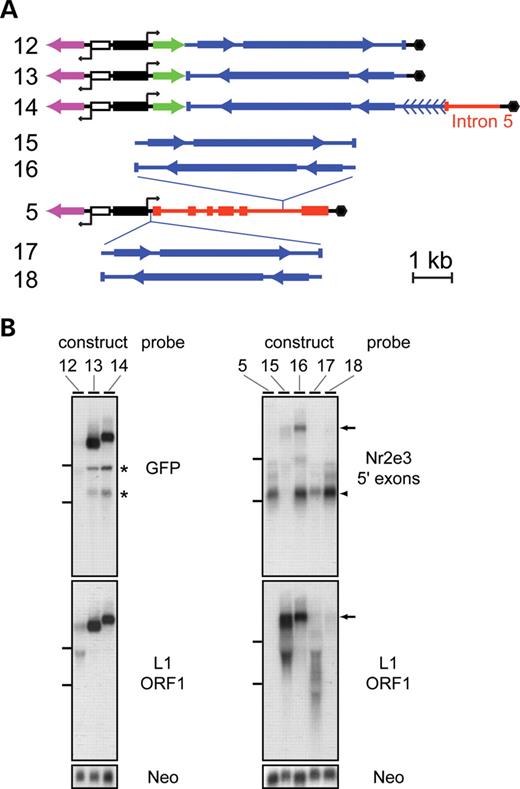
Differential accumulation of transcripts containing sense versus antisense L1 elements in diverse sequence contexts. (A) Structure of the constructs analyzed in transiently transfected 293 cells. Symbols are defined in the box in Fig. 3A. In constructs 12 and 13, the nearly full-length L1 element was inserted in the indicated orientation into the 3′-UTR of a GFP expression construct. We note that in constructs 12 and 13, as well as in constructs 15–18, the six tandem 200 bp repeats at the 5′ end of the L1 element were omitted because of difficulties in manipulating the constructs. Construct 14 resembles construct 13, but includes the entire L1 sequence in the antisense orientation together with ∼0.8 kb of adjacent sequences from the rd7 allele that are 3′ of the insertion site. In constructs 15 and 16, the L1 element is inserted in the indicated orientation into Nr2e3 intron 5 of construct 5. In constructs 17 and 18, the L1 element is inserted in the indicated orientation into a small vector-derived intron (black line) that is located immediately 3′ of the CMV promoter (solid black rectangle). (B) Hybridization to blots of total RNA from 293 cells transfected with the indicated constructs (see Fig. 2A for a description of the Nr2e3 5′ exons probes). Bottom panel: the same blot hybridized with the Neo probe to control for equal transfection efficiency. Left: in the blot probed with GFP, two minor hybridizing species are indicated by asterisks; they presumably arose from premature termination within the antisense L1 because they are the same size for constructs 13 and 14 which differ only in the 3′ regions, and because they fail to hybridize with an L1 ORF1 probe. Right: arrows indicate unspliced transcripts containing L1 sequences. Arrowhead, the mature spliced transcript. Horizontal lines to the left of the blots show the mobilities of the 28S and 18S ribosomal RNAs.
Full-length transcripts accumulate efficiently when the L1 element was inserted in the antisense orientation downstream of a green fluorescent protein (GFP) coding region (Fig. 4; constructs 13 and 14), with only a low level accumulation of truncated transcripts (asterisks; Fig. 4B). In contrast, insertion of the L1 element in the sense orientation at the same site leads to far lower transcript levels (Fig. 4; construct 12). Similar results were obtained with sense and antisense L1 insertion into an Nr2e3 cDNA in the same expression vector (data not shown). RNA blotting of nuclear and cytosolic fractions shows that the major high molecular weight transcripts produced from constructs 13 and 14 (Fig. 4B) accumulate in the cytosol (data not shown), indicating that antisense L1 sequences do not impair nuclear export. This result implies that the retention of rd7 transcripts in the nucleus (Figs. 2 and 3) results from the failure to excise intron 5 rather than from the presence of the antisense L1.
In the genome, most intragenic L1s reside within introns rather than within exons. To explore the effects of sense and antisense L1 insertion within introns, we analyzed L1 insertions either in Nr2e3 intron 5 (Fig. 4; constructs 15 and 16) or in a vector-derived intron just upstream of the Nr2e3 minigene (Fig. 4; constructs 17 and 18). In either location, antisense L1 insertion had no detrimental effect on the yield of mature Nr2e3 mRNA (arrowhead in Fig. 4B, right panel), although in cells transfected with construct 16 relatively high levels of unspliced precursor transcripts also accumulated (arrow in Fig. 4B, right panels). In contrast, sense L1 insertion in either intronic location lowered the yield of mature mRNA relative to the level obtained with the parental construct by several-fold (construct 17) or by more than 10-fold (construct 15). With sense L1 insertion there was a concomitant accumulation of variably sized transcripts most likely arising from heterogeneous transcription termination within the L1 element (Fig. 4B; compare the hybridization signals observed with the Nr2e3 5′ exons probe and the L1 ORF1 probe).
Preferential antisense orientation of intronic L1 elements in mammalian genomes: implications for the ecology of L1 elements
The observations described earlier suggest that the effect of antisense intragenic L1 insertion on the yield of mature transcripts ranges from inconsequential to substantial, depending on the location of the L1 insertion, whereas sense L1 insertion in any location within a transcription unit could substantially decrease the yield of mature transcripts. If these observations extend to many genes and to an evolutionary time scale, then one would predict that the density of L1s residing in introns (referred to hereafter as ‘intronic L1s’) would be lower than the density of L1s in the genome as a whole, and, moreover, among intronic L1s, sense L1s should be under-represented relative to antisense L1s due to purifying negative selection. In keeping with this model, an analysis of L1s in the mouse genome reveals that L1s comprise 20% of the entire genome but only 11% of all intron sequences. In addition, among intronic L1s, there are roughly half as many L1s in the sense orientation as in the antisense orientation (Fig. 5). A similar bias in the ratio of antisense:sense intronic L1s has been noted in the human genome [antisense:sense ratio of 1.97; (3,27–30)]. In the rat, dog and chimp genomes the antisense:sense intronic L1 ratios are 1.92, 1.59 and 1.88, respectively.
![Bioinformatic analysis of intronic L1 sequences in the mouse genome. The plots show the number of sequence alignments (vertical axis) at each position (horizontal axis) when the rd7 L1 is aligned to long L1s (upper panel) or all L1 sequences (middle panel) in either the sense (red) or the antisense (green) orientation with respect to each gene within which L1 sequences reside. The blue schematic image of the rd7 L1 at the top is aligned with the sequence along the horizontal axis. Alignments to the poly(A) tract of the rd7 L1 are not included in the plots. The periodic pattern in the leftmost 20% of each plot corresponds to alignments with the six copies of ∼200 bp 5′-UTR elements; the region between the two L1 ORFs corresponds to a small dip in the contour of the plots. The progressively smaller number of aligned sequences toward the left side of the middle panel (i.e. towards the 5′ end of the L1) reflects the many 5′ truncations commonly seen among L1s in the mouse genome. Inset tables: the number of intronic L1s with their chromosomal orientations indicated as ‘+’ or ‘−’ [as defined on the UCSC Genome Bioinformatics Site (www.genome.ucsc.edu)]. Only minus strand L1s (red and green numbers) are plotted in the upper panel (see Materials and Methods for details); both plus and minus strand L1 sequences (red and green numbers) are summed for the plot in the middle panel. Bottom panel, the percent identity with the rd7 L1 was calculated over all of the alignments of intronic L1s (from the middle panel) and the difference between these values for sense and antisense L1s at each nucleotide is plotted against position along the rd7 L1. There is no evidence for orientation-specific selection against any particular L1 subregions.](https://oup.silverchair-cdn.com/oup/backfile/Content_public/Journal/hmg/15/13/10.1093/hmg/ddl138/2/m_ddl13805.jpeg?Expires=1716396214&Signature=1faWimulDQ4hBk-414ta7IW1o4tiH8k7qtirUlZCfpTFTiAzn~-H7Xulg-tJjTuEse2wRs5cU3CVEWSBbiospxvZWn74L8kgxztLsO1vl6T3gtIDa2sR6E4T6PuMzQRWIVhKBAdmvLb6iDz8ZZtV4UzOOWoQ00DFOvidoHHl43GhUIgxerA5l4sYgy34T1-rZ7fnv5X9Cb4SV5aI5y3q7OXcg0BbEnc1beREdrb676qDKJm~uCOxIUOMVz8RI2Jx5wwkUMqx7DxYFb0SVhhVsRyu7DoUgTWfNFjkatcVEbzLQDtdiSweqi182w28jbL1VyQoKShfYeWnBVRMg8MPHw__&Key-Pair-Id=APKAIE5G5CRDK6RD3PGA)
Bioinformatic analysis of intronic L1 sequences in the mouse genome. The plots show the number of sequence alignments (vertical axis) at each position (horizontal axis) when the rd7 L1 is aligned to long L1s (upper panel) or all L1 sequences (middle panel) in either the sense (red) or the antisense (green) orientation with respect to each gene within which L1 sequences reside. The blue schematic image of the rd7 L1 at the top is aligned with the sequence along the horizontal axis. Alignments to the poly(A) tract of the rd7 L1 are not included in the plots. The periodic pattern in the leftmost 20% of each plot corresponds to alignments with the six copies of ∼200 bp 5′-UTR elements; the region between the two L1 ORFs corresponds to a small dip in the contour of the plots. The progressively smaller number of aligned sequences toward the left side of the middle panel (i.e. towards the 5′ end of the L1) reflects the many 5′ truncations commonly seen among L1s in the mouse genome. Inset tables: the number of intronic L1s with their chromosomal orientations indicated as ‘+’ or ‘−’ [as defined on the UCSC Genome Bioinformatics Site (www.genome.ucsc.edu)]. Only minus strand L1s (red and green numbers) are plotted in the upper panel (see Materials and Methods for details); both plus and minus strand L1 sequences (red and green numbers) are summed for the plot in the middle panel. Bottom panel, the percent identity with the rd7 L1 was calculated over all of the alignments of intronic L1s (from the middle panel) and the difference between these values for sense and antisense L1s at each nucleotide is plotted against position along the rd7 L1. There is no evidence for orientation-specific selection against any particular L1 subregions.
Figure 5 presents a genome-wide analysis of mouse L1 sequences at single nucleotide resolution. In this analysis, we have assessed the possibility of positive or negative selection by aligning the sequences of each sense and antisense intronic L1 to the rd7 L1 and counting the number of aligned sequences at each nucleotide position. The sum of the aligned sequences are shown separately for those L1s that are highly homologous to the rd7 L1 and longer than ∼4 kb (Fig. 5, upper panel) and for all L1s (Fig. 5, central panel). The former group should recapitulate on an evolutionary time scale the effects that we observed for L1 insertion on target gene expression in 293 cells. The shapes of the two plots largely reflect the different lengths of intronic L1 sequences, many of which are truncated at their 5′ ends. As seen in Figure 5, the distributions of aligned sense and antisense L1 sequences have similar shapes, but, as noted above, the ratio of antisense:sense L1 sequences is approximately 2:1.
When all of the intronic L1 sequences are individually aligned to the rd7 L1, the overall percent identity for the aligned sequences is similar for the sense (91.9%) and antisense (91.3%) L1s. A plot of the difference between these percentages at each nucleotide position along the length of the rd7 L1 sequence shows excursions of only a few percent (Fig. 5, bottom panel). Thus, when summed over all intronic L1s, no L1 subregion is differentially represented or more divergent in the sense or antisense orientations, indicating that no subregion is under orientation-specific positive or negative selection. If we assume that intronic L1s initially insert randomly with respect to the orientation of the target transcription unit, then the data imply that sense L1s are simply selected against as a whole.
DISCUSSION
The rd7 mutation: structure and mechanism
The data presented here define the molecular basis of the rd7 mutation: an antisense L1 insertion into exon 5 of the Nr2e3 gene. L1 insertion separates essential exon 5 ESEs from a suboptimal intron 5 splice donor, leading to the accumulation of partially spliced 9 kb precursor transcripts. These data imply that ESEs have a substantial role in determining splicing efficiency at introns with suboptimal splice site sequences. Although Nr2e3 introns 1–4, 6 and 7 are efficiently excised from the rd7 transcript, the failure to excise intron 5 appears to block release of the precursor from its site of synthesis. The accumulation of partially spliced transcripts at their site of synthesis has been observed in stably transfected cells in culture (24), but to our knowledge it has not previously been observed in vivo. The mechanism that localizes unspliced transcripts is presently unclear, but could relate to the interaction of splicing complexes with the extended C-terminal domain of RNA polymerase II (31). The rd7 mutation joins a growing list of spontaneous mouse and human mutations caused by L1 insertion (2), several of which have been shown to affect splicing and/or RNA stability (32,33).
The identification of the molecular defect in the rd7 mouse puts this model of ESCS, Goldman-Favre syndrome and clumped pigmentary retinopathy on a solid foundation. Most likely, the rd7 allele is a complete null, in agreement with our earlier failure to detect Nr2e3 protein by immunoblotting of rd7/rd7 retina extracts (7). The earlier failure to identify the L1 insertion at the Nr2e3 locus and the confusion caused by sequences derived from a highly homologous Nr2e3 pseudogene call for caution in defining genotypes based solely on PCR. In the present instance, the structure of the mutant allele only became apparent when it was cloned and sequenced.
Implications for the co-evolution of L1s and their mammalian hosts
Our analysis of the effect of sense L1 insertion on transcript processing and accumulation is in general agreement with the hypothesis that intronic L1 insertion decreases transcript abundance by premature termination and can function as a molecular rheostat to modulate levels of gene expression (27,34,35). In particular, the context-dependent decrements in transcript abundance associated with sense L1 insertion, together with evidence that many intronic L1s in the sense orientation have been subject to purifying negative selection, implies that on a genomic scale sense L1 insertion is likely to be a major evolutionary force in decreasing gene expression.
In contrast, our analysis of the effects on antisense L1 insertion was surprising and suggests that in a variety of sequence contexts antisense L1s in introns and 3′-UTRs have minimal impact on transcript elongation, splicing and abundance. Although not observed here, there are, however, reported instances in which an intronic antisense L1 can significantly disrupt splicing. For example, in the spastic mouse antisense L1 insertion in intron 5 of the glycine receptor beta subunit gene causes skipping of exon 5 or of both exons 4 and 5 (32,36). Taken together, our experimental data and the observed 2-fold higher abundance of antisense over sense intronic L1s in all mammalian species examined imply that the L1 sequence has evolved so that in many contexts intronic antisense L1s escape purifying negative selection.
MATERIALS AND METHODS
Construction and screening of the rd7 genomic phage library
rd7/rd7 genomic DNA, prepared by proteinase K digestion of mouse brain nuclei and CsCl gradient centrifugation, was partially digested with Sau3A I and DNA fragments of 12–18 kb were purified, ligated to BamHI digested EMBL3 lambda DNA (37) and packaged in vitro. A total of 4×10⁵ unamplified (i.e. independent) recombinants were screened with a probe corresponding to the coding region of mouse Nr2e3.
RNA blotting, RACE–PCR and RT–PCR
RNA was extracted from 1–2-month-old mouse retinas or from transfected 293 cells using Trizol (Invitrogen) following the manufacturer's protocol. RNA blotting was performed using standard methods with 32P-labeled probes. RNA isolated from 293 cells was treated with DNase I (Ambion) to eliminate contamination by transfected plasmid DNA. RACE–PCR and RT–PCR were performed using the Smart RACE cDNA kit (BD Biosciences) and Superscript II reverse transcriptase (Invitrogen) according to the manufacturers' protocols. The primers used in RT–PCR are in exon 3 (5′-GCCTCTCCTGCTCTGGCAGGGCCCA-3′) and exon 7 (5′-GGCAGAGACCACTGTATGGCTCCA-3′) of mouse Nr2e3.
Plasmids
As an internal transfection control for all constructs in Figures 3 and 4, a phosphoglycerate kinase (PGK) promoter-driven neomycin resistant gene (Neo) with a PGK 3′-UTR was inserted immediately upstream of the CMV enhancer and promoter at the SpeI site of pRK5 (38; modified to carry the pBluescript polylinker) in the opposite orientation from the CMV-driven transcription unit. The level of Neo transcripts were monitored by RNA blotting. For both the rd7 and WT Nr2e3 alleles, an ApaI (in the 5′-UTR in exon 1)—SpeI (in the 3′-UTR in exon 8) fragment was cloned between the ApaI and SpeI sites of pRK5-KS to generate constructs 1 and 3 (Fig. 3). From the rd7 allele, an ApaI (in the 5′-UTR in exon 1)—XhoI (in intron 5) fragment was cloned between the ApaI and EcoRV sites of pRK5-KS to generate construct 2. A mouse Nr2e3 genomic DNA/cDNA chimera with only introns 1–5 retained was cloned between the ApaI and NotI sites of pRK5-KS to generate construct 5. A mouse Nr2e3 cDNA/genomic DNA chimera with only introns 4 and 5 retained was cloned between the NotI and SalI sites of pRK5-SK to generate construct 7. Constructs 4, 6 and 8 were generated from constructs 1, 5 and 7, respectively, by replacing nucleotides 6–119 of exon 5 with a 6-bp spacer (5′-TTAATT-3′) which maintains the reading frame. For constructs 9–11, point mutations 5′ to the L1 insertion in exon 5 were made to eliminate potential ESEs predicted by ‘ESEfinder’ (26). Construct 9 contains seven point mutations (G63A, G67T, A78C, G102C, G112T, A120T, A121C) and construct 10 contains seven additional point mutations (A7C, G15T, C20T, C22T, C32G, C33A, G45T; all the numbers for the point mutations refer to exon 5). Construct 11 is identical to construct 10 except that the sequence at the 5′ border of intron 5, GTACAC… , has been changed to the consensus sequence GTAAGT….
An EGFP cDNA without a stop codon was cloned into the BamHI site of pRK5-SK to obtain pRK5-SK-EGFP for constructs 12–14. For constructs 12 and 13, a SmaI linker was added to the end of the poly(A) tract of the rd7 L1 and the SmaI (3′ of the L1 poly(A) tract)—SmaI (in the L1 5′-UTR) fragment was cloned into the SmaI site of pRK5-SK-EGFP in either the sense (construct 12) or the antisense (construct 13) orientation. For construct 14, the SmaI (3′ of the L1 poly(A) tract)—XhoI (in Nr2e3 intron 5) fragment was cloned between the SmaI and XhoI sites of pRK5-SK-EGFP. The aforementioned SmaI—SmaI fragment of L1 was cloned into construct 5 at nucleotide 45 of the pRK5-derived intron immediately 5′ of the polylinker or at the EcoRI site of Nr2e3 intron 5 in either the sense (constructs 15 and 17) or the antisense (constructs 16 and 18) orientation.
Transfection and cell culture
HEK 293 cells, maintained in DMEM/F-12 (Gibco) supplemented with 10% fetal bovine serum (Invitrogen), were transfected in six-well plates with 2–3 µg/well DNA using Fugene 6 (Roche). Cells were grown on poly-d-lysine (Sigma) coated coverslips for in situ hybridization. Cells were harvested 18 h later for RNA analysis.
PCR and Southern blot genotyping
rd7 mice were obtained from The Jackson Laboratory (Nr2e3rd7) and mated to C57BL6 mice to obtain rd7/+ mice. Tail DNA was prepared using standard methods and was PCR amplified with sense primer 5′-GTAGCCTCTCCTGCTCTGGCAG-3′ and antisense primer 5′-CAGGTTGGAAAACACAGGCAAG-3′ (6) under the following conditions: 94°C, 3 min followed by 35 cycles of 94°C, 30 s; 60°C, 30 s; and 72°C 30 s, followed by a final extension of 72°C for 7 min. A probe corresponding to exons 2–4 and the 5′ part of exon 5 of mouse Nr2e3 was used for Southern blotting.
Subcellular RNA fractionation
Twelve mouse retinas were homogenized in Hank's balanced salt solution and centrifuged at 2000g for 1 min at 4°C. The supernatant was used for purification of cytoplasmic RNA. The pellet was resuspended in PBS with 1% Triton X-100 and 1% Tween-20 and centrifuged at 2000g for 1 min at 4°C. The resulting pellet was used for purification of nuclear RNA.
Retinal cell dissociation and fluorescent in situ hybridization
Dissociation of retinal cells was performed essentially as described (39). In situ hybridization was performed with a digoxigenin-labeled riboprobe derived from the coding region or intron 5 of mouse Nr2e3 as described in Chen et al. (7). The signal was detected using an Alexa-488 Tyramide Signal Amplification kit (Molecular Probes) combined with an anti-digoxigenin-POD Fab fragment (Roche). Images were captured on a LSM510 confocal microscope (Zeiss, Oberkochen, Germany). For quantitation of the number of fluorescent foci and cell nuclei in retina sections, 15 consecutive 0.2 µm optical sections were collected (3 µm total), projected onto a single plane, and analyzed by ImageJ 1.34n (NIH). At least three retina sections were analyzed for both rd7/+ and rd7/rd7 mice.
Bioinformatics
The sequences of mouse L1s (defined by RepeatMasker) that have at least 80% overlap with introns of Refseq genes were downloaded using the table browser on the UCSC Genome Bioinformatics Site [March 2005 mouse genome assembly; http://www.genome.ucsc.edu/cgi-bin/hgTables; (40)]. L1s with a RepeatMasker SW score greater than 20 000 are considered to be ‘long’ L1s (mean length=4425±282 bp, as compared with 1741±1507 bp for all intronic L1s). [For reasons that we do not understand, >90% of the long L1s in the chromosomal plus strand orientation are annotated as two separate L1 segments by RepeatMasker; this annotation problem does not occur in the minus strand orientation. To circumvent the difficulty that this presents in plotting the aligned long L1s (Fig. 5, upper panel) we have plotted only the long L1s in the chromosomal minus strand orientation.] Intronic L1s were aligned individually to the rd7 L1 (7235 bp) with the stand-alone ‘BLAST 2 sequences’ (41) using the default setting with the DUST filter off and an E-value cutoff of 0.05; the aligned sequences were parsed using PERL. The number of matches and mismatches were counted at each position along the rd7 L1, the percent match was calculated, and the differences plotted in Figure 5.
ACKNOWLEDGEMENTS
The authors thank Jef Boeke, Hal Dietz, Jeff Han, Phil Smallwood and Wenyi Wang for advice, assistance, materials and/or helpful comments on the manuscript. Supported by the National Eye Institute and the Howard Hughes Medical Institute.
Conflict of Interest statement. None declared.
