
Abstract
In this study, we have focused on the green method using Litchi Chinensis Leaf Extract (LCLE) for the synthesis of silver nanoparticles (AgNPs). Here, the experimental control parameters (reducing/stabilizing agent quantity, reaction time and temperature, silver ion concentrations) were studied during the size controlled synthesis of silver nanoparticles and their physicochemical properties have been studied. For biological studies, the stability of AgNPs at physiological pH is of vital importance; hence, post-synthesis solution stability of AgNPs was examined at various pH conditions. Stable AgNPs are formed by treating the aqueous solution of AgNO3 with LCLE. Formation of AgNPs was observed visually by the change in the color and further characterized by the surface Plasmon resonance (SPR) peak observed at 436 nm by UV–vis spectroscopy. The synthesized AgNPs were also characterized for their size distribution by Dynamic Light Scattering (DLS), Scanning Electron Microscopy (SEM), Transmission electron microscope (TEM), crystalline nature by X-Ray Diffraction (XRD) and Fourier Transform infrared (FITR) for the functional groups present. The size of AgNPs was in the range of 40–50 nm, spherical in with face centered cubic (FCC) structure. The biomolecules (epicatechin) present in LCLE were responsible for reduction, capping, and stabilizing agent of AgNPs. Post- synthesis, the stability of AgNPs has been studied by changes in the SPR peaks at various pH (2–11) conditions using UV–vis spectroscopy. This size controlled nanoparticles are very stable at physiological pH and retain their intrinsic SPR property.
Export citation and abstract BibTeX RIS

Original content from this work may be used under the terms of the Creative Commons Attribution 4.0 licence. Any further distribution of this work must maintain attribution to the author(s) and the title of the work, journal citation and DOI.
1. Introduction
Recently, there have been considerable efforts to produce non-toxic, reliable, and eco-friendly methods for synthesis of nanoparticles with desired size and morphologies. Initiatives have been taken to use environment friendly methods in the research field to protect our global environment.
Various methods for synthesis of nanoparticles include physical method [1] chemical method [2, 3] electrochemical reductions [4, 5] photochemical reductions [6, 7] and biological methods [8, 9] . In green method non toxic chemicals are used whereas in other methods toxic chemicals are used. The green process has encountered more attention as a suitable alternative to all other methods. The overall toxicological effect has been less during its use in medical applications. The toxicity might be due to either the use of toxic reagents that have been used either as stabilizing agents or reducing agents. The use of natural products instead of toxic chemicals for reduction and stabilization during nanoparticles synthesis has received great importance in the field of nanotechnology.
Metal nanoparticles exhibit their applicability in various fields like chemistry, -optoelectronic [10], sensing device [11], image recording media [12], engineering science, medical field [13], electronics [14], medicine [15] and in pharmacological [16] devolvement due to their specific properties such as higher surface area, antibacterial, anticancer, antimicrobial and antifungal acuities [17] Of the various metal nanoparticles like Palladium-nanoparticles, platinum nanoparticles, gold-nanoparticles, etc, silver-nanoparticles have attracted special attention due to their excellent physicochemical properties, which include catalytic properties, electrical conductivity, thermal properties, surface Plasmon phenomenon and biological properties [18–20].
Metal nanoparticles synthesis using biological agents which are less harmful and non-toxic, termed as green chemistry, involve agents like microorganisms, fungus, plant, and their products including the leaf extracts [21, 22]. Recent studies report the synthesis of silver nanoparticles synthesis using leaf extracts from plants such as Sorbus aucuparia leaf [21], Aloe vera [23], Neem [24], ocimum leaf [25], kigelia Africana [26] leaf extract and olive leaf [27], Zingiberaceae species [28], Melia azedarach [29] etc.
In this study, we attempted to evaluate the process of silver nanoparticles formation using Litchi chinensis leaves and its effect on their size distribution and physicochemical properties. Litchi chinensis is commonly known as lichee, lychee, Mountain lychee in China, Indonesia, and Thailand. Recent reports have shown that Litchi chinensis fruit and the seeds hinder the growth of cancer cells [13, 23, 30]. Also, the fruit, and seeds possess many bioactivities such as hypoglycemic, anticancer, antibacterial, anti-hyper lipidemic, anti-platelet, and antiviral [31–33] properties. The study was undertaken, considering the vast majority of advantages that this litchi Chinensis have and the scarce information available in the literature about their leaf extracts used for the synthesis of silver nanoparticles.
The study was carried out to understand the effect of silver metal ion concentrations, leaf extract quantities, reaction temperature conditions, and reaction incubation time to optimize the route for the specific sized stable synthesis of AgNPs.
2. Experimental
2.1. Material and methods
Silver Nitrate (AgNO3), Sodium hydroxide (NaOH) and hydrochloric acid (HCl) were obtained from Sigma Aldrich Chemicals. Fresh leaves of litchi Chinensis were collected from botanical garden Panjab University, Chandigarh, India. The major compounds of litchi chinensis are: alkaloids, flavonoids (epicatechin, procyanidin A2, proanthocyanidin B2), terpenoids and steroids. The reducing and scavenging power of epicatechin is more than that of procyanidin A2, proanthocyanidin B2 [33]. Epicatechin have more reducing power due to presence of hydroxyl group and antioxidant activity. The chemical structure of epicatechin, procyanidin A2, proanthocyanidin B2 as shown in figure (1).

Figure 1. Molecular structure of chemical constitute present in LCLE [34].
Download figure:
Standard image High-resolution image2.2. Preparation of leaf extract
Litchi Chinensis leaves were washed with tap water and then with DI water to remove dust and dirt particles. Then leaves were dried and powdered finely using a grinder. 3 gm of leaf powder was boiled in 50 ml of DI water for 20 min The leaf extract was filtered through Whatman filter paper No. 1 and stored at 4 °C for further use, as shown in the schematic representation Figure (2).
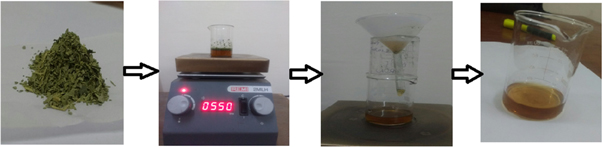
Figure 2. Picture depiction of Leaf extracts preparation.
Download figure:
Standard image High-resolution image2.3. Characterization of silver nanoparticles
2.3.1. UV–vis spectroscopy
Uv–Vis spectral studies to obtain the surface plasmon resonance (SPR) spectra were carried out on LABINDIA UV-3000+ spectrometer. The synthesized AgNPs were examined by scanning the sample in the wavelength range of 200–800 nm. The absorption spectra at different metal ion concentration, varying LCLE quantities, temperature, and pH values were obtained using UV–vis Spectroscopy. The single peak at 436 nm indicates the formation of spherical AgNPs.
2.3.2. Fourier transform infra red (FTIR)
The samples were screened for FTIR spectra using Bruker Tensor 27 Fourier Transform Infrared in attenuated Total Reflection mode. The spectral range was 400–4000 cm−1 with a resolution of 4 cm−1. FTIR was performed to analyze the bio- molecules responsible for the reduction of silver salt solution to silver-nanoparticles.
2.3.3. Dynamic Light Scattering (DLS)
The size distribution of AgNPs was carried out using Malvern zetasizer (ZEN3600).
2.3.4. X-ray diffraction (XRD)
The x-ray diffraction pattern of AgNPs was recorded on Rigaku Miniflex600 x-ray diffractometer with Cu-Kα radiation (0.15406 nm). Scanning speed was 5°/min and scan range was selected from 2θ = 20° to 80°. The films were deposited on a glass slide by drop casting method, placed it to dry, and XRD pattern was recorded.
2.3.5. Scanning Electron Microscopy (SEM)
The particle size and morphological features of nanoparticles were analyzed by scanning electron microscopy. The sample was placed on a copper grid for SEM coated with carbon. The grid was fixed into the sample holder and placed in a vacuum chamber of the electron microscope, and the SEM images were recorded (operating voltage 12.0 kV).
2.3.6. Transmission Electron microscopy (TEM)
Transmission electron microscope, Hitachi (H-7500) operating at voltage of 120 kV and equipped with CCD. This instrument has the high resolution of 0.36 nm with 40–120 kV operating voltage and can magnify object up to 6 lakh times in high resolution mode. The particle shape and size were analyzed by TEM.
3. Result and discussion
3.1. Preparation of silver nanoparticles (AgNPs)
AgNO3 (6 ml, 1 mM) was kept on a magnetic stirrer. After that 15 μl of the prepared LCLE solution was added drop wise to AgNO3 (1 mM) solution. The color of the solution changes to dark brown within a few minutes, which indicates the formation of AgNPs. The vial 1 contains the LCLE, vial 2 silver salt solutions (1 mM), and vial 3 shows the change in color of silver salt solution after reduction by LCLE. The difference in the color of the solution was due to surface plasmon vibrations of AgNPs and observed by the presence of a peak at 436 nm (Figure 3(b)) UV–vis spectroscopy [21]. Both the visual color change and presence of SPR peak at 436 nm confirms the reduction of silver salt solution to AgNPs by LCLE. The various reaction conditions for the synthesis of AgNPs are given in Table 1.

Figure 3. (a) Visual analysis of AgNPs formation due to LCLE. The leaves extract solution [1], silver-nitrate solution [2], formed silver-nanoparticles of brownish color [3]; and (b) Absorption spectra of LCLE and AgNPs.
Download figure:
Standard image High-resolution imageThe synthesized AgNPs obtained was evaluated to various experimental reaction conditions such as temperature of reaction, metal ion concentration, leaf extract quantity, and contact time on the size of nanoparticles formation.
3.2. Effect of leaf Extract Quantity
The effect of the LCLE quantity of 3 μl, 5 μl, 15 μl, 25 μl, and 50 μl on the reaction mixture was evaluated. It was observed from UV–vis spectra that large sized AgNPs are formed if the LCLE reaction quantity was fixed at 3 μl and 5 μl. On the other hand, lower quantities of LCLE did not resulted in the AgNPs formation [35, 36]. With the increase of the leaf extract quantity to 15 μl, the SPR peak becomes sharper and narrow at 436 nm. When LCLE quantities further increased from 25 μl to 50 μl, then peak shifts to 445 nm and 470 nm, indicating the formation of the larger size nanoparticles (Figure 4). At above mentioned weight to volume ratio of the LCLE extract, the 15 μl was the optimal quantity of leaf extract for the formation of small and narrow sized distribution of nanoparticles.
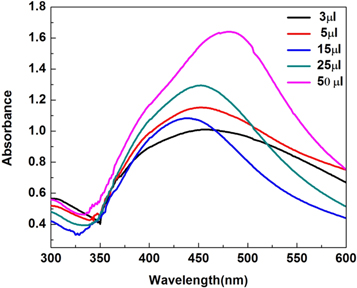
Figure 4. SPR peak of AgNPs with varying leaf extract quantities.
Download figure:
Standard image High-resolution imageTable 1. Various reaction conditions.
| Sample No. | Temperature (°C) | Volume AgNO3 (1 mM) (ml) | pH | LCLE [3/50](w/v) (μl) |
|---|---|---|---|---|
| 1 | 40 | 6 | 7 | 3 |
| 2 | 40 | 6 | 7 | 5 |
| 3 | 40 | 6 | 7 | 15 |
| 4 | 40 | 6 | 7 | 25 |
| 5 | 40 | 6 | 7 | 50 |
Table 2. Comparison between recent reports on leaf assisted synthesis of AgNPs.
| Sr No. | Various experimental reaction conditions | Study conditions | Other studies |
|---|---|---|---|
| 1 | Temperature | 40 °C | 70 °C [21], 60°–80 °C [37], 28 °C [38] |
| 2 | Quantity of leaf Extract | 15 μl{3/50}(w/v) | 10 ml [35], 5 ml [29], 10/100(w/v) [38],{5/100}(w/v) [39] |
| 3 | Reaction compellation time | 40 min | 60 min [29], 120 min [39], 120 min [39], 24 h [40] |
| 4 | Size | 40–50 nm | 16 nm [9], 3 nm [17], 10 nm [41], 28 nm [38], 27–79 nm [40], 100 nm [42], 25 nm [37], 25–30 nm [27]. |
| 5 | FTIR | Peaks 2915 cm−1 phenol, 1632 cm−1 ketone, 1404 cm−1, C–H, 1051 cm−1 ester | Peaks 1709 cm−1 , 1583 cm−1 , 1358 cm−1 [21] , 2923 cm−1 , 1648 cm−1 , 1376 cm−1 [25] |
| 6 | pH | 7 | pH 4–10 [9, 43] |
3.3. Effect of metal salt concentration
We have studied the effect of silver salt concentration (0.25 to 1 mM) on the formation of AgNPs (Figure 5). From the SPR peaks obtained in Figure 4, it is clear that at or above 0.5 mM of silver salt concentration, the seed formation of silver takes part in the nanoparticles synthesis. Below 0.5 mM, the silver concentration is too low to form the silver seed for the nanoparticles synthesis [36].
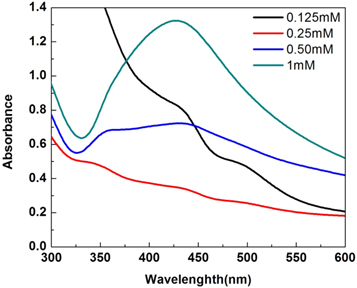
Figure 5. The UV–vis absorption of AgNPs prepared using different metal ion concentrations.
Download figure:
Standard image High-resolution image3.4. Effect of reaction time on the synthesis of AgNPs
Effect of reaction time on the formation of AgNPs was analyzed using the SPR peaks by UV–vis spectroscopy. It is clear from Figure 6 that peak sharpness increases at 436 nm with the increased time [41, 44]. The formation of AgNPs starts within 10 min after AgNO3 reacts with LCLE. The variation in peak intensity is observed from the SPR spectra. The reaction goes to completion in 30 min and beyond which extending the reaction time has no further effect on the formation of the nanoparticles as observed with no change in SPR peaks.

Figure 6. The UV–vis spectra of AgNPs for different reaction times.
Download figure:
Standard image High-resolution image3.5. Effect of temperature
Temperature also affects the reaction process of silver reduction to AgNPs. Experiments were carried out at different temperature 30 °C–100 °C. At lower temperatures of either 30 °C or 40 °C, the reaction took 30 min to complete the reduction process and the color of the solution was changed to yellow. At 30 °C SPR peak was very broad whereas, at 40 °C SPR was sharp at 436 nm. At or above 60 °C, metal ions get converted into nanoparticles at a faster rate, and deep brown color of the solution was observed [9, 27, 45].Within 10 min duration of the reaction time, over 90% of the reduction process using the LCLE was completed. UV–vis spectroscopy shows sharp, intense, and narrow SPR peak at or above 60 °C temperature (Figure 7). Increasing the temperature from 60 °C to 100 °C shifted the SPR peak from 436 nm to 445 nm. So at higher temperatures, size of the nanoparticles increased as evident from the SPR peaks red-shift. This shift was due to thermal instability of nanoparticles, as surface energy of nanoparticles increases, particles get aggregated. Therefore the optimal temperature was considered as 40 °C for the formation of small size nanoparticles which also had high solution stability over long standing as compared to nanoparticles formed at other temperature ranges.

Figure 7. The effect of temperature on the UV–vis spectra of AgNPs.
Download figure:
Standard image High-resolution image3.6. Dynamic Light Scattering (DLS)
The DLS was used to determine the size distribution of prepared silver nanoparticles at controlled parameters AgNO3 (1 mM), LCLE (15 μl), and pH 7. The size distribution of AgNPs had shown Figure (8) average hydrodynamic size of prepared nanoparticles around 43 nm.

Figure 8. The size distribution by the intensity of AgNPs recorded at AgNO3 (1 mM), pH 7 and LCLE (15 μl).
Download figure:
Standard image High-resolution image3.7. Fourier Transform Infrared (FTIR) spectroscopy
The FTIR analysis had been used to identify the chemical compounds involved in the reduction of AgNO3 to AgNPs by LCLE. Figures (9(a), (b)) shows the band of LCLE and AgNPs respectively. In LCLE spectra, the band 3751 cm−1 and 3273 cm−1 corresponding to (O–H) stretching of phenol group. The band at 2937 cm−1 , 2153 cm−1, 1606 cm−1 due to aromatic C–H stretching, C=C=O stretching of ketone and aromatic C=C stretching of alkane ring, 1391 cm−1, 1284 cm−1and 1099 cm−1, corresponds to O–H bending of phenol, C-N stretching and C–O stretching of aliphatic ester. The peaks at 1067 cm−1, 907 cm−1, 865 cm−1and 763 cm−1 belong to C–O stretching of alcohol and C=C bending of alkenes [46, 47] . The peak in AgNPs spectra at 1724 cm−1 , 1632 cm−1 and 2850 cm −1 due to aliphatic ketone and C=O of ketone, –C=C– and N–H amide stretching . In comparison spectra of AgNPs formed by reduction of AgNO3 using LCLE with spectra of LCLE the band at 3751 cm−1 shifted to 3782 cm−1 , 3273 cm−1 shifted to 3377 cm−1, 865 cm−1 to 858 cm−1 due to ion exchange reaction between phenol. The band at 2937 cm−1 shifted to 2915 cm−1 arises due to aromatic C–H stretching, 1606 cm−1 to 1632 cm−1 due to formation of ketone (benzoquione) during oxidation of reaction, 1391 cm−1 to 1404 cm−1 corresponds to (C–H) bending of aldehyde because of the conjugation of the aromatic ring, 1099 cm−1 to 1051 cm−1 due to ester linkage and presence of epicatechin, procyanidin A2, proanthocyanidin B2 adsorbed on nanoparticles surface [31, 36]. The chemical present in extract plays a vital role in reduction. FTIR conclude that flavonoids, phenol, hydroxyl and amide present in leaf extract which act as reducing and stabilizing agent. The reaction mechanism was shown in Figure (10(a)). Ag + ion react with epicatechin (polyphenol form) and form intermediate product Ag-epicatechin complex which is further oxidized to gave rise to quinone, hydrogen atom and electrons. The electron reduced Ag + ion into Ag atom. The hydroxyl (OH) was replaced by oxygen as shown in Figure (10(b)).

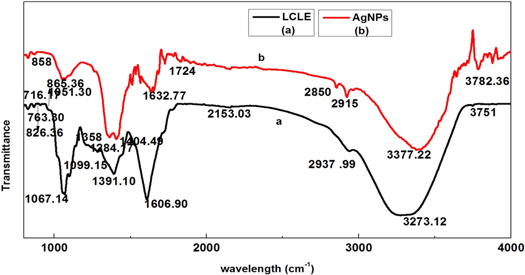
Figure 9. The FTIR spectra of (a) Litchi Chinensis leaf extract and (b) AgNPs recorded at AgNO3(1 mM), pH 7 and LCLE (15 μl).
Download figure:
Standard image High-resolution image
Figure 10. (a) Reaction mechanism polyphenol reduced to quinone and Ag + to AgNPs (b) hydroxyl replaced by oxygen mechanism.
Download figure:
Standard image High-resolution image3.8. X-ray diffraction
The XRD pattern of AgNPs synthesized using Leaf extract at 40 °C is shown in figure 9. The Bragg reflection peaks with 2Ө values of 37.92°, 46.1°, 64.14° and 76.62° were observed and indexed as the (1 1 1), (2 0 0), (2 2 0) and (3 1 1) planes, respectively [7, 44]. By comparing JCPDS card no 00-004-0783, the pattern of green synthesized AgNPs is found to have face centered cubic (FCC). XRD pattern thus clearly indicates that the silver nanoparticles formed by this method are crystalline. The unassigned peaks at 2θ = 54.7°, 57.34°, and 67.46° denoted by (*) in figure 11 might be due to the bio-molecules present in Leaf extract [48, 49]. The average crystal size is around 22 nm as calculated by Debye Scherer formula [46]

Where D is the crystal size, λ is the wavelength of x-ray, θ is the Braggs angle in radians and β is the full width at half maximum (FWHM) of the peak in radians.
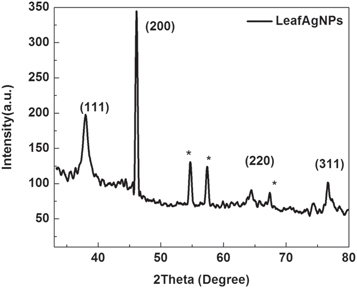
Figure 11. XRD pattern of AgNPs recorded at AgNO3 (1 mM), pH 7 and LCLE (15 μl).
Download figure:
Standard image High-resolution image3.9. Scanning Electron Microscopy (SEM)
SEM image of synthesized AgNPs Figure 12 showed nanoparticles were spherical with an approximate diameter in the range of 20–50 nm. In other studies, the size of AgNPs is less [50]. For biological studies like MCF 7, it was observed that nanoparticles size near 50 nm were more effective for cell treatment as compared to a smaller size around 20 nm [51].
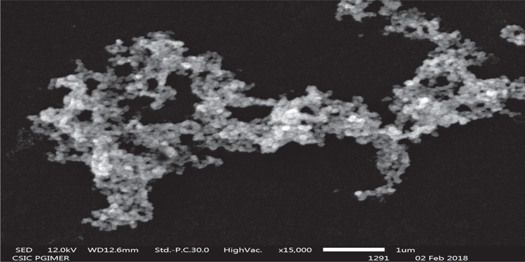
Figure 12. Scanning Electron Microscopy image of AgNPs recorded at AgNO3 (1 mM), pH 7 LCLE (15 μl) and 40 °C.
Download figure:
Standard image High-resolution image3.10. The stability of AgNPs under varying pH
As most of the nanoparticles are used for biological in vitro and in vivo experiments, the effect of pH on the stability of AgNPs was also observed. As pH increases, AgNPs starts to aggregate to form large sized nanoparticles. Sodium hydroxide (NaOH) in water dissociate into Na+ and OH- ions. At higher pH large number of OH- ions was present which also helps to reduce Ag+ to Ag° atom. Due to high surface energy and instability of NPs, Ag atoms get adsorbed on adjacent site and results to form larger size particles [52]. Also there was change in properties of bio-molecules, which act as capping agents, may affect their stabilizing abilities. At lower pH values, driving force is high for AgNPs dissolution that balances repulsive force to maintain the dispersion of NPs, as a result smaller size of AgNPs [53]. 13(b) figure clearly shows that increasing the pH from the physiological range red-shifts the SPR indicating and larger sized particle formation and reducing the pH blue shifts the SPR peaks indicate smaller size nanoparticles. Figure 13(a) visually confirms the change in color of AgNPs becomes darker brown with an increase in pH. The size change due to change in the pH could be accounted for the change in overall surface [45]. 13(a) figure visually confirms the change in color of AgNPs becomes darker. 13(c) shows the linear relationship between pH values and SPR values.
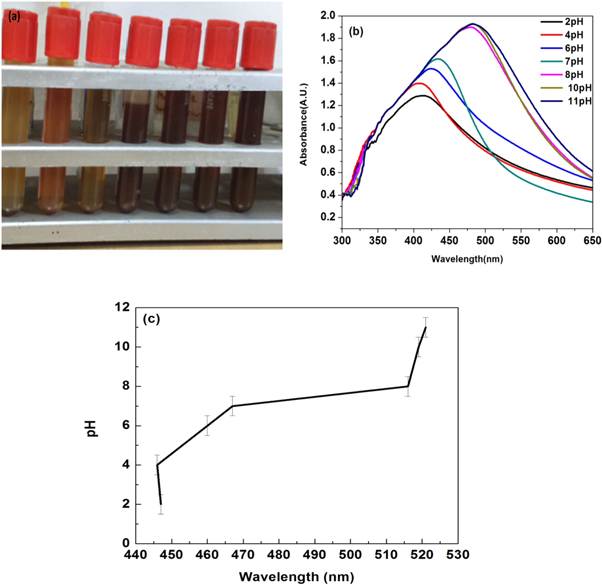
Figure 13 . (a) The change in the color with changing pH from pH 2 to pH 11 (b) UV–vis spectra of AgNPs (1 mM, 15 μl) at different pH values (c) Linear relationship between pH values and wavelength.
Download figure:
Standard image High-resolution image3.11. Transmission electron microscopy (TEM)
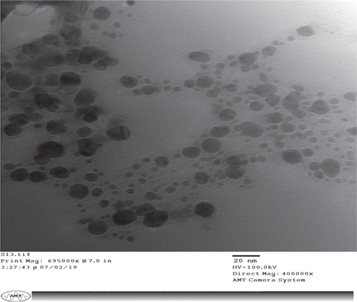
TEM image elucidate shape and size of AgNPs. TEM observation was taken out for AgNPs (1 mM, 15 μl). The AgNPs were spherical in shape and particle size is between the ranges of 10–50 nm. The average size was found to be approximately 43 nm (Figure 14).
Figure 14. Transmission Electron Microscopy image of AgNPs recorded at AgNO3 (1 mM), LCLE (15 μl), 40 °C.
Download figure:
Standard image High-resolution image
In this study we attempted to evaluate the process of AgNPs formation using LCLE and its effect on their size distribution and physicochemical properties. We have synthesized a specific range 40–50 nm sized stable nanoparticles in the solution at the optimal temperature of 40 °C, with the reaction duration of 30 min, metal ion concentration 1 mM of , leaf extract 15 μl (w/v) and stable at physiological pH 7 . Comparison between recent reports on leaf assisted synthesis of AgNPs is given in Table 2.
4. Conclusion
We have prepared AgNPs by green synthesis method using litchi chinensis leaf extract, which acts as both reducing as well as a stabilizing agent. The single SPR peak at 436 nm indicates the formation of spherical AgNPs. We observed the effect of various physicochemical parameters on the stability of AgNPs. The optimal size was achieved by adjusting leaf extract quantity, temperature, and metal ion concentration. The formation of AgNPs starts as soon as leaf extract comes into contact of silver salt solution. Only 10 min and 15 μl LCLE is required to convert more than 90% of AgNO3 (1 mM) to AgNPs at 40 °C temperatures. DLS measured the average size distribution was 43 nm, which was further confirmed by SEM and TEM. SEM and TEM show average particle size 43 nm and were spherical in shape. FTIR confirm that bio-molecules were responsible for reducing and capping agent. The XRD show crystalline nature of AgNPs. Post-synthesis, the stability of AgNPs show red-shift at higher pH 8–11 values and show a blue shift at lower pH 2–6 due to change in surface properties of bio-molecules. The shift in UV–vis spectra were also due to change of net charge of complex agent, surface energy and dissociation of bonds. AgNPs are stable at physiological pH, which is very useful for biological studies. The nanoparticles prepared by this method are a cost-effective, simple procedure and also compatible for large medical application which further needs exploration as anticancer agents.
Acknowledgments
The author (Ramanjeet Kaur) is thankful for financial assistance in the form of research fellowship received from the DST PURSE grant. The authors acknowledge the support received from the Department of CSIC, PGIMER in carrying out SEM characterizations and SAIF and CIL, Panjab University for TEM characterization.
Data availability statement
All data that support the findings of this study are included within the article (and any supplementary files).