

Abstract
Fused deposition modeling (FDM) has some advantages compared to other additive manufacturing techniques, such as the in situ integration of functional components, like sensors, and recyclability of parts. However, conventional filament-based FDM techniques are limited to thermoplastic elastomers with a Shore hardness above 70 A, thus it has marginal compatibility with soft robotic structures. Due to recently emerging pellet-based FDM printer technology, the fabrication of soft grippers with low Shore hardness has become possible. In this study, styrene based thermoplastic elastomers (TPS) were used to print elastic strips and soft gripper structures down to a Shore hardness of 25 A with an integrated strain sensing element (piezoresistive sensor). Printing on a soft rather than rigid substrate affects the integration of the printed thread on the substrate, because of the softness and relaxation, during the printing softness. It was seen that integrating the sensing element on a substrate with higher Shore hardness decreased the elongation at the point of fracture and the sensitivity of the sensing element. A soft compliant gripper structure with an integrated sensing layer was printed with the TPS-based elastomers successfully, and even due to the complex deformation of the compliant gripper structure, several positions could be detected successfully. Opened and closed position of the gripper, as well as, size recognition of spools of different sizes could be monitored by the piezoresistive printed sensor layer. The most sensitive sensing performance was obtained with the TPS of the lower Shore hardness (25 A), as the value of relative change in resistance was 1, followed by the gripper of Shore hardness 65 A and a relative change in resistance of 0.51. With this study, we demonstrated that pellet-based FDM printers can be used, to print potential soft robotic structures with in-situ integrated sensor structures.
Export citation and abstract BibTeX RIS

Original content from this work may be used under the terms of the Creative Commons Attribution 4.0 license. Any further distribution of this work must maintain attribution to the author(s) and the title of the work, journal citation and DOI.
1. Introduction
In the last years, additive manufacturing (AM) of soft materials has become an interesting fabrication for soft and flexible electronics embedded in elastomers [1–4]. Often, casting methods are used for the fabrication of soft robotic structures with high elasticity and low Shore hardness. Unfortunately, the casting process is very time consuming and therefore faster and low cost technologies, like material extrusion based AM, are highly interesting for the fabrication of stretchable electronic parts [5]. Additionally, the possibility to produce multi-material structures with integrated functional parts, makes extrusion based AM very attractive to develop soft robotic systems [6–8]. Direct ink writing and fused deposition modeling (FDM) are the two widely used extrusion based AM processes. Direct ink writing is a method, that has been often used to develop structures with soft piezoresistive strain sensors [6, 9–11]. However, the rheological properties of the elastomers, low resolution of the printed structures and the additional required post processing, after the printing, are the main disadvantages of this method [12, 13].
FDM or fused filament fabrication, is based on material extrusion of a polymeric melt for creating a structure with layer-by-layer deposition [14, 15]. Solid structures can be simply obtained by cooling below the melting point of the thermoplastic. The material is introduced in the form of a filament and this method can be used for the development of elastomer structures with strain sensors [16]. In previous studies, it was demonstrated that thermoplastic polyurethane (TPU) based piezoresistive sensors show improved performance (low drift and relaxation behaviour), if printed on soft TPU gripper substrates [17, 18], whereas a lower gauge factor (GF) was observed. However, the FDM technology has still limitations for the use in soft robotic applications [19–21]. Elastomer filaments of low Shore hardness and elastomer-based composite filaments with high filler content (>20 wt.%) cannot be used for the filament-based FDM technology, because they coil around the gear system that supplies the filament to the heated zone of the printing head and the extrusion nozzle [22–25]. Instead of direct drive or Bowden-type extruder based printers for filament based FDM technology, single-screw extruders have been developed recently, and allow the printing with polymer pellets (granulates) [26]. Pellet based FDM printing has been already reported for biomedical materials, however, thermoplastic elastomers (TPEs) have not been extensively explored [27–29].
Soft grippers with integrated sensors can find application in many fields that require careful handling and manipulation of sensitive objects, like in the food industry [30]. Strain sensors can be used to monitor the deformation of the gripper structure. The deformation will result in a change of the electrical sensor signal [31–34]. The signal from the sensor can be used to control the movement of the gripper, based on the electrical sensor signal using a closed-loop control system [35–37]. This will allow to use such gripper for the automatic packaging of sensitive food like fruit. Additionally, the size and the ripeness of the fruit can be detected automatically [38–41]. In order to produce soft robotic grippers, the use of soft TPEs with a Shore hardness similar to silicone (<50 A) is required, but such elastomers are not printable with conventional FDM method based on filaments.
In this attempt, pellet-based FDM is being presented as a method of producing soft sensors embedded on a TPE substrate with a Shore hardness below 70 A. In this study, the 3D printing of styrene-based TPE piezoresistive sensor (TPS) in combination with TPS structures, based on Shore hardness between 65 A and 25 A, will be investigated. The effect of the Shore hardness of the substrate on the mechanical and electrical properties will be discussed. The differences in the cross-section of the printed threads, when printed on the substrates of lower and higher Shore hardness will be compared. Dynamic and quasistatic experiments are performed, to investigate the sensing behaviour of the piezoresistive composite structures. Finally, a compliant soft robotic gripper structure with integrated strain sensor element will be presented as a demonstrator.
2. Materials and methods
2.1. Fabrication of piezoresistive material
As described previously [42, 43], a conductive thermoplastic composite was mixed, (Torque rheometer HAAKE PolyLab OS, Thermofisher, Durlach, Germany) at 195 °C for 60 min, extruded in the form of a filament with a 1.75 mm diameter, using extrusion temperature of 195 °C (Capillary rheometer RH7, Netzsch-Gerätebau, Selb, Germany) cut into pellets with a length between 3 and 5 mm. The capillary rheometer was equipped with a 1.75 mm die and a 500 mbar pressure sensor. In order to ensure that the filler was homogeneously distributed in the matrix, the pressure was recorded with time (figure S1 (available online at stacks.iop.org/FPE/7/025010/mmedia)). After the extrusion process, the filaments were cooled to room temperature and cut into pellets with a length between 3 and 5 mm. The composite consisted of styrene-ethylene-butylene-styrene triblock copolymer from Kraiburg TPE (Waldkraiburg, Germany) and carbon black from TIMCAL (Bodio, Switzerland). The two components were mixed in 1:1 mass ratio. The large carbon black concentration (50%wt) ensured that the resulting composite had a resistivity at the conduction zone of the percolation curve of the composite [44, 45].
2.2. Additive manufacturing with pellet printer
For the printing of the TPE structures, 3 mm styrene-ethylene-butylene-styrene triblock copolymer (TPS) pellets, with three different Shore hardness (Sh25A, Sh50A and Sh65A), from Kraiburg TPE (Waldkraiburg, Germany), were used. For the 3D printing, the pellet printer TU-maker Voladora NX+ (International Technology 3D Printers S.L., Valencia, Spain), equipped with a single-screw extruder (figure 1(a)) was used. The temperature used for the printing (250 °C) was higher than the temperature used in section 2.1. The reason for that was that heating zone was significantly shorter compared to the capillary Rheometer and therefore, the material spent shorter time in the heating zone. To compensate for this fact and ensure an adequate adhesion for the printed elements, a higher temperature was necessary. Printing of the substrate and the sensor parts could be obtained using the following parameters: Nozzle size of 0.6 mm, Nozzle temperature of 250 °C, printing bed temperature of 45°, layer height of 0.2 mm and printing speed of 15 mm s−1. An extrusion multiplier of 8 was used for the substrate of Shore hardness 65 A, 12 for the 50 A and 16 for the 25 A. The extrusion multiplier has been defined a parameter for controlling the extrusion rate, expressed by the volume of the melted plastic material that flows through the nozzle per unit time [46].

Figure 1. (a) Parts of a pellet FDM 3D printer (b) sensor strip printed with the pellet printer, with a total length of 130 mm, a width of 10 mm and height of 0.6 mm.
Download figure:
Standard image High-resolution imageTo achieve multi-material printing with a single pellet printing head, we first printed the substrate material and finally the sensor material on top of it. For the tensile testing the resulted structure will be called sensor strip (figure 1(b)).
2.3. Extrusion of single piezoresistive fiber sensor
To investigate the sensor behaviour of the single piezoresistive element for later comparison, fiber with a diameter of 0.6 mm were extruded using the TU-maker Voladora NX+ 3D printer. Pellets of the piezoresistive sensor were fed through a hopper and the threads were extruded with a temperature of 250 °C. The cross-section of the fiber was measured as the average of three samples.
2.4. Tensile testing
To investigate the piezoresistive behaviour of the fiber sensor and the sensor strips, a tensile test with a simultaneous recording of the electrical signal was performed. For the tensile tests, a Zwick Roell Z005 tensile testing machine with pneumatic clamps, with a pressure of 4 bars and a 200 N load cell (ZwickRoell, Ulm, Germany) was used. A gauge length of 50 mm, for the fibers and the sensor strips, was used.
For the electrical measurements, a Keithley 2450 multi-meter (Keithley Instruments, Solon, USA) was used. The sampling rate of 10 Hz was selected. Tensile tests were performed up to the point of fracture. In addition, dynamic conditions (cyclical testing) and also quasistatic testing involving a dwell time of 10 s were performed. The cross-head speed during the tensile experiments was 400 mm min−1. This speed was selected based on the speed of the servomotor, when performing the robot experiments.
The relative resistance (Rrel) was calculated using the following formula:
where R is the value of the resistance and R0 the value of the resistance when no strain is applied to the sensor.
For defining the sensitivity of the sensor, the GF was used, as defined by the following equation:
As for the resistivity, the following formula was used
where A is the cross-section, measured with the optical microscope and l the distance between the electrodes, performing the measurement.
Based on the dynamic tensile testing, the mechanical and electrical drift between different cycles was calculated (figure 2(a)). The electrical drift was defined as a percentage of the difference in the value of the relative resistance at the same strain during two different cycles of the dynamic testing. Using quasistatic testing, the mechanical and electrical relaxation were analyzed. Based on the mechanical and electrical signal at the beginning and the end of the dwell time the relaxation was calculated. Figure 2(b) shows the investigation of signal relaxation behaviour schematically. For the tensile measurements, the figures represent the testing for one sample.
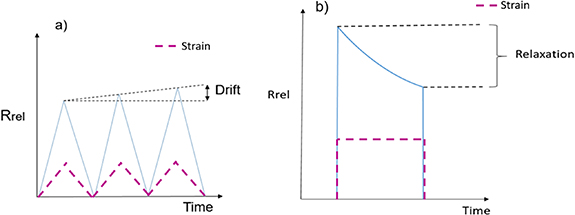
Figure 2. Schematic representation of the calculation of (a) the drift during three cycles of the dynamic tensile test and (b) the relaxation of the electrical signal during one cycle of the quasistatic tensile test.
Download figure:
Standard image High-resolution image2.5. Optical imaging
The dimensions of the printed structures were investigated with a light microscope from Carl Zeiss AG, (Jena, Germany). Before the imaging assessment, the samples were immersed in liquid nitrogen and then cut in the middle, so that the cross-section was visible. A polygonal fitting tool was used for calculating the cross-section area. For calculations of the cross-section, the average of three measurements was used. Standard deviation for the height was not calculated, because it was not constant over the width of the cross-section. The standard deviation values were reported for the cross-section area.
2.6. Compliant soft robotic gripper
The compliant soft robotic gripper structure is based on a stiff base and a soft compliant part. The stiff base was printed with poly-lactic acid (PLA) using a Raise3D Pro 2 3D printer (Raise 3D, Irvine, USA). The soft compliant part with integrated strain sensor element was printed with TU-maker Voladora NX+. In order to be able to detect deformations at the entire length of the compliant gripper, the electrodes were placed at positions A and B, as can be seen in figure 3(b). For the planned application, a maximum deformation of 10% between points A and B was calculated based on the bending angle, however, this value depends on the size of the spool gripped by the gripper. Two Tower Pro MG90S micro servos (Adafruit Industries, New York, USA) were used to move the gripper device. The control of the motors was performed with an Arduino microcontroller.
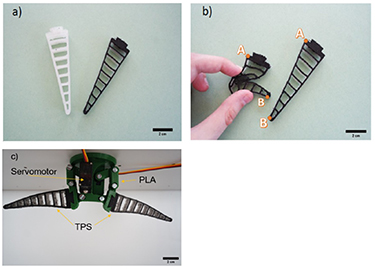
Figure 3. Compliant soft robotic gripper based on TPS printed soft part and piezoresistve sensor (a) top and bottom view; (b) top view with and without deformation; (c) assembled gripper with servomotor.
Download figure:
Standard image High-resolution image3. Results
3.1. Tensile test to the point of fracture
In order to assess the sensor behaviour of the piezoresistive elements, extruded fiber sensors were tested with a tensile test up to the point of fracture (figure 4). The test procedure to verify the sensor performance of fiber piezoresistive materials has been already reported by Georgopoulou et al [47]. The fiber was extruded using the pellet-based 3D printer and a constant diameter of 0.58 ± 0.02 mm diameter was produced.

Figure 4. Mechano-electrical response of a sensor fiber printed with an FDM pellet printer. (a) stress–strain response (b) resistance-strain response and (c) zoom at strains below 150% for the resistance strain response during the tensile test to the point of fracture.
Download figure:
Standard image High-resolution imageFor the stress–strain curve (figure 4(a)), a characteristic necking (yield point) at 13% strain can be observed. This necking is well-known from previous studies about TPS based sensors with high filler concentration [42, 47]. The sensor fiber can endure elongations up to 370% strain. Looking at the response of the electrical resistance (figure 4(b)), it can be seen that the sensor fiber exhibited a positive piezoresistive effect with the increasing strain. At the linear parts of the curve, the GF was 0.5 (strain 0%–24%), 19 (strain 24%–75%) and 38 (strain 200%–370%). The GF was not calculated at the non-linear parts of the curve. At strain below 24%, the resistance increased only very slightly with the increasing strain, but the sensitivity rapidly increased at higher strains (figure 4(c)).
Testing the sensor fiber revealed characteristics of the piezoresistive behaviour, however, a free standing sensor fiber is time consuming to integrate into a structure and according to this, sensor strips, based on TPS substrate with sensor element printed on top of the substrate, were fabricated. To investigate the mechano-electrical response of the strips, a tensile test up to the point of fracture was performed (figure 5).
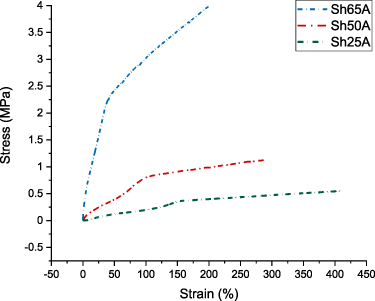
Figure 5. Stress–strain response during the tensile tests of the sensor strips made of TPS thermoplastic elastomers with three different Shore hardness (Sh65A, Sh50A, and Sh25A).
Download figure:
Standard image High-resolution imageIn figure 5, it can be seen that the sensor strips made with higher Shore hardness are stiffer, as expected. The necking at the yield point, observed for the sensor fiber, is not present for the strips. The elongation at the point of fracture decreased with the increasing Shore hardness of the support structure and therefore it can be concluded that the TPE of the substrate, and not the TPE-based sensing element with high filler content, will limit the fracture behaviour for soft robotic applications. The strain at point of fracture for the sensor strip (Sh25A) and the sensor fiber are similar; therefore, strain limitation due to the support structure can be neglected. Based on the analysis of Decroly et al, 400% strain is more than sufficient for the motoring of actuated soft robotic structures [48]. For all 3D printed sensor strips, the electrical signal response during the tensile test to the point of fracture are presented in figure 6.

Figure 6. Electrical signal response during the tensile tests of the sensor strips made of TPS thermoplastic elastomers with three different Shore hardness (Sh25A, Sh50A, and Sh65A). (a) Full stain range up to the point of fracture and (b) close up at strain from 0% to 50%.
Download figure:
Standard image High-resolution imageFrom the response of the electrical signal, it can be seen that in general, the shape of the resistance strain-curve was similar for all the sensor strips with the three different Shore hardness. The relative resistance, first sharply increased (positive piezoresistive effect), then decreased (negative piezoresistive effect) and then increased (positive piezoresistive effect) again until fracture occurred. The strain ranges of the minimum in the relative resistance curve (saddle point), appeared at lower strains with lower Shore hardness. Unexpectedly, the electrical response of the sensor strips is significantly different from the sensor fiber, where only a positive piezoresistive effect could be observed (figure 4). It is worthwhile to mention that for the printing of the senor strips and the compliant soft gripper, first the soft TPS structure was printed and later the piezoresistive sensor material was printed on top of it. We assume that printing of the piezoresistive sensor on a soft substrate resulted in different sensor performance because the soft substrate deformed during printing process by the normal pressure during printing. Normal pressure during printing occurs, because the extruded thread of 0.6 mm will be elliptically deformed to a smaller thickness (figure 7). After the printing, the soft substrate will move back (spring back effect) and a stress exerted on the printed sensor element will occur (figure 7(b)). Based on the total height of the printed sensor element (3 × 0.2 mm), it can be seen the element on the lower Shore hardness (figure 7(c)) is integrated deeper inside the substrate resulting in a larger cross-section area. In the 65 A sample (figure 7(e)); the sensor element was not deep inside the substrate. Therefore, height of the sensor element decreased with the increasing Shore hardness and the width increased (figures 7(c)–(e)). The cross-section area of sensor elements analysed by the optical microscope is shown in the table in figure 7. Even though that the soft substrate deformed during printing of the sensor elements, the cross-section area of all sensors is quite similar, resulting in a similar extrusion volume for all the strips. This was not the case in an older study, for TPU filament-based strips, where the cross-section showed a dependency to the Shore hardness of the substrate [18]. However, in the earlier study, the printing parameters were the same for all strips with different Shore hardness and therefore the differences could be attributed to a die swell effect. In the current study, however, the printing parameters were altered to counter for the die swell effect and thus, it was possible to obtain a similar cross-section for the three different Shore hardness strips. Therefore, we had to optimize the extrusion multiplier for each Shore hardness, as mentioned in the experimental section, the optimal multiplier was 8, 12 and 16 for the Shore hardness 25 A, 50 A and 65 A, respectively.

Figure 7. Printing of piezoresistive sensor material on top of the TPS substrate (a) result in a deformation of the TPS support material underneath the printing head; (b) moving of the printer head will result in a relaxation of the TPS support material, which will affect the total layer height of the sensor structure and the piezoresistive behaviour. Images of the cross-section of the sensing element on substrate (a) 25 A (b) 50 A and (c) 65 A. In the table, the cross-sections analysed by the optical microscope analysis are reported.
Download figure:
Standard image High-resolution imageIt is worthwhile to mention that printing the sensor elements on softest substrate (Shore hardness 25 A) resulted in a smearing problem. Therefore, the top layer of the substrate is contaminated with carbon over a wide area. Unfortunately, it was not possible to print the TPS structure on top of the piezoresistive sensor. In that case, the sensor would smear over the whole printing area of the TPS structure, potentially causing clogging to the 3D printing nozzle.
For comparison, the GF was evaluated between 200% and 230% strains, because in that range all the strips and the fiber show a monotonic response. The GF was calculated 70 for the Sh25A, 30 for the Sh50A and 35 for the Sh65A. From the values of the GF it can be seen that for both the 50 A and 65 A, the sensitivity is similar compared to the pure sensor fiber (GF = 38). However, the value is almost double for the Sh25A strip. This significant difference shows one more time the effect of the substrate stiffness on the sensor response. However, in comparison to TPU sensor strips, the trend of the GF is reversed [17, 18]. This fact might be explainable by the different polymer materials SEBS versus TPU. Georgopoulou et al has demonstrated, that polymer matrix material can significantly change the sensor behaviour of the piezoresistive material [49].
3.2. Dynamic testing: strain 0%–100%
According to Decroly et al, soft actuators in robotic application often have a deformation up to 100%, therefore, the first dynamic tensile testing was first performed at a range of strains 0%–100% (figure 8).
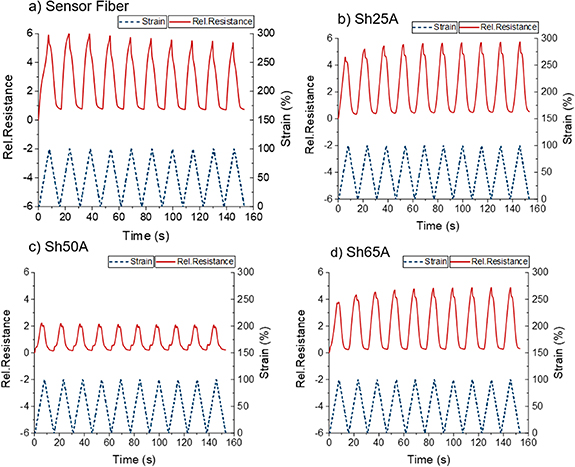
Figure 8. Dynamic cyclical response for (a) sensor fiber and the TPS sensor strips with three different Shore hardness (b) Sh25A (c) Sh50A, and (d) Sh65A. The fiber and strips were strained over ten subsequent cycles between strain 0% and 100%.
Download figure:
Standard image High-resolution imageFrom the dynamic cyclical response, it was seen that the sensor fiber (figure 8(a)) and the two TPS sensor strips 25 A and 65 A show similar relative resistance behaviour (figures 8(b) and (d)). As expected from the previous tensile test experiments, the sensor signal for the Sh50A strip is significantly smaller (figure 8(c)). Interestingly, the sensor strips printed with Sh50A coiled up after removing from the printing bed (figure S2). This was not the case for the other strips that remained straight after removing from the printing bed. This contrast could originate in the differences in the compositions to achieve the different Shore hardness of the TPS substrate material. In the case of the 50 A, the coiling up of the strips after the printing, could lead to the development of internal stresses in the sample, which could impact the sensor response.
Figure S3 shows the mechanical stress–strain behaviour of the sensor filament and the 3D printed strips. As expected, Shore hardness of the TPS affects the mechanical stress of the strips. As higher the Shore hardness of the TPS, the higher the mechanical stress. A stress plateau or negative stress value, at low strain indicates bucking behaviour for the sensor fiber and the strips (Table 1). The buckling effect, observed in figure S3, has been already reported for other 3D printed TPEs and it can be resolved by pre-straining the sensor [50–53]. In previous studies, the dynamic sensor behaviour of the piezoresistive element often showed uncertainty of the sensor signal at low strain because of the viscoelastic behaviour of the matrix material that was confirmed by the presence of buckling [49, 54, 55]. In these studies, the sensor was integrated into the soft matrix with casting methods or injection molding and uncertainty with the form of nonlinear response appeared for the sensor signal at low strains. The nonlinearity was then explained by the insufficient load transfer between the sensor fiber and the matrix. In the present work, despite the presence of buckling, the sensor signal did not show an uncertainty (plateau) at low strain. This shows that integrating sensors in soft elastomers, using FDM is a promising response for producing sensors with linear response, even for low Shore hardness materials (25 A). This observation was confirmed by another study, where a similar TPE was used, but in that case, the strips were strained only between 0% and 50% and a direct comparison with the current study, is not feasible [56].
Table 1. Summary of mechanical and electrical values for the strips with integrated piezoresistive elements. Between the second and last cycle (10th) of the dynamic tensile testing, the drift of the sensor signal was investigated. The strain where the buckling appears was derived from figure S4.
| Composite | Initial resistivity (Ωm) | Mechanical buckling at strain (%) | Drift of electrical signal at 0% strain (%) | Drift of electrical signal at 10% strain (%) |
|---|---|---|---|---|
| Sensor fiber | 855 ± 51 | — | — | — |
| Sh25A | 629 ± 76 | 4 | 5 | 1 |
| Sh50A | 421 ± 63 | 4 | 48 | 33 |
| Sh65A | 203 ± 48 | 2 | 6 | 5 |
3.3. Dynamic testing: low strain
In addition to the dynamic tensile tests up to 100% strain, dynamic testing up to 10% strain were performed, based on the calculated deformation of gripper for the large spool object with a diameter of 90 mm. Figure 9 shows the dynamic tensile cycle test up to 10% strain.
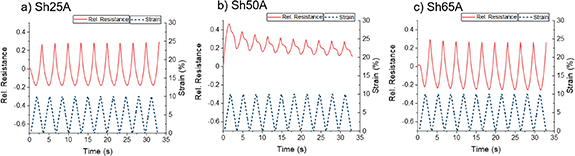
Figure 9. Dynamic testing up to 10% strain for the sensor strips with Shore hardness (a) Sh25A (b) Sh50A, and (c) Sh65A.
Download figure:
Standard image High-resolution imageBased on the results, no secondary peak can be observed in the sensor signal (figure 9). As expected from the previous analysis (figure 6), for the Sh25A and Sh65A strips a negative piezoresistive response can be observed. For the Sh50A strip, in figure 6, the slope of the relative resistance-strain curve was positive and therefore the positive piezoresistive response of the figure 9(b) correlates nicely to the previous results. Table 2 shows the summary of the mechanical and electrical sensor signal of the 3D printed strips with different Shore hardness.
Table 2. Mechanical and electrical relaxation for the different TPS strips with the integrated sensing elements derived from the quasistatic test. The values for the 10% strain were calculated from figure 9 and for 5% strain from figure S5. Drift of the electrical signal between the second and last cycle, for the different strips during the same test.
| Shore hardness of substrate | Mechanical relaxation (%) | Electrical relaxation (%) | Drift from 2nd to 5th cycle of signal at end of dwell time (%) | |||
|---|---|---|---|---|---|---|
| 5% strain | 10% strain | 5% strain | 10% strain | 5% strain | 10% strain | |
| 25 A | 18 | 25 | 6 | 18 | 2 | 18 |
| 50 A | 18 | 28 | 32 | 7 | 25 | 30 |
| 65 A | 19 | 28 | 9 | 7 | 1 | 3 |
It can be seen that the value of the resistivity decreased with the increasing Shore hardness of the substrate material. Similar results have been observed previously for injection molded silicone samples with integrated piezoresistive sensor fibers [54]. Based on this, it can be assumed, that the Shore hardness of the structure where sensor elements are integrated has an important effect on the sensing behaviour of the developed piezoresistive SEBS sensor. In addition to this, the initial resistivity results show, that the 3D printing also affects the electrical conductivity of the sensor elements. The reason for this phenomenon has not been investigated and should be part of further research activities. However, based on the optical microscope pictures of the cross section analysis (figure 7) it can be assumed that the softness of the substrate will affect the printing behaviour of the sensor material.
For the mechanical buckling behaviour of the three strips, it can be observed that the results do not correlate with the Shore hardness. It is worthwhile to mention that the SEBS of Kraiburg is a composite based on SEBS, PP (polypropylene), fillers and stabilizers, and therefore the Shore hardness and the mechanical behaviour can be adjusted in a wide range, by changing the material composition. The drift of the sensor signal, for the Sh50A strip is significantly higher and we assume that this is also related to the different material composition of the SEBS based composite. However, the strip based on the commercial TPE with the lowest Shore hardness (Sh25A) showed the smallest drift behaviour of the sensor signal at 10% strain.
3.4. Quasistatic testing
Quasistatic tensile experiments were performed between 0%–5% and 0%–10% strain, based on the calculated deformation of gripper for the small and the large spool object, with a diameter of 60 and 90 mm, respectively. Figure 10 shows the results for the strain up to 10%, a dwell time of 10 s was used at maximum and minimum strain. The results of the quasistatic test up to 5% strain are in the supplementary part (figure S5).

Figure 10. Quasistatic mechanical response for the strips (a) Sh25A (b) Sh50A, and (c) Sh65A and quasistatic sensor response for the strips (d) Sh25A (e) Sh50A and Sh65A. The strips were strained over five subsequent cycles between strain 0% and 10% with a dwell time of 10 s at maximum and minimum strain.
Download figure:
Standard image High-resolution imageThe stress at 10% strain increase using TPS with higher Shore hardness for the TPE substrate. This can be expected because of the relationship between Shore hardness and Young's modulus of the thermoplastic support material (figures 10(a)–(c)). For the electrical signal (figures 10(d)–(f)), it can be seen that the strips Sh25A and Sh65A exhibited reverse piezoresistivity and the Sh50A strips show positive piezoresistive response, similar to previous analysis (figure 9). The values of the relaxation of the stress and the resistance can be found in table 2. Looking at the mechanical relaxation, no significant differences can be seen between the strips of different Shore hardness. However, for the electrical relaxation at 5% strain, the 25 A and 65 A strips show the lowest relaxation. At 10% strain, a significantly higher electrical relaxation of the 25 A strip can be observed. Looking at figure 6, it can be observed that at around 10% strain the 25 A strip change from negative to positive piezoresistive behaviour. Based on these results, we assume, that it is essential to look at the full stain analysis up to the point of fracture to identify in which strain area the soft sensor material can be efficiently used as a sensor material.
4. Compliant soft robotic gripper with in situ integrated sensing elements
In order to assess the applicability of the 3D printed sensor to be used in soft robotic applications, compliant grippers were produced with the three different Shore hardness. As already mentioned, the performance of the compliant soft gripper structure was investigated using two spools with different diameters (60 mm and 90 mm in diameter). Two different experiments were performed: one repeatability test, where the gripper was gripping the same spool (90 mm) 5 times (figures 11(a)–(c)) and a spool size recognition test, where each gripper gripped first the bigger spool (90 mm) and then the smaller spool (60 m) (figures 11(d)–(f)).
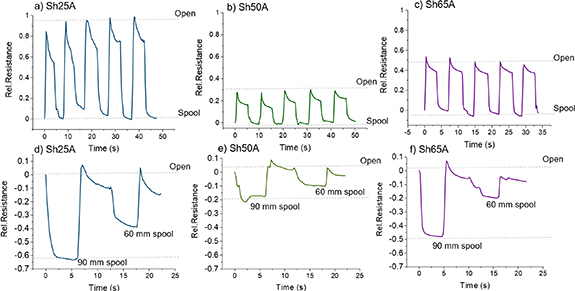
Figure 11. Signal of the TPS-based sensor during the repeatability test where the sensor moved from closed to open position gripping the same spool five times with multi-material pellet-based FDM with a substrate of Shore hardness (a) Sh25A (b) Sh50A (c) Sh65A and signal of the TPS-based sensor during the spool size recognition test for the TPS-based sensor on substrate of Shore hardness (d) Sh25A (e) Sh50A (f) Sh65A.
Download figure:
Standard image High-resolution imageFrom the quasistatic test, it was seen that the Sh25A compliant gripper showed the largest sensitivity of 1. The sensitivity is 0.28 for the Sh50A and 0.51 for the Sh65A. The relaxation was calculated at the third cycle (figure 11). For the relaxation of the signal in position open, 26% for the 25 A, 44% for the 65 A and 29% for the 65 A compliant gripper was calculated based on the quasistatic experiments shown in figure 11. When the gripper is gripping a spool, the deformation increases (figure 12) and in all the three compliant gripper structures, the resistance decreased. It is estimated that both tension and compression are present at the different sides of the compliant gripper structure [21]. Therefore, a direct comparison between the results of the gripper testing and the tensile experiments cannot be made. However, the same observations that were made during the tensile testing, like the superior sensitivity and the lower relaxation of the SH25A strip were also repeated in the case of the gripper. This shows that tensile testing can reveal some aspects of the piezoresistive sensor response, even if the loading profile in the actual application is different.
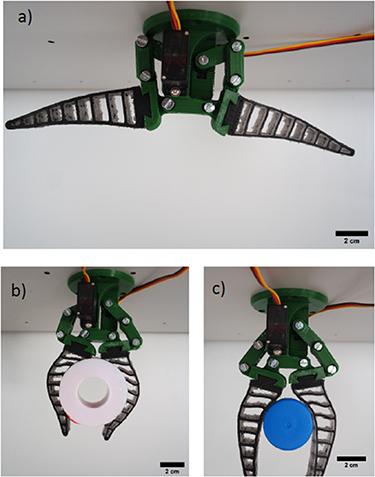
Figure 12. Gripper of Shore hardness 20 A in position (a) open (b) spool 90 mm and (c) spool 60 mm.
Download figure:
Standard image High-resolution image
It is worthwhile to mention that compliant gripper with soft SEBS (Sh25A) is interesting for soft robotic applications, because of the similar Shore hardness in comparison to silicone based material, typically used. Grippers with large softness and integrated sensor elements have great potential to be used in applications, where the careful manipulation of objects is required. The sensor signal can be used to create a closed-loop control system that will autonomously separate and sort by the size detection of the gripped objective. As already mentioned, the deformation of the gripper was calculated at approximately 10% and 5% for the spool with a diameter of 90 and 60 mm, respectively. Looking at figures 11(d)–(f), it can be seen that it is possible to distinguish between the larger and smaller spool, independent on the Shore hardness used to print the compliant gripper structure, therefore automatic detection using a software algorithm can be implemented.
5. Conclusion
In this study, piezoresistive TPE strain sensors, integrated in a thermoplastic elastomeric (TPE) substrate were produced using extrusion based AM method. A pellet-based FDM method was used to be able to print compliant gripper structures with a Shore hardness down to 25 A. Such a small Shore hardness is comparable to existing soft robotic gripper structures based on silicone material, but printing on a soft, rather than rigid substrate, affected the sensor performance. The effect of the Shore hardness of the TPE material on the piezoresistive sensor behaviour, during tensile testing and later in a compliant soft gripper structure was investigated. Because of the complex deformation of the compliant structure, sensor strips with TPE substrates of three different TPEs and a piezoresistive TPE sensor material were first investigated using uniaxial tensile testing machine. It was seen that integrating the sensor in a TPE substrate by FDM method resulted in a change of the piezoresistive sensor behaviour when testing up to the point of fracture. The elongation at the point of fracture was determined by the substrate material of the strip and not the sensing element. The sensitivity of the sensor signal decreased when the sensor material was integrated in the 3D printed strip structure. Based on the differences on the mechanical and electrical properties, an investigation of the cross-section of the sensing element was performed for the different strips. Despite the cross-section area being the same for the different strips, the morphology of the cross-section area was different, indicating that the element was integrated deeper inside the substrate thanks to the softness and relaxation of the substrate and this deeper integration could affect the stress transfer from substrate to element.
The strip with Shore hardness of 25 A exhibited good sensitivity and relatively low drift. The compliant gripper with the same Shore hardness also showed the best sensitivity and lower relaxation compared to the other two Shore hardness. Therefore, the developed soft gripper with integrated sensing element combined low Shore hardness with sufficient sensor properties to distinguish between objectives with different geometrical sizes. Even though relaxation of the sensor signal could not be avoided, separation and selection of objectives with different sizes is possible with the sensor integrated compliant soft robotic gripper, if the size of the objectives (e.g. change in resistivity signal) is larger than the relaxation of the sensor signal. The study shows, that it is possible to use multi-material printing approach to generate autonomous soft robotic gripper for industrial applications.
Acknowledgments
This project has received funding from the European Union's Horizon 2020 research and innovation programme under Grant Agreement No. 828818 (SHERO PROJECT).
Data availability statement
The data that support the findings of this study are available upon reasonable request from the authors.
Conflict of interest
The authors declare no conflict of interest financial or otherwise.