


Abstract
A detailed theoretical analysis of low-power, high-frequency and temporally precise optogenetic inhibition of neuronal spiking, with red-shifted opsins namely, NpHR, eNpHR3.0 and Jaws, has been presented. An accurate model for inhibition of spiking in these opsins expressed hippocampal neurons that includes the important rebound activity of chloride ions across the membrane has been formulated. The effect of various parameters including irradiance, pulse width, frequency, opsin-expression density and chloride concentration has been studied in detail. Theoretical simulations are in very good agreement with reported experimental results. The chloride concentration gradient directly affects the photocurrent and inhibition capacity in all three variants. eNpHR3.0 shows smallest inhibitory post-synaptic potential plateau at higher frequencies. The time delay between light stimulus and target spike is crucial to minimize irradiance and expression density thresholds for suppressing individual spike. Good practical values of photostimulation parameters have been obtained empirically for peak photocurrent, time delay and 100% spiking inhibition, at continuous and pulsed illumination. Under continuous illumination, complete inhibition of neural activity in Jaws-expressing neurons takes place at minimum irradiance of 0.2 mW mm−2 and expression density of 0.2 mS cm−2, whereas for pulsed stimulation, it is at minimum irradiance of 0.6 mW mm−2 and 5 ms pulse width, at 10 Hz. It is shown that Jaws and eNpHR3.0 are able to invoke single spike precise inhibition up to 160 and 200 Hz, respectively. The study is useful in designing new experiments, understanding temporal spike coding and bidirectional control, and curing neurological disorders.
Export citation and abstract BibTeX RIS
A correction to a formatting error was made on 20 July 2020.
1. Introduction
Optogenetics is a groundbreaking innovation in neuroscience that provides unprecedented spatio-temporal precision to control genetically modified cells with light [1–3]. In the last decade, the field has progressed not only with the development of improved microbial-opsin variants, targeting strategies, and light-targeting devices, but also by integration of complementary technologies [4–7]. It provides opportunities for a wide-range of bio-medical applications [8–10]. Microbial rhodopsin pumps and channels have been widely used in optogenetics [11]. They have been expressed transgenically in neurons to mediate light-dependent transport of ions across the membrane and excite or inhibit neural activity by causing depolarization or hyperpolarization of the neurons, respectively [12].
Major challenges are to enable low-power ultrafast operation at high frequencies and noninvasive large volume excitation or inhibition of neuronal population [2, 13, 14]. Recently, ultrafast excitatory opsins such as Chronos and very fast-Chrimson have been discovered, which enable excitation of interneurons beyond their intrinsic frequency limit [15, 16]. It is also important to develop fast inhibitory tools to achieve ultrafast bidirectional control on neuronal spiking, by co-expressing excitatory and inhibitory opsins.
Light-driven ion-fluxes permit rapid and effective silencing of neural activity [17]. The first demonstration of optogenetic inhibition was carried out using Halorhodopsin, an archael yellow light-driven inwardly-directed chloride pump, derived from Natronomonas pharaonis (NpHR) having photocurrent turn-off time τoff = 6.9 ± 2.2 [18]. The excitation maxima of NpHR at ∼580 nm, red-shifted from well-established excitatory channelrhodopsin (ChR2), with maxima at ∼460 nm, has enabled dual color bidirectional control [18]. Further experiments have been carried out using genomic screening, rationally designed mutagenesis, and molecular trafficking strategies, to successfully identify and validate novel classes of opsins [6, 19]. Many inhibitory opsins with improved kinetics, photosensitivity, stability, ion-selectivity and absorption spectrum have been discovered and engineered that include, eNpHR2.0, eNpHR3.0, Arch and Mac [17, 19]. eNpHR3.0, modified for enhanced membrane targeting in mammalian neurons, with altered kinetics, having τoff ∼ 4.2 ms, generates higher photocurrent than NpHR, and is the fastest chloride pump used in optogenetics [19]. The new red-shifted cruxhalorhodopsin, Jaws, extracted from Haloarcula (Halobacterium) salinarum (strain Shark) has been engineered to result in a photocurrent that is three times larger that of earlier silencers, with τoff ∼ 6 ms [20, 21]. Optogenetic inhibition with the chloride and proton pumps has been shown to operate well in freely moving worms, mammalian brain slice, cultured neurons, behaving mammals and, for restoration of visual function [17].
In recent years, the physiological importance of electrodiffusion and ion transportation across the neuronal membrane remains a critical issue in real life scenario [22, 23]. Chloride regulation in neurons is important for normal brain functions, as the major forms of synaptic inhibition, that includes GABAA, GABAC and glycine receptors, are chloride-conducting channels. Hence, the synaptic effects of both GABA and glycine can be significantly altered by a change in intraneuronal chloride levels [24–26]. During optogenetic inhibition or hyperpolarization, activation of halorhodopsin expressing neurons results in accumulation of intracellular chloride concentration, which has sustained effects on inhibitory synaptic transmission and neuronal excitability [22, 27]. Since, NpHR, eNpHR3.0 and Jaws, are all chloride pumps, the change in ![$\left[C{l}_{out}^{-}\right]$](https://content.cld.iop.org/journals/2057-1976/6/4/045011/revision2/bpexab90a1ieqn1.gif) during light-mediated photocurrent across the membrane results in the change in amplitude and/or polarity of naturally occurring chloride channels, such as GABAAR. The GABAAR currents that are outward before halorhodopsin activation often become strong inward currents after opsin activation, consistent with the light-driven accumulation of intracellular chloride [22].
during light-mediated photocurrent across the membrane results in the change in amplitude and/or polarity of naturally occurring chloride channels, such as GABAAR. The GABAAR currents that are outward before halorhodopsin activation often become strong inward currents after opsin activation, consistent with the light-driven accumulation of intracellular chloride [22].
In order to design well-controlled optogenetic devices and circuits, it is necessary to theoretically understand the biophysical mechanism of photocurrent generation and subsequent neuronal spiking excitation or inhibition [28–31]. Although, a rudimentry model of optogenetic inhibition of NpHR has been reported, a detailed analysis of photoresponse and the effect of change in chloride concentraton is necessary [32].
The objective of this paper is to, (i) formulate an integrated neuron circuit model to simulate light-mediated hyperpolarization and spike inhibition in NpHR/eNpHR3.0/Jaws-expressing neurons, that includes the effect of rebound of chloride-ions, (ii) study the effect of various parameters including irradiance, pulse width, pulse frequency, expression density and outer chloride concentration, (iii) compare optogenetic control in these opsin expressed neurons, and (iv) derive optimized conditions for low-power, high-frequency and temporally-precise spiking inhibition.
2. Theoretical model
Theoretical analysis has been carried out by formulating models for the photoresponse of halorhodopsins, namely NpHR, eNpHR3.0 and Jaws, and integrating them in hippocampal spiking neuron circuit model.
2.1. Photocurrent model of halorhodopsins
Photoisomerization of all-trans-retinal to the 13-cis isomer in halorhopsins initiates a series of several intermediates [33–36]. The transitions between these intermediates are accompanied by the transport of chloride-ions across the membrane, that allows light to inhibit neuronal activity.
The photocycle of NpHR and kinetics of ion transfer have been extensively studied [33, 37, 38]. It is reported that the photocycle of NpHR consists of six kinetic states as P1 → P6, which are characterized by archetypical spectral states K, L1, L2, O, N and the precursor of the ground state NpHR', besides the ground state (P0). P4 and P5 states are responsible for release and uptake of chloride ions, respectively [33]. The transition P6 → P0 is called the rate-determining transition of the NpHR photocycle [33]. Since, eNpHR3.0 and Jaws are also chloride pumps with altered kinetics and photocurrent amplitude, we model their photoresponse similar to NpHR. For simplicity, we consider a three-state model of the photocycle that involves the ground state P0, the active state P4 responsible for chloride release, and a rate-limiting state P6. We consider the photocurrent in all three opsins to be expressed as,

where, j ≡ NpHR/eNpHR3.0/Jaws,  accounts for both single molecule conductance and expression density,
  is the membrane voltage and
  is the reversal potential of the pump, which is −400 mV for all three variants [38, 39]. In general, the conductance
  depends on various factors given as,
 where
where  is the time,
  is wavelength,
  is the photon flux per unit area,
  is temperature and, Ψ is local ion concentration across the membrane [33, 39]. Consider
  to depend on three factors, with the conductance defined as
 ![${g}_{j}={g}_{0j}\left(\lambda \right)f\left(\phi ,t\right){\rm{\Psi }}\left(\left[C{l}_{out}^{-}\right]\right),$](https://content.cld.iop.org/journals/2057-1976/6/4/045011/revision2/bpexab90a1ieqn12.gif) where, (i)
where, (i)  (λ) is maximum conductance, (ii)
  is a normalized light-dependent function and, (iii)
 ![${\rm{\Psi }}\left(\left[C{l}_{out}^{-}\right]\right)$](https://content.cld.iop.org/journals/2057-1976/6/4/045011/revision2/bpexab90a1ieqn15.gif) is a normalized function to account for the dependence on outer membrane chloride concentration.
is a normalized function to account for the dependence on outer membrane chloride concentration.
Considering P0, P4, and P6 to denote the fraction of opsin molecules in each of the three states at any instant of time. The kinetics can be described by the following rate equations,


where, 

 and
and  are the rate constants for
 and
and  transitions respectively, determined from the experimental data and defined as
 and
and  [39]. Since the three-state model assumes only one active-state
 The photon flux per unit area
  where
where  is irradiance,
  is Planck's constant and
  is the speed of light in vacuum. Other model parameters
  have been determined empirically (table 1) [18–22, 33]. The dependence of photocurrent on
 ![$\left[C{l}_{out}^{-}\right]$](https://content.cld.iop.org/journals/2057-1976/6/4/045011/revision2/bpexab90a1ieqn33.gif) has been determined by fitting the experimental data using Michaelis-Menten type saturation such that
has been determined by fitting the experimental data using Michaelis-Menten type saturation such that ![$\left(\left[C{l}_{out}^{-}\right]\right)=\left({\vartheta }_{\max }\,\left[C{l}_{out}^{-}\right]\right)/\left.\left({k}_{d}+\left[C{l}_{out}^{-}\right]\right)\right)/{{\rm{\Psi }}}_{0},$](https://content.cld.iop.org/journals/2057-1976/6/4/045011/revision2/bpexab90a1ieqn34.gif) with
with  = 5 mM sec−1 and
  = 16 mM [18, 22]. Here,
  = 4.4286, is the value of function
  calculated at
 ![$\left[C{l}_{out}^{-}\right]$](https://content.cld.iop.org/journals/2057-1976/6/4/045011/revision2/bpexab90a1ieqn39.gif) = 124 mM.
= 124 mM.
Table 1. Opsin model parameters [18–22, 33].
| Parameter | NpHR | eNpHR3.0 | Jaws |
|---|---|---|---|

|
0.1099 | 0.25 | 0.167 |

|
0.05 | 0.05 | 0.05 |

|
0.005 | 1 | 1 |

|
0.5 | 0.7 | 0.8 |

|
0.2 | 0.1 | 1 |

|
1.5e+18 | 1.2e+18 | 0.95e+18 |

|
−400 | −400 | −400 |

|
593 | 593 | 593 |

|
17.7 | 7.6 | 12.6 |

|
0.02e-2 | 0.02e-2 | 0.02e-2 |

|
5 | 12 | 6.5 |
The rebound of chloride concentration to its resting value, through naturally occurring ionotropic GABA receptors, has been considered as a leak chloride current  , due to change in resting potential of these channels,

where, is the channel conductance fitted to match with experimental results (2.3 mS cm−2) [18–21].
  denotes the resting potential of chloride leak channel and is −70 mV.
  is the reversal potential of the channel, which depends on concurrent values of inner and outer chloride concentrations, and calculated using Goldman-Hodgkin-Katz equation [22],

where,  is the universal gas constant,
  is temperature,
  is Faraday constant, such that
  = 26.67 mV.
 ![$\left[C{l}_{out}^{-}\right]$](https://content.cld.iop.org/journals/2057-1976/6/4/045011/revision2/bpexab90a1ieqn59.gif) and
and ![$\left[C{l}_{in}^{-}\right]$](https://content.cld.iop.org/journals/2057-1976/6/4/045011/revision2/bpexab90a1ieqn60.gif) denote the outer and inner chloride concentrations across the membrane at any instant of time. The total change in chloride concentration inside the membrane due to halorhodopsin mediated inward pumping and chloride channel mediated outward leakage is calculated by using the differential equation,
denote the outer and inner chloride concentrations across the membrane at any instant of time. The total change in chloride concentration inside the membrane due to halorhodopsin mediated inward pumping and chloride channel mediated outward leakage is calculated by using the differential equation,

where,  and
and  are the rate constants, fitted to match with experimental results, shown in table 1 [18–21]. The total chloride current across the membrane is a combination of both currents and expressed as,

2.2. Model for optogenetic inhibition of halorhodopsin-expressing neurons
To analyze the response of halorhodopsin-expressing hippocampal neurons to light stimuli, we incorporate the kinetic model of the photocycle of NpHR/eNpHR3.0/Jaws, with the well-established single compartment CA3 hippocampal spiking neuron model, i.e. Hemond neuron model [40, 41]. The neuron model incorporating the light-driven ion pump current ( ) can be expressed as a system of equations expressed as,

where,  is the membrane capacitance, and
  is the external constant DC bias current that controls the excitability of the neuron, and
  is the sum of the membrane ion-channel currents (


 and
and  ) [40–42].
Each ion-channel current in  has been modelled as
  where
where  is maximal conductance,
  is activation variable (with exponent
  ),
),  is inactivation variable (with exponent
  ), and
  is the reversal potential. The kinetic equation for each of the gating functions
  (
( or
or  ) obeys the first-order kinetics as
  The voltage-dependent functions and values of parameters are given in tables 2 and 3, respectively [40, 41]. A time-step of 0.01 ms has been used for all simulations in MATLAB R2015a.


![$\displaystyle \frac{-0.4\left(V+6\right)}{\exp \left[-\tfrac{V+6}{7.2}\right]-1}$](https://content.cld.iop.org/journals/2057-1976/6/4/045011/revision2/bpexab90a1ieqn92.gif)
![$\displaystyle \frac{0.124\left(V+6\right)}{\exp \left[\tfrac{V+6}{7.2}\right]-1}$](https://content.cld.iop.org/journals/2057-1976/6/4/045011/revision2/bpexab90a1ieqn93.gif)


![$\displaystyle \frac{-0.03\left(V+21\right)}{\exp \left[-\displaystyle \frac{\left(V+21\right)}{1.5}\right]-1}$](https://content.cld.iop.org/journals/2057-1976/6/4/045011/revision2/bpexab90a1ieqn97.gif)
![$\displaystyle \frac{0.01\left(V+21\right)}{\exp \left[\tfrac{V+21}{1.5}\right]-1}$](https://content.cld.iop.org/journals/2057-1976/6/4/045011/revision2/bpexab90a1ieqn98.gif)
![$\displaystyle \frac{1}{\exp \left[\tfrac{V+26}{4}\right]+1}$](https://content.cld.iop.org/journals/2057-1976/6/4/045011/revision2/bpexab90a1ieqn99.gif)


![$\exp \left[-0.113\left(V-37\right)\right]$](https://content.cld.iop.org/journals/2057-1976/6/4/045011/revision2/bpexab90a1ieqn103.gif)
![$\exp \left[-0.0791\left(V-37\right)\right]$](https://content.cld.iop.org/journals/2057-1976/6/4/045011/revision2/bpexab90a1ieqn104.gif)


![$\exp \left[0.0833\left(V+75\right)\right]$](https://content.cld.iop.org/journals/2057-1976/6/4/045011/revision2/bpexab90a1ieqn109.gif)
![$\exp \left[0.0333\left(V+75\right)\right]$](https://content.cld.iop.org/journals/2057-1976/6/4/045011/revision2/bpexab90a1ieqn110.gif)
![$\displaystyle \frac{1}{\exp \left[\tfrac{V+73}{8}\right]+1}$](https://content.cld.iop.org/journals/2057-1976/6/4/045011/revision2/bpexab90a1ieqn111.gif)


![$\displaystyle \frac{15.69* \left(-V+81.5\right)}{\exp \left[\tfrac{-V+81.5}{10}\right]-1}$](https://content.cld.iop.org/journals/2057-1976/6/4/045011/revision2/bpexab90a1ieqn115.gif)
![$0.29* \exp \left[-\displaystyle \frac{V}{10.86}\right]$](https://content.cld.iop.org/journals/2057-1976/6/4/045011/revision2/bpexab90a1ieqn116.gif)

![$\displaystyle \frac{2* \exp \left[0.00756\left(V-4\right)\right]}{1+\exp \left[0.0756\left(V-4\right)\right]}$](https://content.cld.iop.org/journals/2057-1976/6/4/045011/revision2/bpexab90a1ieqn118.gif)


![$\exp \left[0.113\left(V+33\right)\right]$](https://content.cld.iop.org/journals/2057-1976/6/4/045011/revision2/bpexab90a1ieqn121.gif)
![$\exp \left[0.0791\left(V+33\right)\right]$](https://content.cld.iop.org/journals/2057-1976/6/4/045011/revision2/bpexab90a1ieqn122.gif)


3. Results
3.1. Photocurrent in NpHR, eNpHR3.0 and Jaws expressing neurons
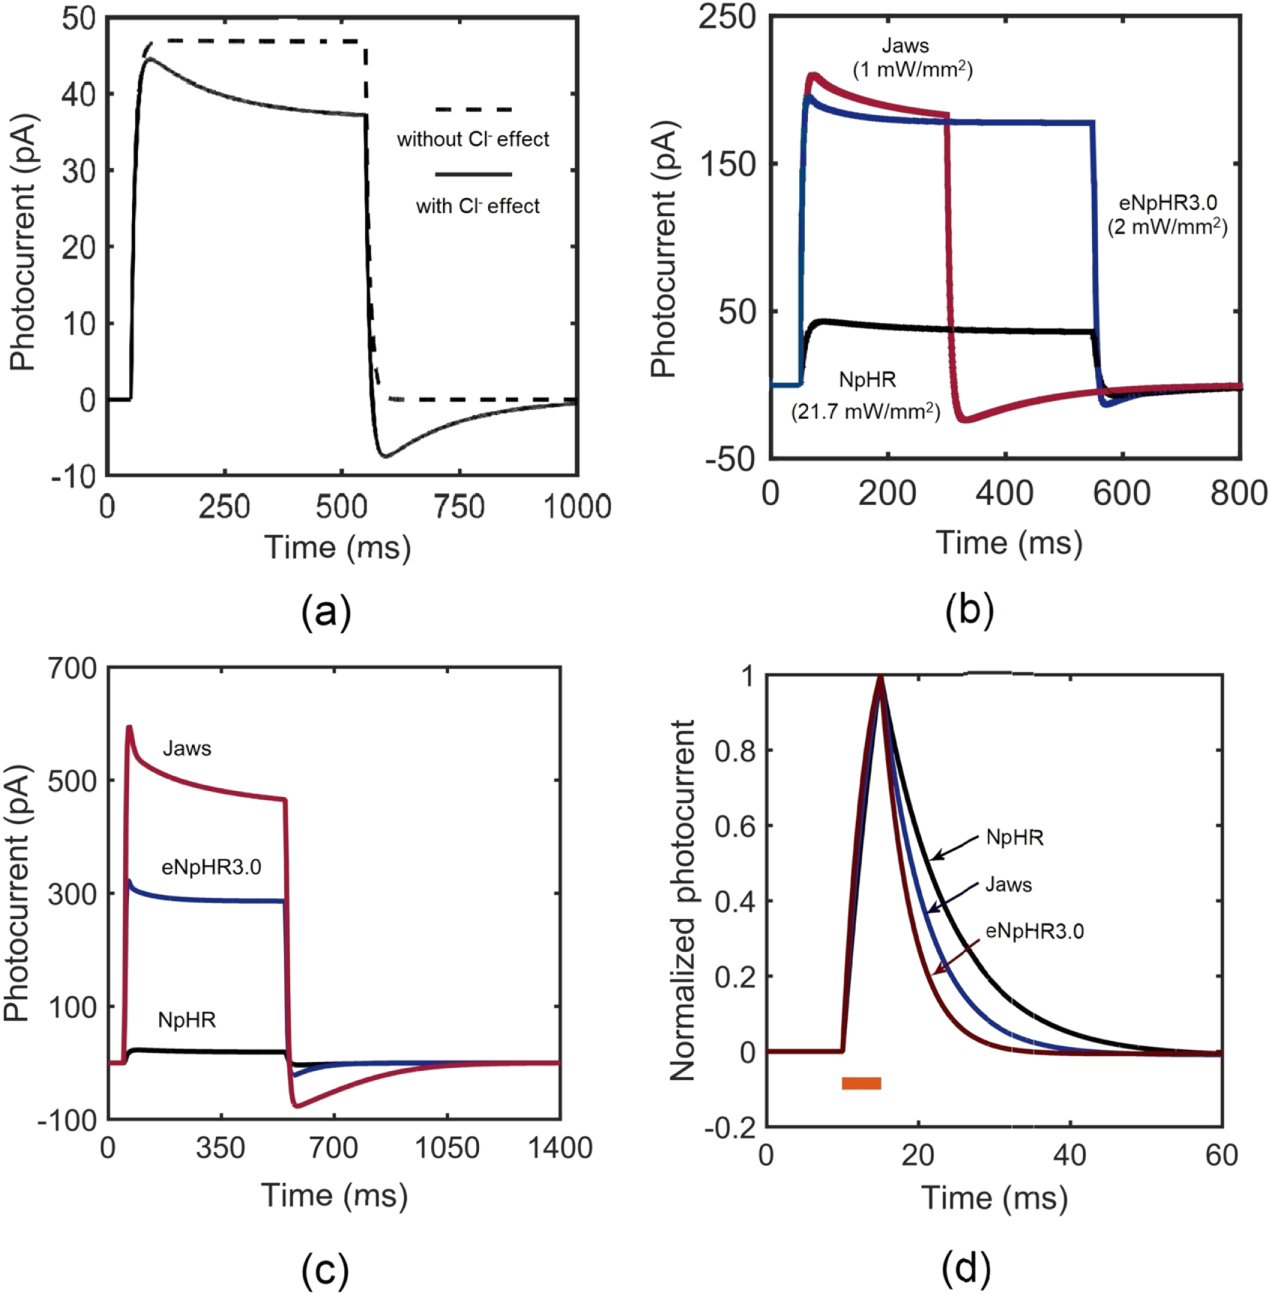
The photoresponse of NpHR, eNpHR3.0 and Jaws, expressed in neurons, has been studied through numerical simulations using equations (1)–(8), taking into account the effect of change in ![$\left[C{l}_{out}^{-}\right]$](https://content.cld.iop.org/journals/2057-1976/6/4/045011/revision2/bpexab90a1ieqn138.gif) , considering the reported experimental parameters shown in table 1. On illumination with 593 nm wavelength light, the photocurrent of NpHR, eNpHR3.0 and Jaws has been shown in figure 1. To study the effect of change in chloride concentration on the photocurrent, the variation of photocurrent with time in NpHR, has been shown in figure 1(a). The simulated photocurrent exactly matches with the reported experimental results, while considering the effect of change in chloride concentration [18]. Light-induced transportation of chloride ions from outside to inside of the membrane results in a decrease in
, considering the reported experimental parameters shown in table 1. On illumination with 593 nm wavelength light, the photocurrent of NpHR, eNpHR3.0 and Jaws has been shown in figure 1. To study the effect of change in chloride concentration on the photocurrent, the variation of photocurrent with time in NpHR, has been shown in figure 1(a). The simulated photocurrent exactly matches with the reported experimental results, while considering the effect of change in chloride concentration [18]. Light-induced transportation of chloride ions from outside to inside of the membrane results in a decrease in ![$\left[C{l}_{out}^{-}\right]$](https://content.cld.iop.org/journals/2057-1976/6/4/045011/revision2/bpexab90a1ieqn139.gif) , which results in lower plateau photocurrent. Also, due to long-light stimulation, larger changes in
, which results in lower plateau photocurrent. Also, due to long-light stimulation, larger changes in ![$\left[C{l}_{out}^{-}\right]$](https://content.cld.iop.org/journals/2057-1976/6/4/045011/revision2/bpexab90a1ieqn140.gif) gradient results in rebound of chloride ions from inside to outside of the membrane. This rebound chloride current becomes prominent after light turn-off, as the pumping from outside to inside gets turned-off as shown in figure 1(a).
gradient results in rebound of chloride ions from inside to outside of the membrane. This rebound chloride current becomes prominent after light turn-off, as the pumping from outside to inside gets turned-off as shown in figure 1(a).
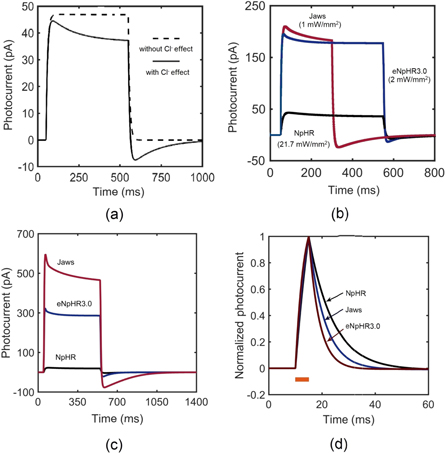
Figure 1. Optostimulation of photocurrent in NpHR, eNpHR3.0 and Jaws at 593 nm wavelength. Variation of photocurrent with time, (a) in NpHR at 500 ms pulse width and I = 21.7 mW mm−2, (b) at indicated irradiances and 250 ms pulse width for Jaws, and 500 ms pulse width for NpHR and eNpHR3.0, and (c) at 500 ms pulse width and I = 5 mW mm−2. (d) Variation of normalized photocurrent with time at 5 ms pulse width and I = 5 mW mm−2.
Download figure:
Standard image High-resolution imageTo compare theoretical simulations with reported experimental results, the variation of photocurrent with time at corresponding irradiances and pulse widths, considering the effect of change in ![$\left[C{l}_{out}^{-}\right],$](https://content.cld.iop.org/journals/2057-1976/6/4/045011/revision2/bpexab90a1ieqn141.gif) has been shown in figure 1(b). Again, the simulated results are in good agreement with the reported experimental results [6, 18, 21]. The simulated peak and plateau photocurrents of 43 pA, 210 pA and 37 pA, 183 pA match with the reported experimental values for NpHR and Jaws, respectively [18, 21]. The simulated peak photocurrent of 195 pA for eNpHR3.0 also matches with the reported experimental value [6]. For comparison, the variation of photocurrent with time in NpHR, eNpHR3.0 and Jaws, at 5 mW mm−2 and 500 ms pulse width has been shown in figure 1(c). Jaws shows largest photocurrent among all three variants. Larger photocurrent causes higher change in chloride concentration gradient across the membrane, which results in a larger reverse current after light turn-off. Consequently, this reverse current is also highest for Jaws (figure 1(c)). To compare the turn-off kinetics of photocurrent of these opsins, variation of normalized photocurrent with time, at 5 ms pulse width and 5 mW mm−2 irradiance, is shown in figure 1(d). Among all three halorhodopsin variants, eNpHR3.0 shows fastest turn-off kinetics.
has been shown in figure 1(b). Again, the simulated results are in good agreement with the reported experimental results [6, 18, 21]. The simulated peak and plateau photocurrents of 43 pA, 210 pA and 37 pA, 183 pA match with the reported experimental values for NpHR and Jaws, respectively [18, 21]. The simulated peak photocurrent of 195 pA for eNpHR3.0 also matches with the reported experimental value [6]. For comparison, the variation of photocurrent with time in NpHR, eNpHR3.0 and Jaws, at 5 mW mm−2 and 500 ms pulse width has been shown in figure 1(c). Jaws shows largest photocurrent among all three variants. Larger photocurrent causes higher change in chloride concentration gradient across the membrane, which results in a larger reverse current after light turn-off. Consequently, this reverse current is also highest for Jaws (figure 1(c)). To compare the turn-off kinetics of photocurrent of these opsins, variation of normalized photocurrent with time, at 5 ms pulse width and 5 mW mm−2 irradiance, is shown in figure 1(d). Among all three halorhodopsin variants, eNpHR3.0 shows fastest turn-off kinetics.
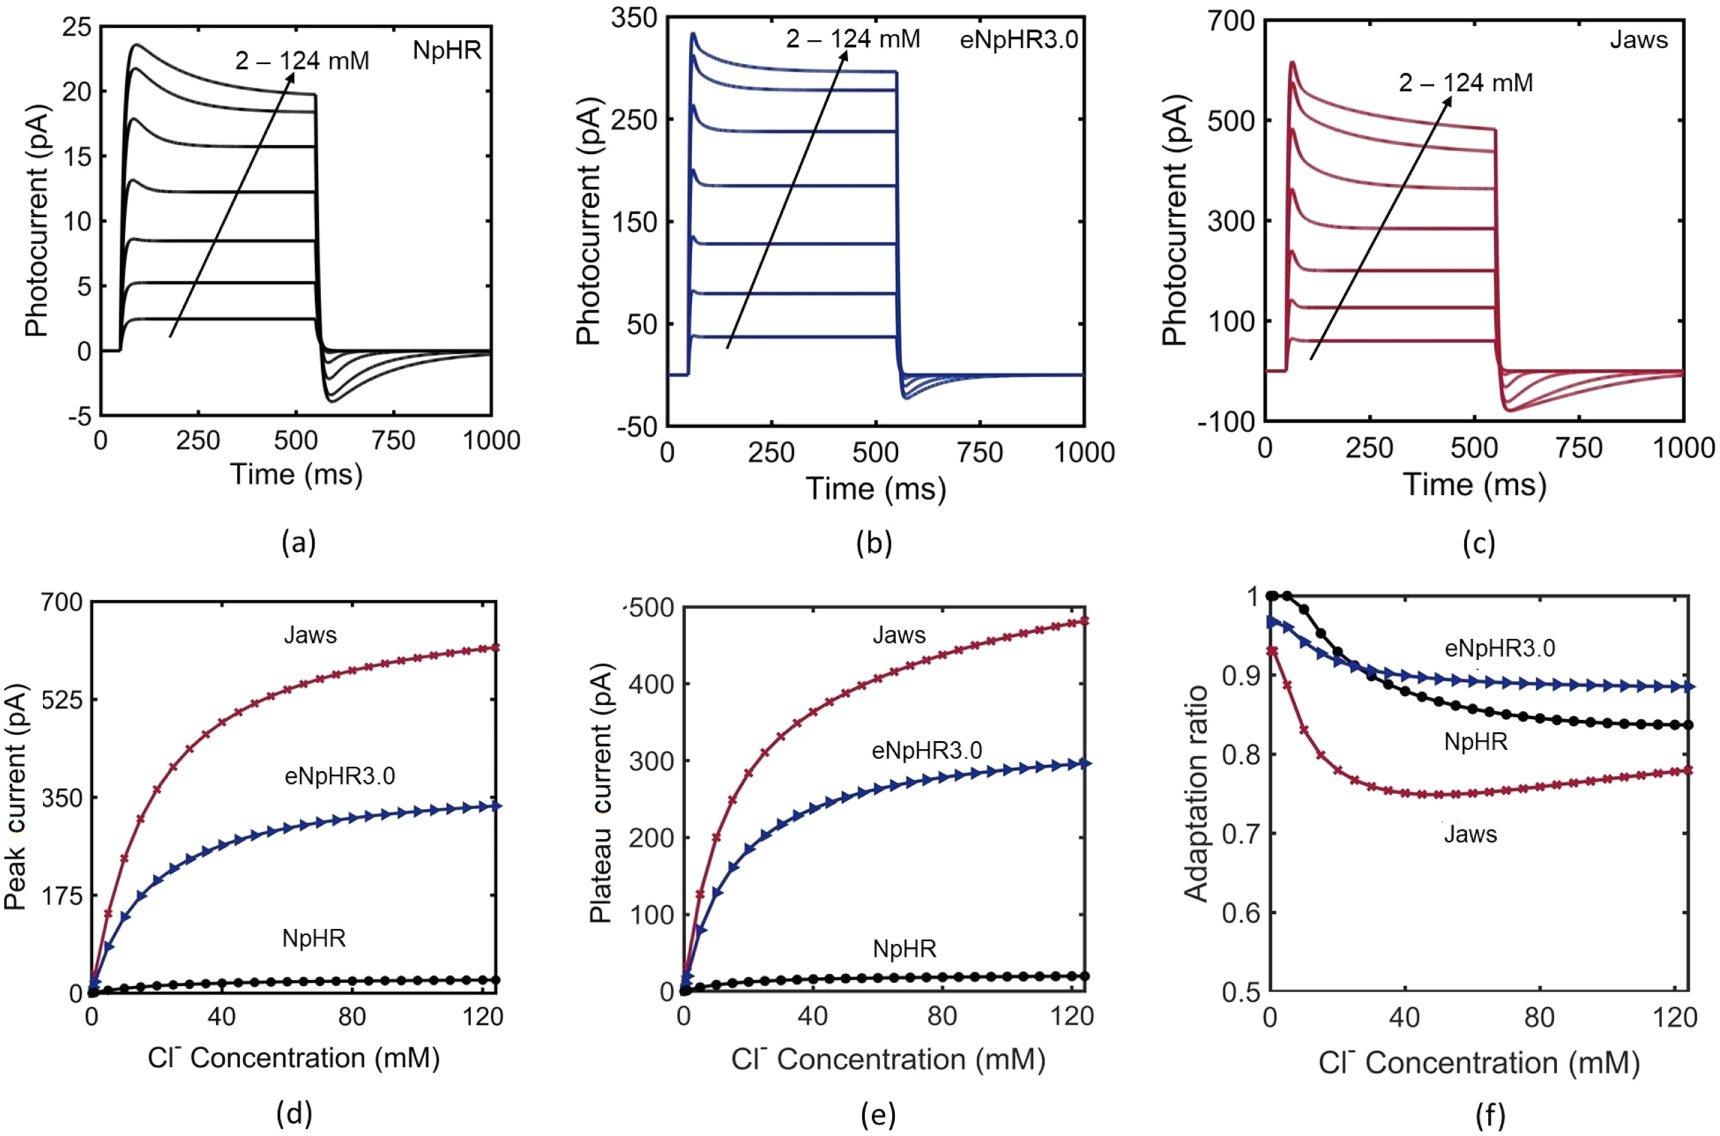
As NpHR, eNpHR3.0 and Jaws, are light-driven chloride pumps, their capacity to generate photocurrent depends on the outer membrane chloride concentration [18]. Hence, it is necessary to study the effect of change in outer chloride concentration on the photocurrent. The variation of photocurrent with time, at different ![$\left[C{l}_{out}^{-}\right],$](https://content.cld.iop.org/journals/2057-1976/6/4/045011/revision2/bpexab90a1ieqn142.gif) is shown in figures 2(a)–(c). Higher chloride concentration gradient across the membrane helps these ionic-pumps in pumping chloride inside the membrane, even in the presence of opposing membrane potential. As is evident, the photocurrent in all three variants is more sensitive to lower values of
is shown in figures 2(a)–(c). Higher chloride concentration gradient across the membrane helps these ionic-pumps in pumping chloride inside the membrane, even in the presence of opposing membrane potential. As is evident, the photocurrent in all three variants is more sensitive to lower values of ![$\left[C{l}_{out}^{-}\right]$](https://content.cld.iop.org/journals/2057-1976/6/4/045011/revision2/bpexab90a1ieqn143.gif) rather than higher values. The variation of peak and plateau photocurrent, and corresponding adaptation ratio with
rather than higher values. The variation of peak and plateau photocurrent, and corresponding adaptation ratio with ![$\left[C{l}_{out}^{-}\right]$](https://content.cld.iop.org/journals/2057-1976/6/4/045011/revision2/bpexab90a1ieqn144.gif) is shown in figures 2(d)–(f). The variation of peak photocurrent of NpHR with
is shown in figures 2(d)–(f). The variation of peak photocurrent of NpHR with ![$\left[C{l}_{out}^{-}\right]$](https://content.cld.iop.org/journals/2057-1976/6/4/045011/revision2/bpexab90a1ieqn145.gif) exactly matches with the reported experimental result (figure 2(d)) [18]. Adaptation ratio of all three variants decreases on increase in
exactly matches with the reported experimental result (figure 2(d)) [18]. Adaptation ratio of all three variants decreases on increase in ![$\left[C{l}_{out}^{-}\right],$](https://content.cld.iop.org/journals/2057-1976/6/4/045011/revision2/bpexab90a1ieqn146.gif) but in the case of Jaws, the adaptation ratio has a minimum value of 0.75 at
but in the case of Jaws, the adaptation ratio has a minimum value of 0.75 at ![$\left[C{l}_{out}^{-}\right]$](https://content.cld.iop.org/journals/2057-1976/6/4/045011/revision2/bpexab90a1ieqn147.gif) = 40 mM, beyond which it slightly increases with
= 40 mM, beyond which it slightly increases with ![$\left[C{l}_{out}^{-}\right]$](https://content.cld.iop.org/journals/2057-1976/6/4/045011/revision2/bpexab90a1ieqn148.gif) (figure 2(f)).
(figure 2(f)).
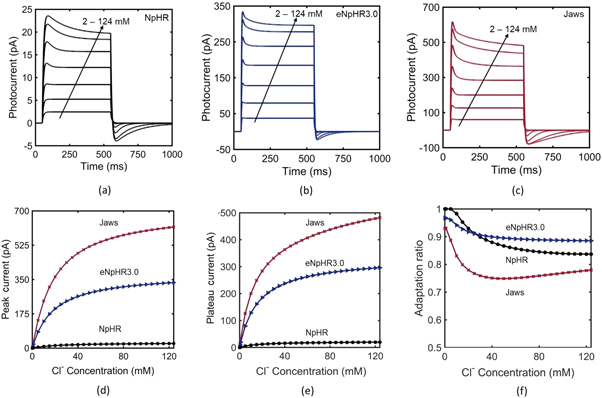
Figure 2. Effect of outer chloride concentration on the photocurrent in NpHR, eNpHR3.0 and Jaws. (a)–(c) Variation of photocurrent with time at ![$\left[C{l}_{out}^{-}\right]$](https://content.cld.iop.org/journals/2057-1976/6/4/045011/revision2/bpexab90a1ieqn149.gif) = 2, 5, 10, 20, 40, 80 and 124 mM, at 500 ms pulse width and I = 5 mW mm−2. (d)–(f) Corresponding variation of peak and plateau photocurrent, and adaptation ratio with
= 2, 5, 10, 20, 40, 80 and 124 mM, at 500 ms pulse width and I = 5 mW mm−2. (d)–(f) Corresponding variation of peak and plateau photocurrent, and adaptation ratio with ![$\left[C{l}_{out}^{-}\right].$](https://content.cld.iop.org/journals/2057-1976/6/4/045011/revision2/bpexab90a1ieqn150.gif)
Download figure:
Standard image High-resolution imageThe effect of irradiance on photocurrent characteristic measures and time constants, at different pulse widths, is shown in figure 3. The variation of peak photocurrent and adaptation ratio with irradiance, at 500 ms pulse stimulation, is shown in figures 3(a) and (b), respectively. The peak photocurrent (Ipeak) increases with an increase in irradiance for all three variants, as more molecules populate the active state-P4. In all three variants, under long light stimulation, the photocurrent in the opsin reaches the peak, which decays to a steady-state plateau. It is evident that the higher peak photocurrent results in lower plateau photocurrent, which is not only due to molecular transition to P6 state, but also due to larger changes in outer chloride concentration gradient. Jaws shows minimum adaptation ratio among all three variants (figure 3(b)).
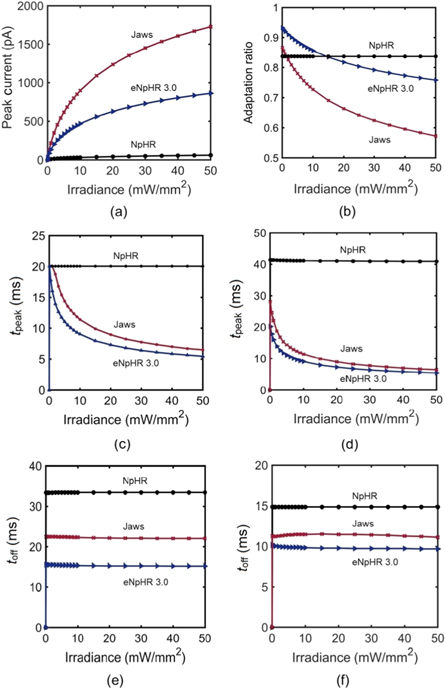
Figure 3. Effect of irradiance on photocurrent characteristic measures and time constants at 593 nm wavelength. Variation of (a) peak photocurrent and (b) adaptation ratio with irradiance at 500 ms pulse width. Variation of tpeak with irradiance at (c) 20 ms and (d) 500 ms pulse width. Variation of toff with irradiance at (e) 20 ms and (f) 500 ms pulse widths.
Download figure:
Standard image High-resolution imageThe variation of tpeak, time to peak, and toff, time taken by the photocurrent from the point where light is turned off, to the time it reaches 0.01 % of its magnitude, with irradiance, at 20 and 500 ms pulse widths, is shown in figures 3(c)–(f). For NpHR, tpeak does not vary with irradiance and is higher for longer pulse excitation. For Jaws and eNpHR3.0, it decreases monotonically on increase in irradiance and saturates to lower values at higher irradiances (figures 3(c) and (d)). The difference between the initial tpeak values of NpHR, Jaws and eNpHR3.0 is also large at 500 ms pulse excitation. toff does not vary with irradiance, for all three variants, but has lower values for longer pulse widths (figures 3(e) and (f)).
The effect of pulse width on photocurrent of NpHR, eNpHR3.0 and Jaws has been shown in figure 4. Variation of Ipeak, Iplateau and ICl-leak with pulse width is shown in figures 4(a)–(c). Ipeak of all three variants increases on increase in pulse width and saturates at higher values, which is 43, 10 and 15 ms for NpHR, eNpHR3.0 and Jaws respectively, at 5 mW mm−2 (figure 4(a)). For all three variants, Iplateau slightly decreases on increase in pulse width and saturates for longer pulse widths, which is 800 ms for NpHR, 400 ms for eNpHR3.0 and 1200 ms for Jaws, at 5 mW mm−2 (figure 4(b)). The peak value of the leak chloride current (ICl-leak) increases with increase in pulse width and saturates at 3, 23 and 95 pA at a pulse width of 500 ms for NpHR and eNpHR3.0, and 1500 ms for Jaws, respectively (figure 4(c)). The saturation of Iplateau and ICl-leak indicates that after a long pulse excitation, the chloride transportation in opsin-expressing system gets stabilized.
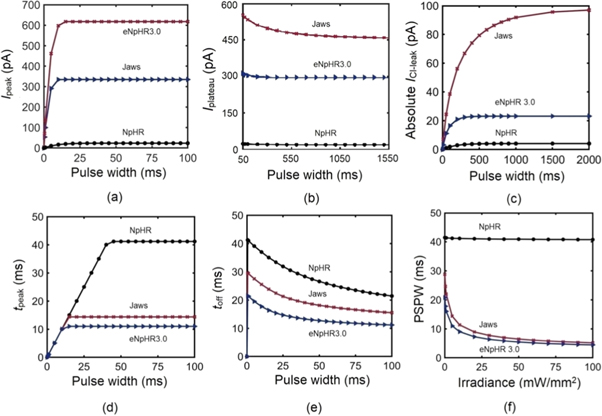
Figure 4. Effect of pulse width on photocurrent of NpHR, eNpHR3.0 and Jaws. Variation of (a) Ipeak, (b) Iplateau and (c) ICl-leak with pulse width, at 5 mW mm−2. Variation of (d) tpeak and (e) toff, with pulse width at I = 5 mW mm−2. (f) Variation of PSPW with irradiance.
Download figure:
Standard image High-resolution imageThe variation of tpeak and toff with pulse width, at 5 mW mm−2 is shown in figures 4(d) and (e). tpeak increases with increase in pulse width and saturates after a certain pulse width, which is 43 ms for NpHR, 15 ms for Jaws and 10 ms for eNpHR3.0, at 5 mW mm−2 (figure 4(d)). toff decreases on increase in pulse width and is shortest for eNpHR3.0 among all three variants (figure 4(e)). Variation of minimum pulse width required to achieve peak photocurrent at particular irradiance, termed photocurrent saturation pulse width (PSPW), with irradiance is shown in figure 4(f). PSPW remains nearly constant for NpHR (∼41 ms), whereas it decreases exponentially with increase in irradiance for Jaws and eNpHR3.0, respectively (figure 4(f)). PSPW has lower values for Jaws and eNpHR3.0, which is desirable to empirically obtain good values of light power with maximum output and useful for avoiding unwanted heating effects for high frequency photostimulations.
Comparison of photocurrent under multiple pulse illumination, at varying irradiances and pulse widths, is shown in figure 5. The peak photocurrents remain same for subsequent photostimulations and increase with increase in irradiance or pulse width for all three variants (figure 5). At 10 Hz, the modulation ratio, Ipeak10/Ipeak1, remains ∼1, and does not vary with irradiance and pulse width, which indicates the utility of these opsins in targeting long sequence of spike trains.

Figure 5. Effect of multiple light pulses on photocurrent at indicated irradiances and pulse widths, and photostimulation protocols of 10 stimuli at 10 Hz.
Download figure:
Standard image High-resolution imageComparison of the effect of light pulse stimulation frequency on the photocurrent has been shown in figure 6. Due to its fastest kinetics, among all three variants, eNpHR3.0 shows no photocurrent plateau up to a photostimulation frequency of 50 Hz, and lowest photocurrent plateau at higher frequencies (figure 6). The modulation in the peaks of photocurrent is higher at higher frequencies for NpHR, whereas it is nearly same for eNpHR3.0 and Jaws (figure 6). At higher frequencies, the first peak of photocurrent in NpHR is lower in comparison to subsequent photocurrent peaks, while it is higher for other variants. For Jaws, at lower irradiance of 1 mW mm−2, the first peak of photocurrent is smaller than subsequent peaks, due to longer tpeak at lower irradiances.
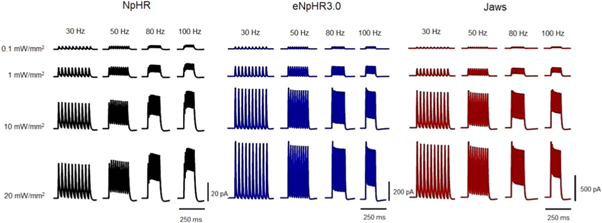
Figure 6. Effect of light pulse stimulation frequency on photocurrent at indicated irradiances and frequencies, and at photostimulation protocol of 10 stimuli each of 5 ms pulse width.
Download figure:
Standard image High-resolution image3.2. Optogenetic hyperpolarization and spiking inhibition
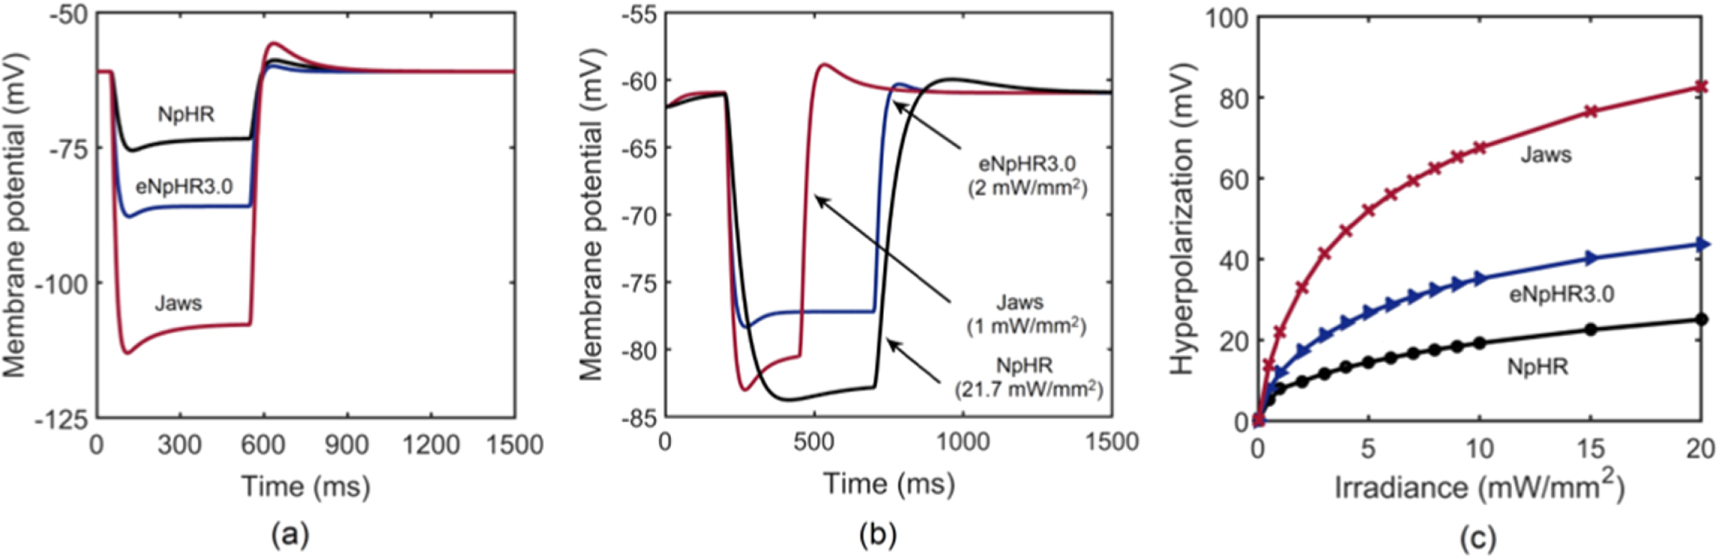
Light-induced hyperpolarization and silencing of neuronal spiking in NpHR/eNpHR3.0/Jaws-expressing hippocampal neurons has been simulated using equations (1)–(9) considering parameters shown in tables 1–3. Light-induced hyperpolarization and the effect of irradiance on membrane potential are shown in figure 7. At 500 ms pulse stimulation, λ = 593 nm, and I = 5 mW mm−2, the variation of membrane potential in NpHR, eNpHR3.0 and Jaws-expressing neurons with time is shown in figure 7(a). As is evident, the rebound of ![$\left[C{l}_{out}^{-}\right]$](https://content.cld.iop.org/journals/2057-1976/6/4/045011/revision2/bpexab90a1ieqn151.gif) to its resting value results in post-illumination depolarization, which is highest for Jaws, due to highest hyperpolarization among all three variants. To compare with the reported experimental results, the variation of membrane potential with time, at corresponding irradiances and pulse widths, is shown in figure 7(b). Simulated results are in good agreement with reported experimental results with peak voltage of −83 mV for NpHR and −86 mV for Jaws, respectively (figure 7(b)) [18, 21]. For NpHR-expressing neurons, the match is at Cm = 5 μF cm−2. Variation of hyperpolarization peak voltage with irradiance, at 500 ms pulse width, has been shown in figure 7(c).
to its resting value results in post-illumination depolarization, which is highest for Jaws, due to highest hyperpolarization among all three variants. To compare with the reported experimental results, the variation of membrane potential with time, at corresponding irradiances and pulse widths, is shown in figure 7(b). Simulated results are in good agreement with reported experimental results with peak voltage of −83 mV for NpHR and −86 mV for Jaws, respectively (figure 7(b)) [18, 21]. For NpHR-expressing neurons, the match is at Cm = 5 μF cm−2. Variation of hyperpolarization peak voltage with irradiance, at 500 ms pulse width, has been shown in figure 7(c).
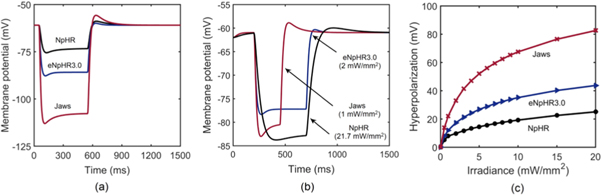
Figure 7. Light-induced hyperpolarization in NpHR, eNpHR3.0 and Jaws-expressing neurons. (a) Variation of membrane potential with time at I = 5 mW mm−2 and 500 ms pulse width at an expression density (g0) of 0.8, 0.07 and 0.1 mS cm−2 for NpHR, eNpHR3.0 and Jaws, respectively. (b) Corresponding variation of membrane potential at indicated irradiances and 250 ms pulse width for Jaws and 500 ms pulse width for NpHR and eNpHR3.0. (c) Variation of peak hyperpolarization with irradiance under 500 ms pulse stimulation.
Download figure:
Standard image High-resolution imageThe effect of varying irradiances and expression densities on spike inhibition capacity in NpHR, eNpHR3.0 and Jaws-expressing neurons, has been shown in figure 8. For the analysis, high frequency spike train has been evoked using a 2 s continuous step current. The effect of concurrent delivery of 1 s continuous 593 nm light at different percentage irradiances on spike inhibition has been shown in figures 8(a)–(c). Complete spike inhibition takes place at 21.7 mW mm−2, 1.2 mW mm−2, and 0.4 mW mm−2 for NpHR, eNpHR3.0 and Jaws, respectively. The simulated result of variation of percentage spike inhibition in NpHR-expressing neurons exactly matches with the reported experimental results (figure 8(a)) [18]. Corresponding inhibition in eNpHR3.0 and Jaws has been achieved at much lower irradiances, which highlights their utility over NpHR, as low-power silencing tools.
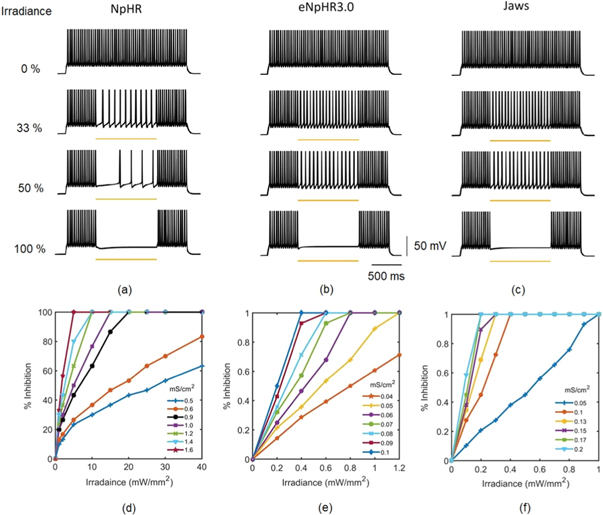
Figure 8. Effect of irradiance and expression density on spike inhibition, in NpHR, eNpHR3.0 and Jaws-expressing hippocampal neurons, under continuous light illumination. Spikes evoked using 2 s step current of IDC = 2 μ A cm−2. (a)–(c) Inhibition caused by concurrent delivery of light pulse of 1 s, at indicated percentage of irradiances, and expression densities (g0) of 0.9 mS cm−2 for NpHR, 0.05 mS cm−2 for eNpHR3.0, and 0.1 mS cm−2 for Jaws. Maximum irradiance used is I = 21.7 mW mm−2 for NpHR, 1.2 mW mm−2 for eNpHR3.0, and 0.4 mW mm−2 for Jaws. (d)–(f) Corresponding variation of percentage spike inhibition with irradiance at different expression densities.
Download figure:
Standard image High-resolution imageIt is important to study how the expression density of these opsins alters the irradiance threshold for complete inhibition. Corresponding variation of percentage inhibition with irradiance at different expression densities has been shown in figures 8(d)–(f). In general, higher expression density results in lower irradiance thresholds. It is found that a minimum irradiance of 5 mW mm−2 with expression density of 1.7 mS cm−2 for NpHR, 0.4 mW mm−2 with expression density of 0.1 mS cm−2 for eNpHR3.0, and 0.2 mW mm−2 with expression density of 0.2 mS cm−2 for Jaws, is sufficient to achieve 100% spiking suppression.
The effect of outer chloride concentration on the capacity of light-mediated spike inhibition in NpHR, eNpHR3.0 and Jaws-expressing neurons has been shown in figure 9. Lower values of ![$\left[C{l}_{out}^{-}\right]$](https://content.cld.iop.org/journals/2057-1976/6/4/045011/revision2/bpexab90a1ieqn152.gif) results in lower photocurrents and, hence leads to failure in spike inhibition. It is evident that there is no effect of photostimulation of these opsins, in the absence of outer chloride molecules (figure 9). Minimum irradiance has been used such that 100% spike inhibition takes place at
results in lower photocurrents and, hence leads to failure in spike inhibition. It is evident that there is no effect of photostimulation of these opsins, in the absence of outer chloride molecules (figure 9). Minimum irradiance has been used such that 100% spike inhibition takes place at ![$\left[C{l}_{out}^{-}\right]$](https://content.cld.iop.org/journals/2057-1976/6/4/045011/revision2/bpexab90a1ieqn153.gif) = 124 mM, for all three variants. However, it is possible to get 100% spike inhibition at lower
= 124 mM, for all three variants. However, it is possible to get 100% spike inhibition at lower ![$\left[C{l}_{out}^{-}\right]$](https://content.cld.iop.org/journals/2057-1976/6/4/045011/revision2/bpexab90a1ieqn154.gif) values, but it would require higher irradiances.
values, but it would require higher irradiances.
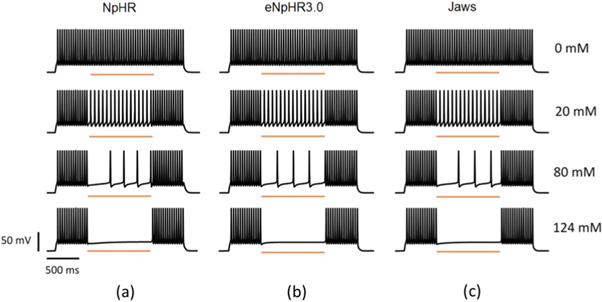
Figure 9. Effect of outer chloride concentration on light-mediated spike inhibition in NpHR, eNpHR3.0 and Jaws-expressing hippocampal neurons. Spikes evoked using 2 s step current of IDC = 2 μA cm−2 and inhibited using light pulse of 1 s, at I = 21.7, 1.2 and 0.4 mW mm−2 and expression density (g0) of 0.9, 0.05 and 0.1 mS cm−2 for NpHR, eNpHR3.0 and Jaws-expressing neurons, respectively, at indicated values of outer chloride concentration.
Download figure:
Standard image High-resolution imageTo test whether NpHR, eNpHR3.0 and Jaws activation can suppress target spike and also to avoid unwanted heating effects due to continuous illumination of light, it is important to analyze their capacity under pulsed illumination. The effect of pulse width and irradiance on spiking inhibition has been shown in figure 10. Spikes have been evoked by applying pulsed step currents at 10 Hz. Inhibition has been achieved using light pulses of indicated pulse widths and irradiances at same frequency (figure 10), where Δt is the time delay between dc current and the light stimulus. As is evident from figure 10, a minimum irradiance of 0.6 mW mm−2 and pulse width of 5 ms can achieve 100% spike inhibition in Jaws-expressing neurons. The analysis also reveals that increase in irradiance and pulse width, higher than that sufficient to suppress the target spike, results in generation of inhibitory signal (figure 10).
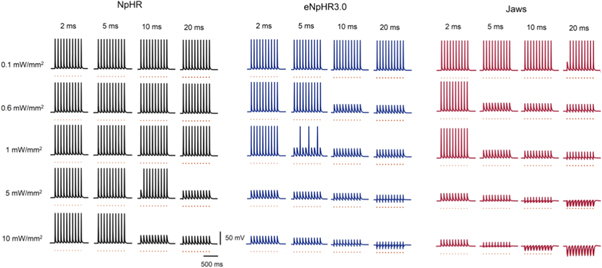
Figure 10. Effect of pulse width and irradiance on spike inhibition in NpHR, eNpHR3.0 and Jaws-expressing hippocampal neurons under pulsed illumination. Spikes evoked using 5 ms step current pulses (orange bars) of IDC = 10 μA cm−2, at 10 Hz, and inhibited using 593 nm light pulses of indicated pulse widths and irradiances, at same frequency and expression densities (g0) of 0.5, 0.05 and 0.1 mS cm−2 for NpHR, eNpHR3.0 and Jaws, respectively, using Δt equal to half of light pulse width used.
Download figure:
Standard image High-resolution imageTo assess the temporal resolution of light-mediated spike inhibition at higher frequencies, pairs of spikes, both closely timed and temporally separated, at different frequencies have been inhibited. For this, a sequence of spikes has been evoked electrically, in NpHR-expressing neurons. Further, selected pairs of spikes, both closely timed and temporally separated, at 5, 10, 20 and 30 Hz have been precisely inhibited with brief pulses of 593 nm light (figure 11). The simulated result in figure 11 exactly matches with reported experimental results [18].
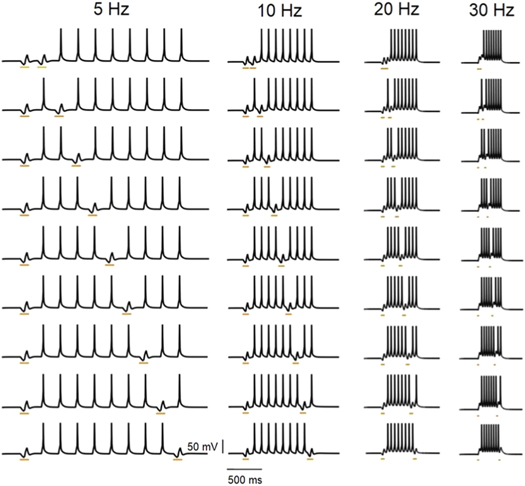
Figure 11. Analysis of temporal resolution of light-mediated inhibition at different frequencies in NpHR-expressing neurons. Spikes evoked using 30 ms (5 Hz), 25 ms (10 Hz), 20 ms (20 Hz) and 20 ms (30 Hz) step current pulses of IDC = 3 μA cm−2 and inhibited using light pulses of 100 ms (5 Hz), 90 ms (10 Hz), 45 ms (20 Hz) and 20 ms (30 Hz), at g0 = 0.4 mS cm−2 and I = 21.7 m W mm−2. Δt is equal to half of the light pulse width used.
Download figure:
Standard image High-resolution imageTo compare the temporal resolution of light-mediated spike inhibition in NpHR, eNpHR3.0 and Jaws-expressing neurons, trains of action potentials at 50 and 100 Hz have been evoked (figure 12). Again, both closely timed and temporally separated pair of spikes have been targeted using short pulses of light (figure 12). As is evident from figure 12, NpHR and Jaws fail to sustain temporal precision at 50 Hz and 100 Hz, respectively, whereas, eNpHR3.0 is able to sustain upto 100 Hz.
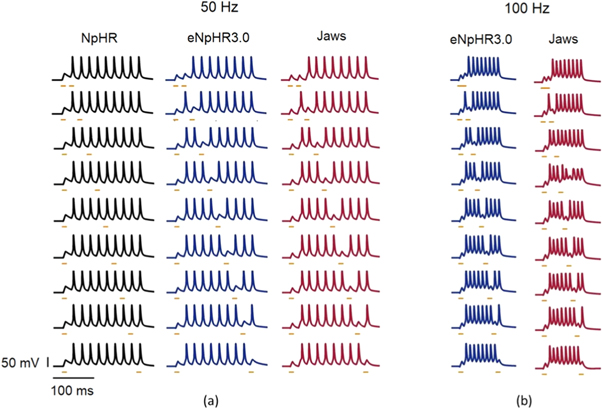
Figure 12. Analysis of temporal resolution of light-mediated inhibition at higher frequencies in NpHR/eNpHR3.0/Jaws-expressing neurons. Spikes evoked using 5 ms step current pulses of IDC = 10 μA cm−2 (50 Hz) and 12 μA cm−2 (100 Hz). (a) Spikes, at 50 Hz, inhibited using 10 ms light pulses of I = 25 mW mm−2 at g0 = 0.5 mS cm−2 for NpHR, I = 6 mW mm−2 at g0 = 0.05 mS cm−2 for eNpHR3.0, and I = 3 mW mm−2 at g0 = 0.1 mS cm−2 for Jaws. (b) Spikes, at 100 Hz, inhibited using same pulse width and g0, and I = 20 mW mm−2 for eNpHR3.0 and I = 5 mWmm−2 for Jaws. Δt = 2.5 ms.
Download figure:
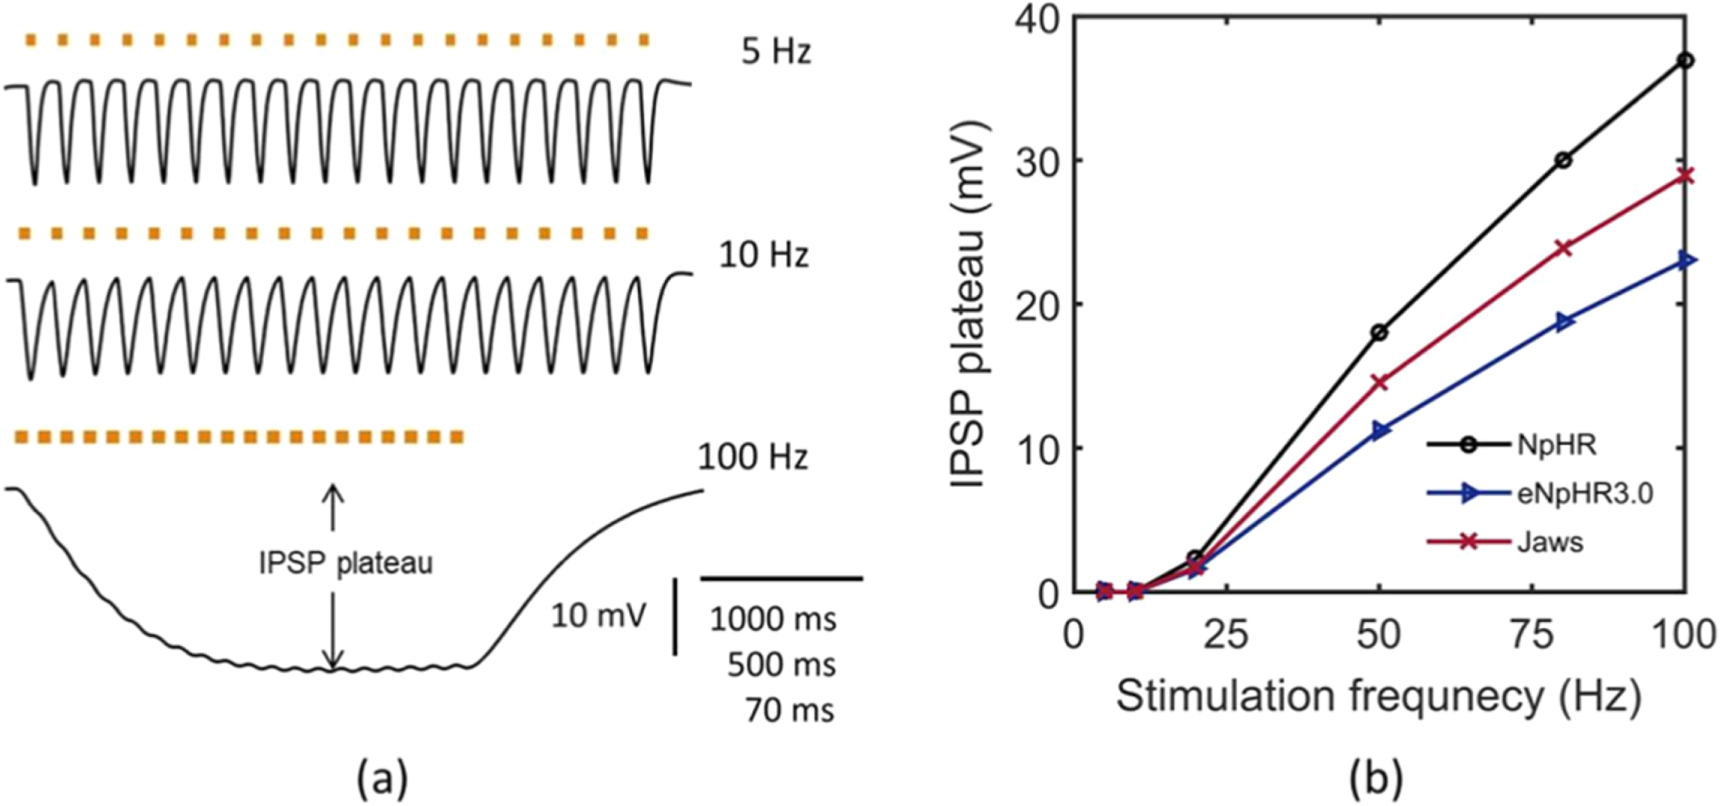
Standard image High-resolution imageIt is experimentally shown that by stimulating trains of small light pulses, barrages of inhibitory post synaptic potential (IPSP)-like events with precise, reliable timing and amplitudes at different frequencies can be generated in NpHR-expressing neurons [18]. NpHR-mediated precisely timed IPSP barrages at 5, 10 and 100 Hz have been simulated as shown in figure 13(a). The results exactly match with the reported experimental results [18]. The match at 100 Hz is at Cm = 3.24 μF cm−2. IPSP sequences in NpHR-expressing neurons shows IPSP plateau voltage above 10 Hz, which increases on increase in stimulation frequency. Further, we analyzed this characteristic for all the three variants at different frequencies (figure 13(b)). As is evident, at higher frequencies, eNpHR3.0 shows the lowest IPSP plateau in comparison to NpHR and Jaws (figure 13(b)). Irradiance and expression density are chosen such that at 5 Hz, IPSP of 12 mV amplitude can be generated in each opsin-expressing neuron.

Figure 13. Light evoked inhibitory post synaptic potential generation. (a) Light evoked IPSP barrages, in NpHR-expressing neurons, at I = 21.7 mW mm−2 and at indicated frequencies under photostimulation protocol of 50 ms pulse width, g0 = 0.45 mS cm−2 for 5 Hz; 25 ms pulse width, g0 = 0.45 mS cm−2 for 10 Hz; 5 ms pulse width, g0 = 2.5 mS cm−2 for 100 Hz. (b) Variation of IPSP plateau with input stimulation frequency of light pulse of 5 ms pulse width, at I = 21.7 mW mm−2 with g0 = 2.5 mS cm−2 for NpHR, I = 12 mW mm−2 with g0 = 0.05 mS cm−2 for eNpHR3.0, and I = 4 mW mm−2 with g0 = 0.1 mS cm−2 for Jaws-expressing neurons.
Download figure:
Standard image High-resolution imageTheoretical simulations show that the difference between the temporal position of inhibitory light pulse and exciting step current pulse, is a crucial factor for irradiance and expression level thresholds gNpHR for NpHR, geNpHR3.0 for eNpHR3.0, and gJaws for Jaws. Hence, the analysis has been carried out by inhibiting single action potential by varying Δt (figure 14). As is evident from figure 14, the variants having shorter tpeak leads to shorter value of Δt for better results. Empirically obtained good values of Δt are 8 ms, 3 ms and 5 ms for NpHR, eNpHR3.0 and Jaws, respectively (figure 14).
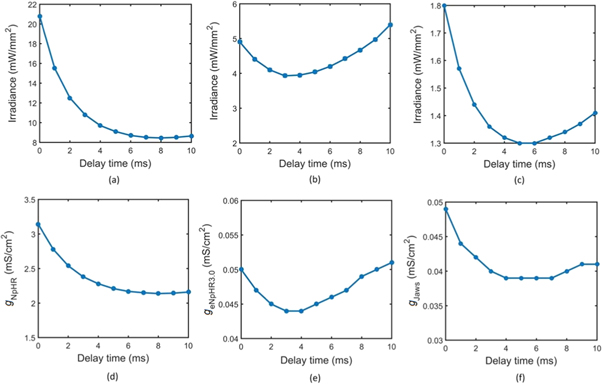
Figure 14. Effect of time difference between temporal position of inhibitory light pulse and excitatory current pulse on irradiance and expression density thresholds for single spike inhibition. Single action potential has been evoked using 10 ms step current pulse of IDC = 7 μ A cm−2. (a)–(c) The variation of irradiance threshold with time delay at 10 ms light pulse, and at g0 = 3.2, 0.05, and 0.1 mS cm−2 in (a) NpHR, (b) eNpHR3.0 and (c) Jaws-expressing neurons, respectively. (d–f) The variation of expression density threshold with time delay at 10 ms light pulse, and at I = 21.7, 5, and 5 mW mm−2 in (d) NpHR, (e) eNpHR3.0 and (f) Jaws-expressing neurons, respectively.
Download figure:
Standard image High-resolution imageAfter a detailed analysis of photostimulation protocol that includes irradiance, pulse width, frequency, Δt, and expression density, good values of these factors have been obtained empirically to get temporally precise optogenetic inhibition at very high-frequencies. Under the obtained set of photostimulation protocols and expression density, Jaws and eNpHR3.0 are able to precisely inhibit single spike, or pair of spikes, both closely timed and temporally separated, up to 160 and 200 Hz, respectively (figure 15). As is evident from figure 15, the inhibition at higher frequencies, beyond the limit, can also be achieved, although it is not possible to maintain single spike temporal resolution.

Figure 15. Optimization of temporal precision of single spike inhibition at higher frequencies. Spikes evoked using 3 ms current pulses of IDC = 50 μA cm−2 (for 160 Hz); 2.5 ms current pulses of IDC = 100 μA cm−2 (for 200 Hz); and 2 ms current pulses of IDC = 120 μA cm−2 (for 250 Hz). (a) Spikes at 160 Hz, inhibited using 3 ms light pulses of I = 20 mW mm−2 at g0 = 0.53 mS cm−2 for eNpHR3.0 and I = 10 mW mm−2 at g0 = 0.77 mS cm−2 for Jaws, using Δt = 1.5 ms. (b) Spikes at 200 Hz, inhibited using 2.5 ms light pulse of I = 20 mW mm−2 at g0 = 1.25 mS cm−2 for eNpHR3.0 and I = 20 mW mm−2 at g0 = 1.2 mS cm−2 for Jaws, using Δt = 1.5 ms. (c) Spikes at 250 Hz, inhibited using 2 ms light pulse of I = 20 mW mm−2 at g0 = 1.5 mS cm−2 for eNpHR3.0 and I = 20 mW mm−2 at g0 = 1.2 mS cm−2 for Jaws, using Δt = 1 ms.
Download figure:
Standard image High-resolution image
4. Discussion
In the present study, theoretical models of the photocurrent of eNpHR3.0 and Jaws have been formulated that include the effects of change in ![$\left[C{l}_{out}^{-}\right]$](https://content.cld.iop.org/journals/2057-1976/6/4/045011/revision2/bpexab90a1ieqn155.gif) on the photocurrent. Theoretical simulations based on models of NpHR/eNpHR3.0/Jaws-expressing hippocampal neurons also accurately simulate experimental results and provide important insights. The analysis of photodynamics reveals that for all the three halorhodopsins, toff does not vary with irradiance but decreases on increase in pulse width (figures 3(e), (f) and 4(e)). A minimal pulse width of 10 and 15 ms for eNpHR3.0 and Jaws respectively, obtained empirically, is sufficient to achieve peak photocurrent, at 5 mW mm−2, which is good to avoid unwanted heating effects in experiments (figures 4(a) and (f)). Under multiple pulse illumination at 10 Hz, the modulation ratio Ipeak10/Ipeak1 remains ∼ 1 for all three variants, and does not vary with irradiance and pulse width, which is good for inhibiting spikes with high temporal fidelity (figure 5). Due to its fastest turn-off kinetics, eNpHR3.0 does not show photocurrent plateau under multiple light pulses up to frequencies as high as 50 Hz, and shows lowest plateau among all three variants at higher frequencies (figure 6).
on the photocurrent. Theoretical simulations based on models of NpHR/eNpHR3.0/Jaws-expressing hippocampal neurons also accurately simulate experimental results and provide important insights. The analysis of photodynamics reveals that for all the three halorhodopsins, toff does not vary with irradiance but decreases on increase in pulse width (figures 3(e), (f) and 4(e)). A minimal pulse width of 10 and 15 ms for eNpHR3.0 and Jaws respectively, obtained empirically, is sufficient to achieve peak photocurrent, at 5 mW mm−2, which is good to avoid unwanted heating effects in experiments (figures 4(a) and (f)). Under multiple pulse illumination at 10 Hz, the modulation ratio Ipeak10/Ipeak1 remains ∼ 1 for all three variants, and does not vary with irradiance and pulse width, which is good for inhibiting spikes with high temporal fidelity (figure 5). Due to its fastest turn-off kinetics, eNpHR3.0 does not show photocurrent plateau under multiple light pulses up to frequencies as high as 50 Hz, and shows lowest plateau among all three variants at higher frequencies (figure 6).
Spectroscopic characterization of the photocycle of NpHR identifies six intermediate states (P1-P6) besides the ground-state (P0) [33]. The P4 and P5 states are involved in the release and uptake of chloride ions, whereas, the P6 state is a precursor of the ground state with the transition from P6 to P0 called the rate-determining transition. There is only a single active state P4, which is responsible to generate the photocurrent.
In the present study, we have considered a simple 3-state model by considering the ground state P0, the active state P4 and the precursor of ground state P6, since the decay kinetics of NpHR photocurrent can be accurately modelled by mono-exponential fit, and considering previous studies that have also been based on a 3-state model [18].
The present analysis shows that the 3-state model is able to accurately model the photoresponse of NpHR. However, models that incorporate more number of states can also be developed by considering other intermediate states of the photocycle. The P0 to P1 transition is near instantaneous, with a transition time in the picosecond range [33]. A four-state model can be formulated by introducing the P1 state to correctly account for the time needed for NpHR to activate after retinal transformation [39]. A five-state model can also be formulated by considering the P5-state, which is sensitive toward the chloride concentration and the type of anion [33]. Although models with more number of states will enhance the accuracy and knowledge to interpret experimental results, they would also add complexity and have negligible effect under pulses of duration ≥ m s, due to their very short life times (∼μs). The photocycles of eNpHR3.0, which is a modified version of NpHR, with altered kinetics engineered for efficient expression and optimization of neurophysiological properties, and Jaws the newly discovered light-driven chloride pump, have not been reported to date. In the present study, models for eNpHR3.0 and Jaws have also been formulated based on the photocycle of NpHR as all three chloride pumps are reported to have almost similar mechanism behind chloride transport [33].
Recent studies have shown that increased intraneuronal chloride results in drastic increase in network excitability and alters spike-timing, which is consistent with patterns of activity recorded in epileptic animals [43]. Also, the disruption of chloride gradients arises as a hub for pathology, which is evidenced in multiple disorders in the central nervous system [44]. The models presented allow monitoring of instantaneous changes in chloride concentrations during the experiment and open up opportunities to explore the use of these opsins as light-driven chloride transporters. The analysis shows how ![$\left[C{l}_{out}^{-}\right]$](https://content.cld.iop.org/journals/2057-1976/6/4/045011/revision2/bpexab90a1ieqn156.gif) alters the spiking inhibition capacity of all three opsins (figure 9). The study reveals that generation of higher photocurrent, either by an increase in pulse width or irradiance, results in an effective decrease in outer chloride concentration. The decrease in
alters the spiking inhibition capacity of all three opsins (figure 9). The study reveals that generation of higher photocurrent, either by an increase in pulse width or irradiance, results in an effective decrease in outer chloride concentration. The decrease in ![$\left[C{l}_{out}^{-}\right]$](https://content.cld.iop.org/journals/2057-1976/6/4/045011/revision2/bpexab90a1ieqn157.gif) directly influences the peak and plateau photocurrent, and adaptation ratio (figures 2(d)–(f)). After light turn-off, chloride ions efflux takes place from inside to the outside of the membrane and results in ICl-leak, which increases on increase in pulse width and saturates for longer pulse widths (figure 4(c)).
directly influences the peak and plateau photocurrent, and adaptation ratio (figures 2(d)–(f)). After light turn-off, chloride ions efflux takes place from inside to the outside of the membrane and results in ICl-leak, which increases on increase in pulse width and saturates for longer pulse widths (figure 4(c)).
Optogenetic stimulation can result in unwanted heating effects and cause thermal damage in the tissue [45, 46]. The present analysis reveals that irradiance can be minimized by an increase in expression density of halorhodopsins in the neurons. It is found that minimum irradiance of 5 mW mm−2, 0.4 mW mm−2 and 0.2 mW mm−2 results in 100% spiking inhibition under continuous illumination of 593 nm wavelength light on NpHR, eNpHR3.0 and Jaws-expressing neurons, respectively (figure 8). At 10 Hz, under pulsed illumination, short pulses of 5 ms with irradiance of 0.6 mW mm−2, enable 100% spiking inhibition in Jaws-expressing neurons (figure 10). Under pulsed illumination, the strength of applied light stimulus should not be higher than that required to suppress target spike, otherwise it would not only cause thermal effects but also result in the generation of IPSP-like events, as observed in Jaws-expressing neurons at 10 mW mm−2 and pulse-width of 20 ms (figure 10). All three variants are able to generate IPSP barrages of reliable timing and amplitude. At higher frequencies, eNpHR3.0 shows the lowest IPSP plateau potential, which is desired to generate ideal IPSP sequences at higher frequencies (figure 13).
It has also been reported that the use of higher expression level in vivo results in the formation of several intracellular blebs, which discourage higher expression in experiments [47, 48]. The theoretical analysis provides a novel insight on how the time delay between light stimulus and spike temporal position results in reduction in the irradiance and expression level thresholds for inhibition (figure 14).
One of the major challenges to existing neuromodulation technologies is to silence high-frequency spiking sequences in selectively defined neural populations, with high temporal precision [2, 14, 49]. Optimization of pulse width, expression density and relative temporal position of light stimulus to target spike, along with irradiance is required to precisely inhibit spiking sequence at very high frequencies. The present study has shown that, at empirically obtained good values of photostimulation protocol and expression density, eNpHR3.0 and Jaws enable single spike precise inhibition up to 200 Hz and 160 Hz, respectively (figure 15).
Within brain circuits, information about sensory stimuli is encoded in complex spatial and temporal patterns of activity. To encode the information, there is a need for a method to bidirectionally perturb and monitor the activity of multiple neurons maintaining single-cell resolution [50]. The present study supplements the recently reported high frequency optogenetic excitation of neurons, and would be useful in achieving this important objective [15, 31]. The study would also be useful to understand various phenomena associated with fast control of neural network events that include neural plasticity, temporal spike coding, recovery of behaviour, pathology, spike-timing dependent plasticity associated with learning and memory, restoration of auditory nerve activity in cortical areas, Parkinson's disease, and psychiatric illness [13, 51–53].
The kinetic properties of Jaws have been reported to be comparable to those of other optogenetic inhibitors, and its expression does not alter basal cell properties either in cultured cortical neurons, or in cortical or dentate granule neurons in acute brain slice [20]. It also restores photosensory responses in retinitis pigmentosa retinas with greater spike rates and more naturalistic frequency range, that could be of importance for retinal neural coding. Jaws has been shown to be useful for a wide range of applications in neuroscience [20, 54]. Recently, bidirectional control of cardiac pacing has been demonstrated by introducing Jaws and VChR1, a green light sensitive excitatory opsin channel, along with upconversion nanoparticles (UCNPs). These UCNPs with tissue-penetrable excitation and emission wavelengths, provide a robust toolbox for programmable on-demand optical control of Jaws and VChR1 in the same cell [55]. Obtained conditions for high frequency inhibition with Jaws would further extend its utility.
Red-shifted absorption of all three variants, especially Jaws, which is most red-shifted, allows silencing of neurons situated deep into the brain, due to less scattering of red-light in the tissue [20]. Also, the red-shifted opsins have spectral compatibility with blue light sensitive genetically encoded Ca2+ indicator fluorescence readouts, which allow it to be used to simultaneously manipulate and record from neurons [4]. The potential of photo-chemical damage in the human eye has an exponentially decaying correlation with wavelength, as small changes in the wavelength strongly affect safety threshold. Red-shifted channelrhodopsin variants are ideal for optogenetic vision restoration, as a shift in the wavelength from 470 nm (blue light) to 590 nm (orange light), results in an increase in the stimulating light intensity by three orders of magnitude. They have been used to restore light responses in blind mice, macaque, and human retinas [20, 21, 54–56]. Light-activated opsins have also been reported to be useful as ion modulators that would be invaluable for exploring the role of ion species in synaptic transmission, development and pathology [22].
Other than chloride pumps, naturally occurring, light-driven ion pumps conduct protons, sodium and potassium [57–59]. They have many structural and functional similarities, despite having remarkable differences in their mechanisms of ion transport. The study provides insight to develop mathematical models for these pumps also, to enhance the understanding of their mechanism and effects of transport of ions of a certain type. Anion channelrhodopsins have been proved to be more efficient than existing inhibitory pumps [60]. However, some factors could guide selection of a chloride pump over a chloride channel. For instance, in cases where chloride gradients might be inverted as in developmental or pathological situations, and certain cell types or subcellular compartments, even perfect chloride conductance and strong currents will not lead to better inhibition [17].
In general, the magnitude of the photocurrent of the opsin strongly depends both on the efficiency of membrane targeting and on the expression level [17]. It has been recently reported that a twofold increase in the expression level of ChR2 not only significantly increases the photosensitivity at both the single cell and organismal levels but also partially compromises the native electrophysiological properties of the neurons [61]. Other than that, in case of light-driven chloride pumps, lower extracellular chloride concentration causes stronger photocurrent inactivation [62]. It has been reported that these opsins are limited, however, in situations requiring long-lasting inhibition (typically > 15 s) and could potentially influence the cellular ion homeostasis [17]. Increase in extracellular pH also results in photocurrent inactivation as the Schiff base is expected to lose the proton more easily at higher extracellular pH [62]. Moreover, necessity of constant illumination to achieve continued inhibition with the light-driven pumps sets an upper bound on the volume of the modulated area due to risks of heating and photodamage [17, 63]. It is also reported that temperature increase of around 1.5 to 3 K may result in physiological changes in neural activity [64].
5. Conclusion
Accurate computational modeling of light-mediated silencing of spikes in NpHR/eNpHR3.0/Jaws-expressing hippocampal neurons, which incorporates the effect of change in ![$\left[C{l}_{out}^{-}\right],$](https://content.cld.iop.org/journals/2057-1976/6/4/045011/revision2/bpexab90a1ieqn158.gif) has been presented. Further, good practical values of photostimulation parameters and expression level have been obtained empirically for low power, high-frequency and temporally precise inhibition. The analysis opens up prospects for not only engineering new opsins but also to understand and perform new optogenetic experiments with desired spatiotemporal resolution. Itwould also be useful to study inhibition in other types of neurons, to understand and efficiently control neuronal activity, whether only inhibition or bidirectional, to understand temporal spike coding, to cure neurological disorders, and for designing optogenetic neuroprosthetic devices and circuits.
has been presented. Further, good practical values of photostimulation parameters and expression level have been obtained empirically for low power, high-frequency and temporally precise inhibition. The analysis opens up prospects for not only engineering new opsins but also to understand and perform new optogenetic experiments with desired spatiotemporal resolution. Itwould also be useful to study inhibition in other types of neurons, to understand and efficiently control neuronal activity, whether only inhibition or bidirectional, to understand temporal spike coding, to cure neurological disorders, and for designing optogenetic neuroprosthetic devices and circuits.
Acknowledgments
The authors gratefully acknowledge the University Grants Commission, India, for the Special Assistance Programme Grant No. (F.530/14/DRS-III/2015(SAP-I)). HB thanks Department of Science and Technology, India, for the award of the INSPIRE Fellowship (DST/INSPIRE/03/2017/003087).
Conflict of interest
The authors declare that they have no conflict of interest.