

Abstract
Mechanical and optical properties of Polydimethylsiloxane (PDMS) have been measured and reported for different applications, however, a full analysis and a compendium of its tension and compression moduli behaviour have not been carried out, nor of its refractive index, for several mixture ratios, temperature and curing time. In this work, samples of PDMS were manufactured and tested to know tension and compression moduli and refractive index as a function of fabrication parameters; Minitab®, Matlab®'s Least-squares fitting in Curve Fitting Toolbox™ and genetic algorithms were employed to yield functional dependencies to describe PDMS's behavior. The obtained fitting polynomials are shown to have large agreement with experimental data. Finally, a potential application in the design of a gradient index lens for use in artificial vision is presented.
Export citation and abstract BibTeX RIS

Original content from this work may be used under the terms of the Creative Commons Attribution 4.0 licence. Any further distribution of this work must maintain attribution to the author(s) and the title of the work, journal citation and DOI.
1. Introduction
Technological advancements have allowed innovations in the development of new components in several fields of knowledge; particularly in optics, freeform lenses, micro-components, several types of tunable lenses, and gradient index components have been proposed [1–8]. This has been largely due to the incorporation of new materials in the manufacture of optical components such as Polydimethylsiloxane Sylgard 184, better known as PDMS [9–11]. PDMS is an elastomer with excellent properties, for example is highly flexible, easy manipulable, transparent, light weight, non-toxic, inexpensive, gas permeable, hydrophobic, non-incrusting, electrical non-conductive, non-soluble, surface tension resistant, relatively easy to use in the fabrication of components and suitable to be used as matrix to contain molecules, nano and micro particles [12, 13].
Given its excellent opto-mechanical properties and characteristics, PDMS has been utilized in recent years in the development of several innovations, for example microelectronic components' coatings [14–16], valves, sensors and filters, parts of microelectromechanical systems (MEMS), biocompatible elements and micro-channels, among other applications; specifically in the optics field, it has been used to fabricate variable focal length liquid lenses [4, 5, 7, 9, 14, 17–27].
Study and characterization of PDMS's mechanical, chemical and optical properties are reported for specific cases in the literature; some fabrication methods are also mentioned to modify properties such as (a) curing and baking conditions, (b) different proportions of curing base agent, (c) different types of PDMS and other polymers, (d) inclusion of other molecules or particles and (e) elaboration of samples with different forms and sizes [13, 28–41].
Mechanical properties measurements of PDMS's samples are also detailed for predetermined synthesis parameters; relevant examples are the components´ ratio of base mixture: catalyst (ratios varying from 2:1 to 33:1) [9, 16, 21, 28], the curing temperature applied (from room temperature up to 310 °C) [30, 35], or the curing time (18 min to 48 h) [32, 41]. Reports indicate that Young's modulus, compressive and shear moduli vary in the ranges of 12 kPa–3 GPa, 117.8 MPa–186.9 MPa and 100 kPa–3 MPa, respectively [14, 18, 22, 35, 37, 42, 43].
Several of these studies assert that high curing temperatures influence PDMS's mechanical properties and degradation initiates in the range 300°C–310°C [30].
Results found at low temperatures show that mechanical properties are independent from heating time; in the curing process, mechanical strength decreases when heating temperature is high, and the elastic modulus increases same as mixture proportion up to a ratio of 9:1, after which the modulus reduces [35].
Non-linear models have been established to describe PDMS's mechanical behavior from stress-strain curves. Modulus of elasticity is dependent on deformation as far as 115%; it has a linear behavior until a deformation of 45%, then it reaches 97% deformation on a non-linear basis and diminishes from here [9].
The making of samples with monotonic stiffness in the range 0.24–1.67 MPa has been also presented; this interval is achieved when UV irradiation time is adjusted [41], and fabrication of samples with stiffness gradient in a single direction has been reported as a consequence of imposing a temperature gradient [43].
Following PDMS's optical characterizations, a waveguide monolithic system has been designed and produced, prepared with a mixture ratio of 10:1 at curing temperatures of 25, 50, 100 and 150 °C, yielding refractive indices in the interval 1.451 to 1.472 [44]; likewise, samples of PDMS were formulated varying mixing composition from 2.5:1 to 20:1 (basis: curing agent) cured at 95 °C over 30 min, attaining refractive indices of 1.422–1.440 [45]. In other works, polydimethylsiloxane's samples were developed with a proportion of 10:1 and cured between 70°C–150°C, and were diluted with chloroform, benzene and toluene; under these synthesis conditions, refractive indices were found to occur in the interval 1.3986–1.4107 [46]. Similarly, polydimethylsiloxane's samples cured at 150 °C were made with mixing ratios of 5:1, 9:1 and 19:1, giving indices about 1.40–1.44 [47].
Additionally, there are reports where optomechanical characterizations of Sylgard 184 are carried out, where a proportion of 10:1 and curing temperatures of 40 and 60 °C are utilized to determine refractive index to be 1.4295 for light of 635 nm wavelength [28]. Cruz Felix et al describe physical and chemical characterization of samples with 10:1 concentration cured at 100 °C, where they measured several optical parameters, for instance refractive index as 1.4325, absorbance and transmittance spectra; Raman spectroscopy and optical coherence tomography were used to qualitatively measure thickness and homogeneity of PDMS's membranes [11]. Recently, a report mentions the combination of PDMS with ZrO2 providing a refractive index in the range of 1.39 to 1.69 depending on mixture concentration [41]. Furthermore, variations of refractive index have been detected with variation of curing temperature [42], or when PDMS is mixed with another diphenylsiloxane group [48] and when samples are subjected to tension, refractive index undergoes small variations [49].
Even though there are reports citing bulk PDMS's optomechanical properties for certain mixture ratios, temperatures and curing times [50–52], values for refractive index and for Young's modulus do not exist for many mixing ratios. Therefore it is necessary to have a compilation of the optical and mechanical properties in the previously mentioned synthesis intervals, then this set of properties can be used in potential applications in the field of adaptive optics, refractive systems, gradient index elements, tunable optics and freeform elements.
Thereby, this work presents the characterization of 60 samples (see figure 1) elaborated with PDMS Sylgard 184, so that tension and compression tests were carried out following the ASTM D412 and ASTM D695 standards [53, 54], varying synthesis conditions in order to know mechanical and optical properties at the same time.

Figure 1. Manufactured PDMS samples using a mixture concentration of 10:1 (base: catalyzer), (a) for tensile test, (b) for compression test and (c) for optical characterization.
Download figure:
Standard image High-resolution imageAs a result, a compendium of relevant PDMS's optomechanical properties was come up with; mathematical expressions are described for the first time that will permit to know synthesis parameters to use in the fabrication of PDMS's specimens with a specifically desired refractive index and Young's modulus. The manufacturing process and characterization of such opto-mechanical properties are described [11]. Particularly, these expressions will facilitate design and fabrication of tunable refractive elements (elements capable of modifying their optical parameters when they are exposed to physical stimulus). Finally, an application is presented in this investigation.
2. Method and measurements
2.1. PDMS synthesis
Synthesis of this elastomer is straightforward considering the procedure recommended by the supplier; PDMS Sylgard 184 by Dow Corning® is presented as a viscous liquid kit of two components, a polymer base and a curing agent (catalyzer), when they are combined become a curable mixture [10]. Table 1 displays a matrix of synthesis parameters for the PDMS's specimens with several mixing ratios, curing time and temperatures. Twenty combinations of samples were developed to measure mechanical and optical properties of this polymeric composite; these specific combinations served to prepare twenty samples for compressive tests, twenty to be tested in tension and twenty more to determine optical characteristics, sixty tests were executed overall to achieve this material's characterization. As mentioned previously, samples were formulated according to ASTM D412 and ASTM D695 standards [53, 54].
Table 1. Synthesis parameters for PDMS's samples (3 samples by a code and temperature).
| Mixture code | Relation (base : catalyst) | |||
|---|---|---|---|---|
| M1 | 10:1 | |||
| M2 | 10:1.25 | |||
| M3 | 10:1.5 | |||
| M4 | 10:1.75 | |||
| M5 | 10:2 | |||
| Time/Curing temperature (min/°C) | 30/100 | 18/150 | 15/200 | 10/240 |
These synthesis parameters were taken from recommendations of Dow Corning® and those available in the literature [9–11, 24, 28, 30, 35, 44, 45], which use a lower quantity of the polymeric base with the corresponding increment in the catalyzer; curing temperatures are in the range of 100°C–200°C, with an additional temperature of 240 °C with a curing time of 10 min [30], as shown in table 1.
2.2. Mechanical test
Tensile and compressive tests were performed in a universal testing machine Autograph AG-IS model. Initial length of each sample was marked, later the device stretched or compressed the samples at a constant speed of 200 mm min−1 in tension and 0.08 mm s−1 in compression one at a time until specimen breakage. Data were used to generate stress-strain curves for each sample, obtaining tensile and compressive moduli [55, 56]. Experimental measurements are shown in table 2.
Table 2. Catalyzer concentration-temperature combinations and corresponding experimental properties.
| Catalyzer concentration Ci | Temperature Ti (°C) | Tensile modulus tme (MPa) | Compressive modulus cme (MPa) | Refractive index ne. |
|---|---|---|---|---|
| 1.0 | 100 | 0.93655 | 2.49975 | 1.408 |
| 1.0 | 150 | 1.00353 | 2.61458 | 1.420 |
| 1.0 | 200 | 1.03379 | 2.65017 | 1.428 |
| 1.0 | 240 | 1.10348 | 2.68080 | 1.430 |
| 1.25 | 100 | 1.04941 | 2.71569 | 1.410 |
| 1.25 | 150 | 1.07626 | 2.76023 | 1.420 |
| 1.25 | 200 | 1.11957 | 2.76236 | 1.432 |
| 1.25 | 240 | 1.16817 | 2.77305 | 1.432 |
| 1.50 | 100 | 1.25846 | 2.84197 | 1.412 |
| 1.50 | 150 | 1.27464 | 2.88806 | 1.425 |
| 1.50 | 200 | 1.31356 | 2.92452 | 1.434 |
| 1.50 | 240 | 1.37583 | 2.98575 | 1.434 |
| 1.75 | 100 | 1.49067 | 3.16656 | 1.414 |
| 1.75 | 150 | 1.56349 | 3.21033 | 1.430 |
| 1.75 | 200 | 1.58242 | 3.22647 | 1.438 |
| 1.75 | 240 | 1.62468 | 3.30544 | 1.440 |
| 2.0 | 100 | 1.70237 | 3.40352 | 1.418 |
| 2.0 | 150 | 1.72761 | 3.49281 | 1.434 |
| 2.0 | 200 | 1.79296 | 3.59347 | 1.442 |
| 2.0 | 240 | 1.83197 | 3.77605 | 1.445 |
2.3. Measurement of refractive index
Refractive index was measured experimentally with a projection Abbe refractometer model WY1A by Xintian Fine Optical Instrument Corporation; it uses a lamp as illumination source with a wavelength of 589 nm and is designed to obtain the bulk refractive index of a transparent solid. The process of measuring the refractive index consisted in calibrating the device using a reference block with a refractive index of 1.536, then the bottom side of the sample was coated with oil (whose properties are known, i.e., 1-brome-naphtalene), whose refractive index is in the range between sample's and prism's indices; the oil serves to compel contact with the refracting prism. Finally, samples were placed in the refractometer to take the measurements.
Experimental measurements of refractive index are displayed in table 2; in the first and second columns, the values of the catalyzer and curing temperatures used in each sample are shown respectively.
3. Analysis and results
Behavior of the experimental data was analyzed, and a polynomial data fit to find a dependency of mechanical parameters and refractive index with respect to synthesis parameters was performed. Higher order polynomials were considered for the fitting of both tensile modulus and compressive modulus, and a third order polynomial was used to fit analytically the experimental refractive index data. Three fitting tools were used to find polynomial coefficients that best fit the experimental data: Minitab®, Least-squares fitting in Curve Fitting Toolbox™ by Matlab® and genetic algorithms (GA). Mean absolute percentage error (MAPE) was considered to know the average of the absolute differences between experimental and fit values of each implemented tool in order to select the polynomials with the least error [57]. Polynomials used in these fittings are shown in equations (1) and (2):


where Ci is mixture ratio, Ti is temperature, pij are the polynomial coefficients to be found, cm(C,T), tm(C,T) and n(C,T) represent the compression modulus, the tension modulus and the refractive index respectively.
3.1. Mechanical characterization
First, a polynomial fitting was performed to experimental data of tensile modulus; Minitab® gave the best fit with an MAPE of 0.449%. Equation (3) describes the polynomial found, and figure 2 shows the polynomial graph along with the experimental data.

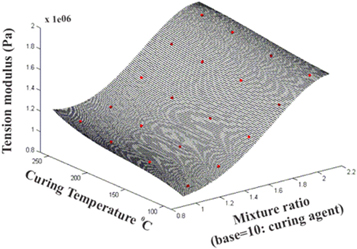
Figure 2. Polynomial graph found for tensile samples and measured experimental data.
Download figure:
Standard image High-resolution imageLikewise, a polynomial fitting was carried out to the compressive modulus' data of the experimental samples, to find dependency with respect to synthesis parameters. The polynomial found that best fits the experimental data resulted from the application of GA with an MAPE of 0.357% as expressed in equation (4); its graph and the experimental data are presented in figure 3.


Figure 3. Polynomial graph corresponding to samples in compression and measured experimental data.
Download figure:
Standard image High-resolution image3.2. Optical characterization
Finally, a polynomial fit was made to the refractive index's experimental data, where Matlab® achieved the best MAPE with a value of 0.039%; this polynomial and its graph are represented in equation (5) and figure 4, respectively.


Figure 4. Polynomial graph of refractive index and experimental data.
Download figure:
Standard image High-resolution image3.3. Application in adaptive optics
In this section only the design of a GRIN type lens (gradient-index; the refractive index of a GRIN lens is a function of the position) is presented. The proposed lens is composed by several layers to emulate the functioning of the crystalline lens of the human eye, i.e., a lens whose refractive index reduces from its center to its periphery [58].
For this particular GRIN lens, an interval of refractive indices from 1.408 to 1.418 was selected for the layers; the lens is designed to be able to change its shape with the application of a mechanical stimulus over its periphery. The use of PDMS Sylgard 184 is considered within the design of the adaptive lens; in addition, it is contemplated that the lens consists of 9 layers with the profiles of the anterior and posterior sufaces given by the parameters shown in table 3 [59]. By using equation (5), the parameters displayed in figures 5 and 6 were found, each concentration is considered at a curing temperature of 100 °C. The refractive indices and positions of each of the layers are shown in figure 5 and the cross section of the lens is presented in figure 6. As it can be seen, it is possible to develop adaptive optical components with applications in visual optics, counting on a component that replicates the focusing ability of the human eye's crystalline lens.
Table 3. Characteristics of the lens' design [59].
| Feature | Parameter |
|---|---|
| Radius of Curvature | Anterior surface = 10.2 mm |
| Posterior surface = −6 mm | |
| Conic constant | Anterior surface = −3.1316 |
| Posterior surface = −1 | |
| Thickness | 4 mm |
| Diameter | 10 mm |
| Effective focal length | 24.81 mm |
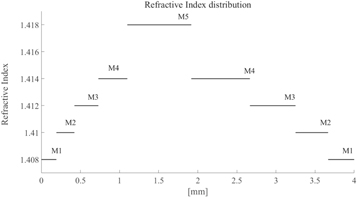
Figure 5. Thickness and position of layers as function of refractive index.
Download figure:
Standard image High-resolution image
Figure 6. Lens design composed of layers with different concentrations and different refractive indices.
Download figure:
Standard image High-resolution image
A proposed fabrication process of this lens consists in pouring each layer manually and sequentially into the mold, controlling the volume and the curing parameters of the mixture, starting from the outer layers. Through this manual procedure, GRIN lenses with only a few tens of layers are possible to generate. In future works, simulations and a complete analysis of the functioning of a lens with these characteristics will be presented.
4. Conclusions
Compression and tension moduli, and refractive indices were measured in samples of PDMS Sylgard 184, fabricated with different curing parameters and concentration ratios. From these measurements, mathematical expressions are reported for the first time that estimate compressive and tensile moduli, and refractive index as a function of mixture concentration, curing time and temperature. Such polynomials were found by carrying out a fitting of the parameters measured experimentally; three tools were utilized to do it and the polynomial with the best fit for each moduli was selected considering the mean absolute percentage error as the selection criterion, which was lesser than 0.45% for all the cases. Those polynomials were employed to estimate the synthesis parameters to be used in elaborating the layers to construct a GRIN type lens, which can be used in artificial vision applications. These polynomials can be used also to designing several low cost components such as waveguides, sensors, opto-electronic components, etc. It is considered that the expressions have potential applications in diverse fields of science.