

Abstract
High-entropy alloys (HEAs) were used to improve the hardness, wear resistance, and corrosion resistance of steel surfaces by laser cladding due to their outstanding mechanical and corrosion resistance properties. However, there are only a few literary works on the improvement of wear resistance on the aluminum alloy surface by HEAs. In this work, the wear performance of laser cladded Al0.8CrFeNiCoAlCux HEA coating on aluminum alloy with different Cu contents was investigated in detail. Moreover, phase structure, microstructure, bonding shear strength, and corrosion resistance of HEA coatings were studied by XRD, SEM, tensile device, and electrochemical workstation. The result shows that with the increase of the Cu content, the structure of the coatings changed from BCC1 and BCC2 phases to BCC1, BCC2, and FCC1 phases. Evident cracks were observed in the Al0.8CrFeCoNi HEA coating. Meanwhile, when x = 0.25, the cracks disappeared, but the bonding shear strength was 79.6 MPa, only 34.7% of the substrate. At 0.5 ≤ x ≤ 1, the bonding shear strength of the Al0.8CrFeCoNiCux HEA coatings went above 175.2 MPa. As Cu promotes the formation of FCC phase, the hardness of the Al0.8CrFeCoNiCux HEA coating decreased as the Cu content increased. The effect of Cu on wear resistance has the same trend as with hardness. The wear rate of Al0.8CrFeCoNiCu0.5, Al0.8CrFeCoNiCu0.75, and Al0.8CrFeCoNiCu HEA alloys is only 3.4%, 4.02%, and 5.42%, respectively, of the substrate. The wear mechanisms of the substrate are that of delamination fracture and serious adhesion wear, while the wear mechanisms of Al0.8CrFeCoNiCux (0.5 ≤ x ≤ 1) HEA coatings are that of adhesive and abrasive wear. The corrosion resistance of Al0.8CrFeCoNiCux (0.5 ≤ x ≤ 1) HEA is better than that of the substrate in 1 mol l−1 H2SO4 solution. Al0.8CrFeCoNiCu0.5 has the best corrosion resistance that is characterized by pitting and intergranular corrosion.
Export citation and abstract BibTeX RIS

Original content from this work may be used under the terms of the Creative Commons Attribution 4.0 licence. Any further distribution of this work must maintain attribution to the author(s) and the title of the work, journal citation and DOI.
1. Introduction
Aluminum alloy has been widely used in manufacturing, transport, aerospace and other fields due to its high specific strength, small specific weight, and good ductility [1–3]. However, due to poor surface hardness and low wear resistance, its application has been limited in some top-end areas. In recent years, surface treatment, such as electroplating, physical vapor deposition (PVD) and laser cladding (LC) [4–6], have been gradually applied for the surface modification of aluminum alloy. Among them, LC has stood out due to its features of less pollution, high efficiency, and the preparation of thicker coatings. In the process of LC on the aluminum alloy surface, a large amount of Al will inevitably float to the molten pool due to its low melting point. Also, as Al is highly electronegative, it readily reacts with the traditional coating materials, such as iron-based alloys, nickel-based alloys, and ceramics, to produce generous brittle intermetallic compounds. These intermetallic compounds increase the cracking sensitivity and affect the performance of the coating [7–10]. Therefore, the preparation of coatings on aluminum alloy has always been a problem in the field of LC.
High-entropy alloy (HEA) has persistently been a hot research subject in the field of materials science [11–13], since it was developed in 2004. HEA is generally defined as alloys formed by five or more elements with a molar ratio between 5% and 35% and having an entropy greater than 11. RJ mol−1 · K−1 [14]. HEAs have high strength and hardness, good corrosion resistance, and excellent thermal stability [15]. Khan et al [16] prepared a film of AlCrFeCoNiCu0.5 HEA using magnetron sputtering technology and found that the alloy had an FCC and BCC dual-phase structure and a hardness value of 13 GPa. Luo et al [17] prepared the WC + AlxCrFeCoNiCu (0 ≤ x ≤ 1.5) composite by mixing WC with Al, Cr, Fe, Co, Ni, and Cu powders, by plasma sintering. Due to slow diffusion effect, the WC particles dispersed in the solid solution phase of HEA, and the WC + Al0.5CrFeCoNiCu composite exhibited a high hardness of 2071 HV30, and a good fracture toughness of 10.3 MPa. Matusiak et al [18] prepared the AlxCrFeCoNiCuy (0 ≤ x ≤ 1.5, 0.5 ≤ y ≤ 2) HEA by vacuum arc melting. This alloy contains both FCC and BCC phases, with presence and stoichiometry dependent on the Al and Cu concentrations. Meng et al [19] prepared the AlCrFeCoNiCu HEA particles on the surface of AZ91D magnesium alloy by laser casting. Although the reinforcing phase particles and the Mg matrix coexist in the molten state, no intermetallic compound with complex phase structure was formed in the coating after solidification due to high mixing entropy of the alloy. This current research group [20] prepared a single-track AlCrFeCoNiCu HEA coating on the surface of aluminum alloy by LC in the continuous wave (CW) mode, the coatings form duplex FCC and BCC solid solution. Meanwhile, the average hardness was five times that of the substrate, but Cu was segregated in the interdendritic region.
The analysis above shows that Al has extensive solid solubility in the HEA system that contains Fe, Co, Ni, Cr, and Cu elements. As a result, under the high temperature condition, aluminum flows from the substrate to the coating. There, it reacts with the initial powder, making it difficult to form many intermetallic compounds with a complex phase structure, thereby reducing the cracking tendency of the coating. This indicates that the HEA has the potential to improve the surface properties of aluminum alloys. However, further investigations on HEA properties are still required to determine the degree of applicability in Al substrates.
Generally, the thickness of the coating prepared by laser cladding is between 0.2 and 2 mm. This makes it difficult to prepare standard mechanical samples. Therefore, the evaluation of the bonding quality relies on optical observation of the bonding interface structure. But, it is also not possible to quantitatively contrast the effects of different composition or process parameters. Also, there is only a limited research on the improvement of surface wear and corrosion resistance of the aluminum alloy with HEA coating, especially wear resistance. Furthermore, the influence of Cu segregation on structure and the properties of the HEA coating remain to be clarified.
In this research, the Al0.8CrFeCoNiCux HEA coatings with different Cu content were prepared on the surface of aluminum alloy, the phase and microstructure were investigated. The bonding quality was quantitatively evaluated through shear testing. On this basis, the wear and corrosion resistance of the Al0.8CrFeCoNiCux (0.5 ≤ x ≤ 1) coating was studied. Ultimately, a range of Cu values was determined for the suitable design of Al0.8CrFeCoNiCux HEA coating on the aluminum alloy.
2. Experimental materials and methods
5083 Al alloy was selected as the substrate due to its good weldability and superplasticity. Its composition is shown in table 1. A sample size of 50 × 30 × 10 mm was used. As the oxide film on the surface of Al substrate can affect the bonding strength of the coating, the surface of the substrate was polished with 800# sandpaper before laser cladding. It was then put into saturated sodium hydroxide solution and then into dilute hydrochloric acid solution for complete removal of the oxide film. To ensure the continuity and fluidity of the powder in the nozzle tube, spherical or near-spherical Al, Fe, Co, Ni, Cr, Cu metal powders were selected. They were produced by Changsha Tianjiu Company. The morphology of the as-received metal powders is shown in figure 1. The powder purity was 99.9%, and the particle size was 200–325 meshes. The powder ratio and the alloy abbreviations are shown in table 2. The mixed powder was ball milled in an argon atmosphere for 2 h and was then placed in a vacuum oven to dry for 2 h. It was then finally sealed and stored.
Table 1. Chemical composition of 5083 aluminum alloy (wt%).
| Element | Si | Cu | Mg | Zn | Mn | Ti | Cr | Fe | Al |
|---|---|---|---|---|---|---|---|---|---|
| wt% | ≤0.4 | ≤0.1 | 4.0–4.9 | ≤0.25 | 0.4–1 | ≤0.15 | 0.05–0.25 | 0–0.4 | Bal. |
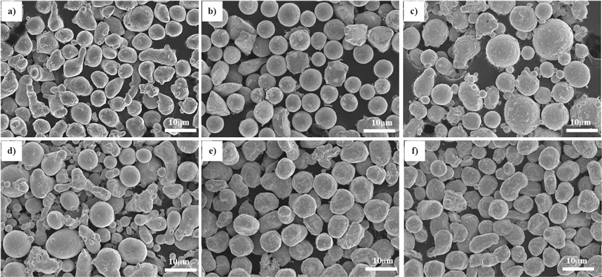
Figure1. SEM diagrams of powders:.(a) Al, (b) Cr, (c) Fe, (d) Co, (e) Ni, (f) Cu.
Download figure:
Standard image High-resolution imageTable 2. Nominal components and abbreviation of Al0.8FeCoNiCrCux (at%).
| Sample | Abbreviation | Al | Cr | Fe | Co | Ni | Cu |
|---|---|---|---|---|---|---|---|
| Al0.8CrFeCoNi | Cu0 | 16.66 | 20.83 | 20.83 | 20.83 | 20.83 | 0 |
| Al0.8CrFeCoNiCu0.25 | Cu0.25 | 15.84 | 19.80 | 19.80 | 19.80 | 19.80 | 4.95 |
| Al0.8CrFeCoNiCu0.5 | Cu0.5 | 15.09 | 18.86 | 18.86 | 18.86 | 18.86 | 9.43 |
| Al0.8CrFeCoNiCu0.75 | Cu0.75 | 14.41 | 18.01 | 18.01 | 18.01 | 18.01 | 13.51 |
| Al0.8CrFeCoNiCu | Cu1.0 | 13.79 | 17.24 | 17.24 | 17.24 | 17.24 | 17.24 |
The DC050 slat-type CO2 laser equipment by Rofin Company was used. The output wavelength was 1063 μm, the maximum output power was 5000 W, and the beam quality factor was greater than 0.9. The motion device was an SLC-X1530 four-axis linkage CNC machine tool, produced by Shanghai PRIMA Company. The powder feeding device used was RC-PGF-D-2 by Beijing University of Technology, and the shielding gas was argon. Based on a large number of previous experiments [20, 21], the process parameters are as follows: spot diameter 1.2 mm, laser power 1850 W, powder feed rate 5.6 g min−1, scanning speed 120 mm min−1, duty cycle 70%, pulse frequency 50 Hz, overlap rate 30%, and carrier gas flow rate 5 l min−1. The processing equipment and experiment diagram are shown in figure 2.

Figure 2. Laser cladding equipment and schematic laser cladding diagram. (a) Laser cladding equipment, (b) Schematic diagram.
Download figure:
Standard image High-resolution imageThe phase of the coating sample was analyzed by Empyrean sharp x-ray diffraction (XRD), at a scanning speed of 4 deg min−1 and in the angle scan range of 20°–90°. The middle section of the coating was cut perpendicular along the scanning direction. It was then burnished with 400# to 3000# sandpaper and was polished with a 2 μm alumina suspension. The HEA coating was etched with the mixed solution of hydrochloric acid and nitric acid (volume ratio 3:1). The microstructure of the coating was observed on a scanning electron microscope (SEM, JSM-6510F), and the composition was analyzed by an energy dispersive spectrometer (EDS). Transmission electron microscope (TEM, JEM-2100F) was used to further analyze the phase structure of the sample. The 0.5 mm thickness sample was prepared by wire cutting and was polished to 50–80 μm by a sandpaper. It was then made into a thin circle with 3 mm diameter by a punching mechanism. Then, the sample was thinned by electrolysis in 5% perchlorate alcohol environment until perforation. Finally, it was reduced to 30–200 nm by the plasma thinning machine. The hardness of the coating was measured by a microhardness tester (MH-60), where the input load was 200 g, and the loading time was 10 s.
To obtain the effect of different Cu contents on the bonding quality of the coating, quenched high-strength steel shear sleeve with 40 mm internal diameter was made. The Al0.8CrFeCoNiCux HEA coating and convex plate were prepared on the cylindrical surface of the aluminum alloy bar of 40 mm diameter by laser cladding and turning process, respectively. The convex plate width was 1 mm, and the height was 1.5 mm. Shear force was determined by a DNS100 universal tensile tester, and the bonding quality, which is a measure of shear stress (or bonding shear strength), was calculated by the formula [22]:

where  is the maximum shear load,
  is the shear area,
  is the diameter of the test specimen, and
  is the coating width. Test equipment and the schematic diagram are shown in figure 3.
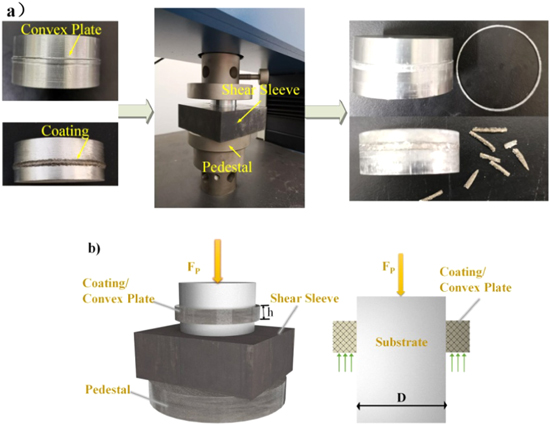
Figure 3. Test equipment and schematic diagram. (a) Test equipment, (b) Schematic diagram.
Download figure:
Standard image High-resolution imageThe wear test was conducted at room temperature and standard atmospheric pressure. The wear track used a GCr15 steel ring with a hardness of 61 HRC, a diameter of 50 mm, and a thickness of 10 mm. The wear specimen's dimensions were 7 × 14 × 10 mm. The surface of the coating was grounded and polished before the wear test and was then washed with acetone and dried. The test load was 98 N, the speed was 400 r min−1, and the time was 30 min. In the wear test process, the friction moment was measured every 5 min, and the friction coefficient of the sample was calculated. The formula is as follows:

where  is the friction coefficient,
  is the friction moment (Nm),
  is the load (N), and
  is the wear ring radius (mm). The wear rate of the material was evaluated by calculating the wear volume. The formula is as follows:


where  is the wear rate,
  is the wear volume (mm3),
  is the wear track length (mm),
  is the wear track width (mm),
  is the rotating speed of the wear ring (r min−1), and
  is the total wear ring sliding length (mm). Figure 4 shows the schematic diagram of the wear test.
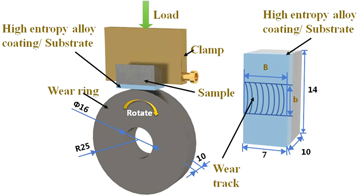
Figure 4. Schematic diagram of the wear test.
Download figure:
Standard image High-resolution imageThe corrosion resistance test uses an electrochemical workstation (Zahner). The electrolyte was the three electrode working system: the test sample as the working electrode, platinum as the counter electrode, and Hg/Hg2SO4 as the reference electrode. The scan rate was 5 mV s−1. The free corrosion potential ( ) and free corrosion density (
 ) of samples is obtained by fitting the polarization curve. The calculation formula of the polarization resistance (
 ) is as follows [23]:

where  is the anodic Tafel slopes
  is the cathodic Tafel slopes.
3. Results and Discussion
3.1. Phase constitution and microstructure analysis
Figure 5 shows the XRD patterns of Al0.8CrFeCoNiCux (x = 0, 0.25, 0.5, 0.75, 1.0) HEA coating. Cu0 alloy consisted of both BCC1 and BCC2 phases. The BCC1 phase was a disordered BCC solid solution, whose diffraction peak was  similar to α-(Fe,Cr). The diffraction peaks near
  proved that the BCC2 phase was an ordered BCC phase (B2 phase) that is close to the AlNi phase [24]. This result is consistent with the casting of Al1.5CrFeCoNiCu alloy [25]. This also confirms that the Al in the substrate floated towards the coating during the LC process. When x = 0.25, the diffraction peak of the FCC phase appeared in Cu0.25 alloy, and the diffraction peak position was
  similar to α-Cu. The phase structure of Cu0.5, Cu0.75 and Cu1.0 alloys are the same as that of Cu.25 alloy. In addition, the intensity of FCC phase diffraction peaks enhance with Cu increasing, indicating that the volume fraction of FCC phase increase.

Figure 5. XRD map of Al0.8CrFeCoNiCux HEA coatings.
Download figure:
Standard image High-resolution imageAll the samples formed simple crystal structures: body-centered cubic and face-centered cubic. Complex structure was not found, and the total number of phases did not exceed three. According to Gibbs function,  (where P is the number of alloy forming phases, and n is the number of main elements), the number of alloy forming phases should be greater than the number of principal components. However, in this study, the number of phases is smaller than the predicted value of Gibbs function. As the configurational entropy of the alloy increases from the mixing of various powders at nearly equal molar ratios, the alloy tends to form a simple crystal structure with lower free energy in high temperature reactions. This inhibits the high formation enthalpy of fusion intermetallic compounds with complex phase structure [26]. Eventually, the number of phases reduced.
3.2. Microstructure
Figure 6 shows the SEM images of cross section and microstructure of coatings, where DR and ID represent dendrite and interdendrite structures, respectively. The coating thickness was in the range of 582–675 μm. Table 3 shows the EDS result of each region in figure 6. As shown in figures 6(a) and (b), some of the Cu0.25 alloy grains are petal-like and contain tiny corrosion holes on the grain. A small amount of light-colored precipitates (LP) are formed at the grain boundary region. EDS shows that the Cu content of LP is significantly higher than the nominal composition (table 3). Cu is excluded in the interdendrites during solidification due to its positive enthalpy of mixing [27]. When Cu increases to 0.5, some of the LP chain shapes were found at the grain boundary (figures 6(c) and (d)). Also, corrosion holes were observed at the grains, and the distribution of each element was similar to that of Cu0.25 alloy (table 3). Different from the Cu0.5 alloy, net-like structures were observed at the grain boundary in Cu0.75 and Cu1.0 alloys (figured 6(e)–(h)). EDS shows Cu segregation in ID as before (table 3). Combined with the XRD results, it can be inferred that with the increase of Cu content, the Cu-rich FCC phase of laser cladded Al0.8CrFeCoNiCrCux HEA changes from point distribution to continuous distribution. However, the Cu0 alloy has evident cracks along the grain boundary (figure 6(i)). Combining crack characteristics and EDS results, the reasons behind the formation of cracks are inferred as follows: the large difference in melting points between the substrate and the test powder results in the large temperature gradient of the molten pool in the LC process. Therefore, a large thermal stress will be generated in the coating. Cu0 alloy lacks the FCC phase with strong toughness. This makes the atoms near the grain boundary unable to release the lattice distortion energy through the cross slip of screw dislocation and edge dislocation in the cooling process. Finally, the cladding layer cracks along the intergranular. A similar appearance occurs in the laser cladded AlCrFeCoNi HEA coating on pure aluminum by Shon et al [28]. Notably, the Al content of the samples is generally higher than the nominal composition (table 3), indicating that the Al in the substrate floats towards the coating during LC.
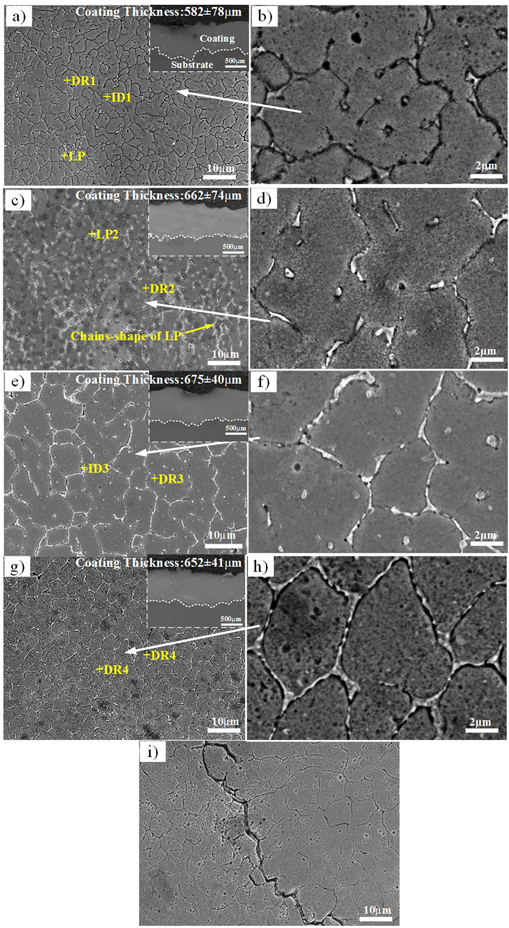
Figure 6. The SEM images of cross section and microstructure of Al0.8CrFeCoNiCux HEA coating. (a) x = 0.25; (b) enlarged image of that in figure 6(a) (c) x = 0. 5; (d) enlarged image of that in figure 6(c) (e) x = 0.75 (f) enlarged image of that in figure 6(e) (g) x = 1 (h) enlarged image of that in figure 6(h) (i) x = 0.
Download figure:
Standard image High-resolution imageTable 3. Energy spectrum analysis of each region in figure 6 (at%).
| Areas | Al | Cr | Fe | Co | Ni | Cu | |
|---|---|---|---|---|---|---|---|
| Cu0.25 | Nominal | 15.84 | 19.80 | 19.80 | 19.80 | 19.80 | 4.95 |
| DR1 | 14.62 | 23.69 | 21.36 | 19.78 | 15.58 | 4.97 | |
| LP1 | 17.24 | 12.31 | 14.76 | 14.82 | 16.31 | 23.92 | |
| Cu0.5 | Nominal | 15.09 | 18.86 | 18.86 | 18.86 | 18.86 | 9.43 |
| DR2 | 18.23 | 19.71 | 20.95 | 19.84 | 15.59 | 5.68 | |
| LP2 | 18.64 | 12.46 | 14.48 | 13.18 | 14.39 | 26.85 | |
| Cu0.75 | Nominal | 14.41 | 18.01 | 18.01 | 18.01 | 18.01 | 13.51 |
| DR3 | 16.44 | 18.62 | 19.26 | 18.98 | 19.38 | 7.32 | |
| ID3 | 18.24 | 11.01 | 13.86 | 14.72 | 16.85 | 25.30 | |
| Cu1.0 | Nominal | 13.79 | 17.24 | 17.24 | 17.24 | 17.24 | 17.24 |
| DR4 | 15.86 | 17.54 | 18.45 | 17.87 | 16.93 | 13.35 | |
| ID4 | 18.25 | 9.54 | 9.93 | 12.42 | 20.54 | 29.32 |
Figure 7 shows the TEM images of Cu0.5 alloy. The bright field shows that the elliptic precipitate (EP) is unevenly distributed on the matrix (figure 7(a)). The corresponding selected area diffraction (SAD) images show that the matrix is a disordered BCC phase, whereas the EP is an ordered BCC (B2 structure) due to [001] zone axis diffraction (figures 7(b) and (c)). Also, [100] zone axis diffraction and EDS results confirm that the interdendrite is a Cu-rich FCC phase (figure 7(d)). Both EP and the matrix have BCC structures but are composed of different elements. EP and matrix only exist in small lattice misfit, so that there is a specific crystallographic coherence between them. Thus, EP presents an elliptic shape [29]. Since the B2 phase is an unevenly distributed matrix and has worse corrosion resistance than the disordered BCC [30], tiny corrosion holes appear on the surface of Cu0.5 grains, as shown in figure 6(b).

Figure 7. The bright field and SAD images of Cu0.5 alloy by TEM. (a) Bright field image, (b) SAD of matrix phase, (c) SAD of elliptic precipitate, (d) SAD of the interdendritric region.
Download figure:
Standard image High-resolution image3.3. Hardness
Figure 8 shows the average microhardness of Al0.8CrFeCoNiCux (x = 0, 0.25, 0.5, 0.75, 1.0) HEA coatings and substrates. The Cu0 alloy is mainly composed of the BCC phase. There are less slip planes in the BCC crystal structure, and they do not easily deform under load, therefore, the Cu0 alloy has the highest hardness. With the increase in Cu content, the FCC phase of Al0.8CrFeCoNiCux HEA increases. There are more slip directions in {110} slip plane of the FCC structure compared with the BCC structure, and plastic deformation is easier to occur under load. Therefore, the hardness of the Al0.8CrFeCoNiCux HEA gradually decreases. Compared with the substrate, the Al0.8CrFeCoNiCux HEA coating shows a higher hardness as a whole. This is related to the HEA containing different kinds of elements. These elements with different sizes in the alloy cause strong lattice distortion. The interaction of the stress field and elastic stress field generated by the lattice distortion will have a strong pinning effect on dislocation slip, thus increasing the resistance of dislocation movement and finally increasing the hardness of the alloy.

Figure 8. Average hardness of the Al0.8CrFeCoNiCux HEA coatings.
Download figure:
Standard image High-resolution image3.4. Bonding shear strength
Figure 9 shows the relationship between shear deformation and shear load of the substrate and Al0.8CrFeCoNiCux HEA coating. Table 4 shows the results of the shear test. As shown in figure 9(a), the test curve of the substrate can be divided into four sections of OA, AB, BC, and CD. The OA section stands for the assembly gap between shear sleeve and the sample. In the AB section, the amount of shear deformation linearly increases with the shear load, which conforms to Hooke's law and would be classified as the elastic deformation stage. In the BC section, the slope of the curve decreases. This corresponds to the plastic deformation stage. When the curve reaches point C, the shear load gradually decreases. The load disappears at point D. This signifies the specimen breaking point. Point C refers to the maximum shear load that the specimen can bear. The shear strength of the substrate is 228.8 MPa (table 4). As shown in figure 9(b), the shear test curve of Cu0.25 alloy only has the elastic deformation stage. It means that the sample immediately fractures, while the shear load reaches the maximum. This typically shows brittle fracture characteristics. The shear strength is 79.6 MPa, only 34.7% of the substrate. In contrast, the plastic deformation zone is observed in the shear curves of Cu0.5, Cu0.75, and Cu1.0, which belongs to plastic fracture. The shear strength values are 176.6 MPa, 186.3 MPa, and 175.2 MPa, reaching 77.2%, 81.4%, and 76.6%, respectively, of the substrate. Clearly, the low bonding shear strength of Cu0.25 prevents the coating and substrate from forming a reliable connection. In order to analyze the shear fracture mechanism of the substrate and coating, the fracture morphology of the sample was observed by SEM.
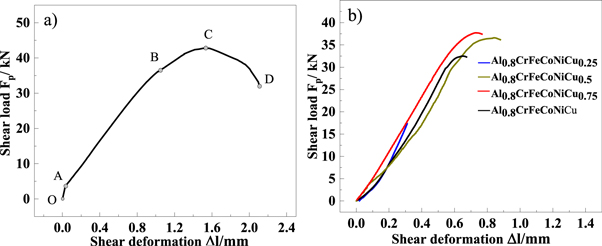
Figure 9. Shear deformation-shear load curve of the substrate and Al0.8CrFeCoNiCux HEA coatings. (a) Substrate, (b) Al0.8CrFeCoNiCux HEA coatings.
Download figure:
Standard image High-resolution imageTable 4. The results of shear test.
| Simple | Maximum shear load ( ) ) |
Shear area ( ) ) |
Shear strength ( ) ) |
|---|---|---|---|
| Substrate | 43.1 | 188.4 | 228.8 |
| Al0.8CrFeCoNiCu0.25 | 17.3 | 217.2 | 79.6 |
| Al0.8CrFeCoNiCu0. 5 | 36.3 | 205.9 | 176.2 |
| Al0.8CrFeCoNiCu0.75 | 37.6 | 204.7 | 183.6 |
| Al0.8CrFeCoNiCu | 32.8 | 187.1 | 175.2 |
Figure 10 shows the fracture SEM of the substrate. It can be seen that there are many deep dimples on the fractured surface. Further observation shows that the dimples are parabolic and are pulled along the direction of the shear force, and fracture exhibits the characteristics of a typical ductile fracture.
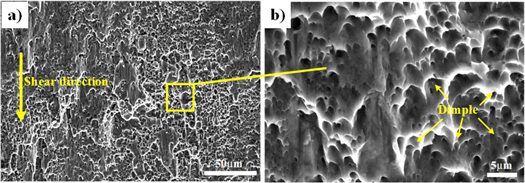
Figure 10. The shear fracture surface of the substrate. (a) Low-power morphology, (b) High-power morphology.
Download figure:
Standard image High-resolution imageFigure 11 shows the shear morphology of Cu0.25 alloy. Figure 11(a) shows the shear section morphology transverse in the scanning direction of the Cu0.25 alloy. It can be observed that the cladding layer is broken at the bottom. Figure 11(b) shows the fracture surface of Cu0.25 alloy, composed of irregular cleavage planes. The cleavage plane is the crystalline plane with the lowest surface energy. Therefore, when the shear stress reaches a certain value, the initial crack can rapidly propagate along the cleavage plane, which is a brittle fracture.

Figure 11. Shear morphology of Cu0.25 alloy. (a) Fracture cross section, (b) Fracture surface.
Download figure:
Standard image High-resolution imageFigure 12 shows the shear morphology of Cu0.5 alloy. Figure 12(a) shows the shear section morphology transverse in the scanning direction of the Cu0.5 alloy. As shown in figures 10(a) and (b), the Cu0.5 alloy fractured at the heat-affected zone (HAZ). Figures 10(c) and (b) show that the fracture surface of the Cu0.25 alloy was mainly composed of slip band due to the pressing of the shear blade and parabolic dimple. This belongs to a ductile fracture. The EDS results show that the Al content on the fracture surface reached 91.85%. This further confirmed that the fracture of the coating occurred in the HAZ. According to the analysis above, it can be seen that there are many tough FCC phases in Cu0.5 alloy. When the shear force acts on the bottom of the coating, the coating can produce a degree of plastic deformation. However, in the case of the HAZ, it can still retain some properties of the substrate after cyclic thermal action. But the change in microstructure makes it the weakest region in the shearing process. This results in the HAZ to easily break after a certain plastic deformation. It has also been proved that the shear strength of the Cu0.5 HEA coating is higher than that of the HAZ. The shear strength values indicate that the fracture mechanism is similar when the Cu content is between 0.5 and 1, so the same discussion applies to Cu0.75 and Cu1.0 alloys as well. The above analysis shows that when the Cu atomic ratio is between 0.5 and 1, the Al0.8CrFeCoNiCux HAZ coating can ensure higher bonding performance with the substrate.

Figure 12. Fracture morphology of Cu0.5. (a) Fracture cross section, (b) Local magnification of (a), (c) Low-power fracture surface, (d) High-power fracture surface.
Download figure:
Standard image High-resolution image3.5. Wear test
Figure 13 shows the friction coefficient curve of the substrate and Al0.8CrFeCoNiCux (x = 0.5, 0.75, 1) HEA coating. There is no curve for the Cu0 and Cu0.25 alloys because the poor forming quality of Cu0 alloy, as shown in figure 6(i), and low bonding performance of Cu0.25 alloy, as shown in table 4, make them less valuable. It can be observed that the friction coefficient of each sample shows a tendency to decline with the increase in wear time. The friction coefficient of Al0.8CrFeCoNiCux HEA coatings was clearly lower than that of the substrate. With the increase of Cu content, the friction coefficient of Al0.8CrFeCoNiCux increases. In the wear test, the material undergoes different wear states: the breaking-in wear stage, the stable wear stage, and the severe wear stage [31], so that the friction coefficient gradually decreases. The friction coefficient of Al0.8CrFeCoNiCux alloy is inversely proportional to the Cu content, as the addition of Cu increases the content of the softer FCC phase.
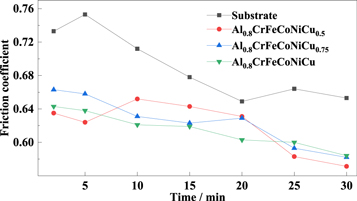
Figure 13. Friction coefficient curves of Al0.8CrFeCoNiCux HEA coatings and substrate.
Download figure:
Standard image High-resolution imageTable 5 shows wear rate calculation results of Al0.8CrFeCoNiCux HEA coating and substrate, where the wear rate is calculated according to formula (2). Figure 14 shows the hardness and the wear rate curves of Al0.8CrFeCoNiCux HEA coating. The wear rate of Cu0.5 (1.19 × 10⁻⁵ mm3 N−1m−1), Cu0.75 (1.41 × 10⁻⁵ mm3 N−1m−1), and Cu1.0 (1.9 × 10⁻⁵ mm3 N−1m−1) alloys is only 3.4%, 4.02%, and 5.42%, respectively, of the substrate (3.5 × 10⁻⁴ mm3 Nm−1). The lower wear rate means that the material has a higher abrasion resistance. Therefore, the increase in Cu content reduces the wear resistance of Al0.8CrFeCoNiCux HEA coating. But the wear resistance of Al0.8CrFeCoNiCux HEA coating is still much better than that of aluminum. The FCC phase increases with the increase of Cu, which weakens the ability of the material to resist plastic deformation, thus reducing the wear resistance of Al0.8CrFeCoNiCux HEA coating. Notably, the effect of Cu on the wear rate of Al0.8CrFeCoNiCux HEA coating is opposite to that of hardness, which is in accordance with the Archard equation [32]. It is also confirmed that the brittleness of the Al0.8CrFeCoNiCux HEA alloy is small, and no large-scale abrasive particles are formed during the wear process.
Table 5. Wear rate calculation results.
| Alloys | Length (mm) | Width (mm) | Wear rate(mm3/Nm) |
|---|---|---|---|
| Substrate | 7 | 14 | 3.50 × 10⁻⁴ |
| Al0.8CrFeCoNiCu0.5 | 6.72 | 4.82 | 1.19 × 10⁻⁵ |
| Al0.8CrFeCoNiCu0.75 | 7 | 5.01 | 1.41 × 10⁻⁵ |
| Al0.8CrFeCoNiCu | 7 | 5.52 | 1.9 × 10⁻⁵ |

Figure 14. Wear rate and Vickers hardness of Al0.8CrFeCoNiCux HEA coatings and substrate.
Download figure:
Standard image High-resolution imageFigure 15 shows the wear surface and of the substrate and Al0.8CrFeCoNiCux HEA coating. As shown in figures 15(a) and (b), wear morphology of aluminum alloy is that of a stepped shape. Along the direction of friction, a serious plastic deformation and elongated dimple appear, indicating that delamination fracture and serious adhesion wear occurred during the wear process. As shown in figure 15(b), there are scratches, spallings, and some amount of fine abrasive particles on the worn surface of Cu0.5 alloy. The wear characteristics are abrasive and adhesive wear. As shown in figures 15(c) and (d), there are large areas of spalling, long and wide scratches on the surface of Cu0.75 and Cu1.0 alloys, and the wear mechanism is severe adhesive and abrasive wear.
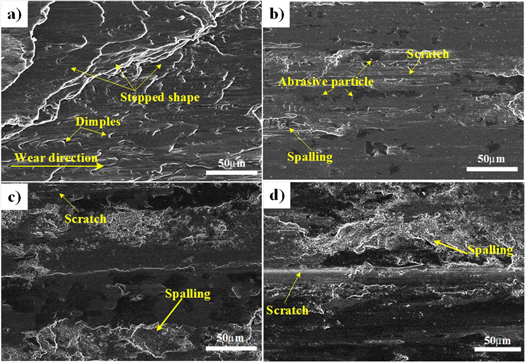
Figure 15. Wear surface of Al0.8CrFeCoNiCux HEA coatings and substrate. (a) Substrate, (b) x = 0.5, (c) x = 0.75, (d) x = 1.0.
Download figure:
Standard image High-resolution imageCompared with the substrate, the wear surface of the HEAs is smoother and more paved, and the degree of plastic deformation is smaller. This results from the matrix phase of HEAs being composed of hard BCC structure, which effectively hindered the micro-pitching in and micro-cutting from the asperities of GCr15 steel ring. Instead of flaky spalling on the surface of HEA, the wear surface of the substrate undergoes delamination fracture, and abrasive particles were not found. This is attributable to the aluminum alloy having a stronger ductility and more uniform wear resistance across its surface region. At wear initialization, the materials near the initial crack tend to elongate, forming thin areas, rather than propagate along the track of the crack and fall off. As the wear continues, more thin areas formed. Under cyclic shear stress, cracks with adjacent thin areas converge, causing the entire elongated piece to break altogether. After that, the newly generated surface repeats the above process. The wear surface of the substrate forms a stepped shape. Furthermore, as the second phase of the aluminum alloy has lower hardness and fewer quantities, the conditions suitable for forming abrasive particles are reduced. Therefore, the abrasive wear is not evident.
As for Al0.8CrFeCoNiCux HEA coatings, the FCC and BCC phases are formed. The two have large differences in resistance to deformation. Consequently, the wear resistance of various regions on the wear surface is different. After the initial cracks are formed, the cracks expectedly propagate along the weak regions of the material. After a certain stress cycle, the material falls off along the propagation path of the crack, and the surface forms a piece like peeling.
Comparing wear resistances of Al0.8CrFeCoNiCux HEAs at different Cu contents, the increase in Cu content aggravates the degree of wear. On the one hand, Cu0.75 and Cu1.0 alloys have more FCC phase than the Cu0.5 alloy. They have a larger force-sensitive area, resulting in the Cu0.75 and Cu1.0 alloy surfaces to form large spalling area during the wear process. On the other hand, the increase in the FCC phase consumes the forming elements of the B2 phase, as it is a hard phase. The B2 phase can hinder the continuous expansion of scratches or furrows, when the asperities of the GCr15 steel ring cuts into the softer region of the HEA alloy. Therefore, the scratches on the surface of Cu0.5 alloy, which has more B2 phase, are narrower and shorter.
Although the addition of Cu reduces the wear resistance of Al0.8CrFeCoNiCux HEA coating, it is still significantly higher than that of the aluminum alloy through the comprehensive study of friction coefficient, wear rate, and wear morphology.
3.6. Corrosion resistance
Figure 16 shows the friction coefficient curve of the substrate and Al0.8CrFeCoNiCux (x = 0.5, 0.75, 1) HEA coating. There is no curve for the Cu0 and Cu0.25 alloys because the poor forming quality of Cu0 alloy, as shown in figure 6(i), and low bonding performance of Cu0.25 alloy, as shown in table 4, make them less valuable. The appearance of passive anodic regions represents the formation of passivation film on the surface of the working electrode (WE) with the electrochemical corrosion process. The passivation film can slow down the corrosion of the WE surface by the electrolyte solution. But the passivation region range was not observed in the Cu1.0 alloy, indicating that the WE only has a dissolution process in the electrolyte solution [33].

Figure 16. Polarization curves of Al0.8CrFeCoNiCux HEA coatings (x = 0.5, 0.75, 1.0).
Download figure:
Standard image High-resolution imageTable 6 shows the electrochemical parameters of the Al0.8CrFeCoNiCux coating after the polarization test. The corrosion resistance of the substrate was reported earlier [20]. From the classical electrochemical theory, the free corrosion potential ( ) only represents the thermodynamic trend of the WE during the corrosion process, while the free corrosion density (
 ) is caused by the dissolution of the WE.
  is determined in the linear part of the polarization curve by deducting Tafel extrapolation, where the polarization resistance (
 ) is calculated according to formula (6). Therefore,
  is the most important index for evaluating the corrosion resistance of WE [34–36]. According to table 6, as x increases
  gradually increases, indicating that Cu reduces the corrosion resistance of Al0.8CrFeCoNiCux HEAs. However,
  of the Cu1.0 alloy is still smaller than that of the substrate, indicating that the Al0.8CrFeCoNiCux HEA coating has better corrosion resistance in 0.1 mol l−1 H2SO4 solution. Moreover, It can be seen from the table 6 that
  decreases with increasing of Cu, confirming that the addition of Cu accelerates the corrosion rate of the Al0.8CrFeCoNiCux alloy [37]. Also, the lower
  of substrate compared with that of Al0.8CrFeCoNiCux HEA coating also proves that the corrosion rate of the substrate is the fastest in 0.1 mol l−1 H2SO4 solution.
Table 6. The Ecorr and Icorr of Al0.8CrFeCoNiCux HEA coatings and substrate in 0.1 mol l−1 H2SO4 solution.
| Samples |
 (V) (V) |
 (μA·cm−2) (μA·cm−2) |
 (dec/V) (dec/V) |
 (dec/V ) (dec/V ) |
 (Ω·cm−2) (Ω·cm−2) |
|---|---|---|---|---|---|
| Al0.8CrFeCoNiCu0.5 | −0.384 | 25.62 | 21.62 | 23.94 | 1.93 × 10⁶ |
| Al0.8CrFeCoNiCu0.75 | −0.462 | 42.85 | 19.74 | 20.58 | 1.02 × 10⁶ |
| Al0.8CrFeCoNiCu | −0.502 | 49.35 | 17.54 | 17.52 | 7.71 × 10⁵ |
| Substrate [21] | −0.596 | 80.46 | 9.96 | 16.56 | 3.35 × 10⁵ |
Figure 17 shows the corrosion morphology of the substrate and Al0.8CrFeCoNiCux HEA after the polarization test. The substrate surface morphology has been completely corroded (figure 17(a)), with a corrosive degree more serious than that of other samples. The corrosion type is general corrosion. Cu0.5 alloy undergoes pitting and intergranular corrosion (figure 17(b)). Each region on the Cu0.75 surface has different corrosion characteristics. The microstructural fragmentation and block areas can be observed in figure 17(c). The corrosion degree is more serious than that of Cu0.5. Figure 18 shows EDS results of the Cu0.75 alloy, the contents of Cr and O are higher than other elements in block areas, indicating that the block areas are Cr-rich passivation films. The content of Cu in each region is low, which proves that Cu easily dissolves in electrolyte solution in the process of electrochemical reaction and promotes corrosion. Also, Cr still has a higher content on the corroded surface , which also proves that Cr is a corrosion-resistant element . Compared with Cu0.5 alloy, passivation film was observed on the corrosion surface of Cu0.75 alloy. The reason behind that is as follows: there are more Cu-rich regions at the grain boundary in Cu0.75 alloy that increases the corrosion prone area. Therefore, the corrosion solution is easier to penetrate each region of the alloy along the intergranular direction in the electrode reaction. While corrosion solution penetrates the region covered by the passivation film, it can react with each other and form a new layer under the passivation film. This is possible due to the limitation on the number of easily corrosive phases. The reaction is insufficient, resulting in a passive film that cannot fall off. As shown in figure 15(d), the corrosion degree of Cu1.0 alloy is much higher than that of Cu0.5 and Cu0.75, mainly due to the increase of Cu-rich phase, leading to the increase in the area of intergranular corrosion, causing the contact area between the corrosion solution and the alloy surface to continuously increase, which accelerates the corrosion rate of the alloy in the electrode reaction. The above results are consistent with the polarization curve.

Figure 17. Surface morphologies of the substrate and Al0.8CrFeCoNiCux HEA coatings. (a) Substrate, (b) x = 0.5, (c) x = 0.75, (d) x = 1.0.
Download figure:
Standard image High-resolution image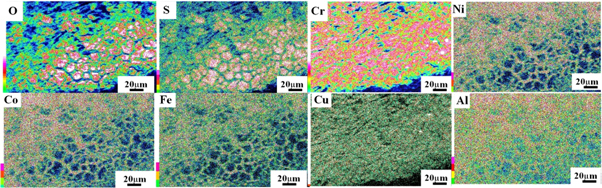
Figure 18. EDS map of Cu0.75 alloy.
Download figure:
Standard image High-resolution image
In summary, the increase in Cu content will improve the forming quality and reduce the hardness, wear resistance, and corrosion resistance of the Al0.8CrFeCoNiCuxHEA coating, but it still has a significant improvement over the surface properties of aluminum alloys. At 0.5 ≤ x ≤ 1, Al0.8CrFeCoNiCux HEA can be used as coatings to improve the surface properties of aluminum alloys, especially Al0.8CrFeCoNiCu0.5 HEA.
4. Conclusion
In order to prepare a coating with excellent properties on the aluminum alloy surface, the microstructure and properties of Al0.8CrFeCoNiCux HEA coatings with different Cu content were systematically studied. The conclusions are as follows:
- (1)With the increase of Cu content, the phase structure of Al0.8CrFeCoNiCux HEA changes from BCC1 and BCC2 phases to BCC1, BCC2, and FCC1 phases. Cu promotes the formation of FCC phase. The addition of Cu reduces the cracking sensitivity of Al0.8CrFeCoNiCux HEA coatings. When x = 0.25, the intercrystal of Al0.8CrFeCoNiCu0.25 HEA has a discrete distribution of Cu-rich FCC. With the increase of x, Cu-rich FCC continuously grows at the grain boundary.
- (2)The addition of Cu decreases the hardness of Al0.8CrFeCoNiCux HEA coatings. But compared to aluminum alloy, Al0.8CrFeCoNiCux HEA still exhibits higher hardness, mainly due to the formation of many BCC phases and lattice distortion effects. The bonding strength of Cu0.25 is 79.6 MPa, only 34.7% of the substrate. Breaking occurs at the bottom of the coating, and the failure mechanism is cleavage fracture. The bonding shear strength of Cu0.5, Cu0.75, and Cu1.0 reaches 77.2%, 81.4%, and 76.6%, respectively, of the substrate, while the breaking occurs in the HAZ.
- (3)The change in Cu content affects the wear resistance and hardness of the Al0.8CrFeCoNiCux HEA coating. The wear rates of Cu0.5, Cu0.75, and Cu1.0 alloys are 1.19 × 10⁻⁵ mm3 N−1m−1, 1.41 × 10⁻⁵ mm3 N−1m−1, and 1.9 × 10⁻⁵ mm3 N−1m−1, respectively. The wear mechanism of the substrate is that of delamination fracture and serious adhesion wear. The wear mechanisms of Cu0.5, Cu0.75, and Cu1.0 HEA coatings are adhesive and abrasive wear.
- (4)Cu0.5 alloy exhibits the best corrosion resistance. The corrosion behavior is that of pitting and intergranular corrosion. The increase in Cu content reduces the corrosion resistance of the alloy, but the corrosion resistance of the Al0.8CrFeCoNiCux HEA is still higher than that of the substrate.
Clearly, Cu0.5 alloy has a good bonding shear strength, better hardness, wear resistance, and corrosion resistance and is more suitable for laser-modified coating on the surface of the aluminum alloy.
Acknowledgments
The authors are also grateful for the financial aids from the Equipment pre-research field Foundation of China (Grant No. JZX7Y20190263073101 ).
Disclosure statement
No potential conflict of interest was reported by the authors.