
Abstract
In this present work, the conduction properties of biopolymer electrolytes (BEs) based alginate incorporation with LiNO3 was studied. FTIR analysis showed there is complexation occurred when incorporation with LiNO3 via COO− group of alginate. The interaction between alginate and LiNO3 shown an improvement in ionic conductivity of BEs where was increased from 3.24 × 10⁻⁷ S cm−1 for un-doped sample and achieved optimum value at 1.14 × 10⁻⁴ S cm−1 for sample containing with 15 wt. % LiNO3. The prepared samples shown that it has thermally assisted when the temperature is increased and shown Arrhenius behavior. Deconvolution approached revealed that the present ionic conduction of BEs influenced by ionic mobility and diffusion coefficient.
Export citation and abstract BibTeX RIS

Original content from this work may be used under the terms of the Creative Commons Attribution 3.0 licence. Any further distribution of this work must maintain attribution to the author(s) and the title of the work, journal citation and DOI.
1. Introduction
In recent days, synthetic polymer become main worldwide focus in electrolyte study due to good performance, high energy density, flexibility, and long life span in electrochemical device [1]. However, synthetic polymer itself contributed environmental pollution to the Earth. For example, petroleum derived plastic are not biodegradable, they do not go through microbial degradation and just dispersed to the ecosystem. The disadvantages of using the synthetic polymer in electrochemical device are non-environmental friendly, high cost production, less permeability and harmful to use [2]. Even though it provides excellent rechargeable-high density of energy that is portable, an issue using non-degradable in the device has definitely cause damage to the environment due to toxic monomer release [3]. It became an important issue to develop good protonic conducting polymer electrolyte with good aspect performance. Therefore, in order to rectify this problem, the renewable resources have been drawn in electrochemical industry, which can degrade to environment easily without generating harmful and toxic residues [4].
Biopolymer become main focusing area in industry to build green world in order to avoid all the profanation environment and energy disaster. For example, the biodegradable polymer already been used in industry of packaging, pharmaceutical, agriculture, tissue engineering, thickening agent, and biomedical. Biopolymer is suitable to been focused widely in electrochemical industry due to great ability to degrade in the long term which reduces the environmental effect [5]. Biopolymer materials are found to be easy undergoing degradation and compostable under normal environment condition; which showed that biopolymers more environmental friendly compared to synthetic polymers.
In the present work, alginate was chosen as host polymer due to anionic structure of polysaccharides composed of linear (1 − >4) β-D-mannuronic acid (M) and α-L-guluronic acid (G) residues where capable of ionically crosslinking in the presence of cations [6]. Moreover, alginate polymer exhibits standard film properties like non-toxicity, good solubility, high mechanical strength, and biocompatible [7]. Due to advantages such as no-leakage of electrolyte, flexible geometry, higher energy density, and improved safety hazards in Li+ ions batteries [8, 9]. The typical technique for obtaining favorable conduction properties of polymer electrolytes (PEs) is by incorporating with alkali metal salts (including lithium salts). The development of lithium-ion based PEs has shown great attention due to their stability in energy storage application [10]. The weak coordination in presence of salt LiNO3 makes possible incorporation of Li+ ion with the polar group of alginate polymer, which promotes charge carrier to polymer matrix and increase the ionic conduction [11]. This type of lithium salt (LiNO3) might provide good complexation with polymer backbone due to its electronegativity and delocalization of charge [12]. The aim of this research is to study the conduction properties of based on effect of LiNO3 in alginate as biopolymer electrolytes (BEs) system. The prepared sample of BEs system with different composition of LiNO3 were investigated by using Fourier Transform Infrared (FTIR) spectroscopy and Electrical Impedance Spectroscopy (EIS). In addition, the determination of ionic transport properties of present BEs via FTIR vibrational effect which was evaluated based deconvolution approach provides considerable new insights into the conduction of ions that dissociate in the BEs system.
2. Experimental
2.1. Preparation of biopolymer electrolytes
In this work, alginate (Shaanxi Orient Co.) and LiNO3 (Sigma Aldrich Co.) were used for preparation as biopolymer electrolytes (BEs) film. By employing solution-casting technique, 2 g of alginate was dissolved in distilled water. Then, different composition of LiNO3 were added into the alginate solution and stirred until became homogenous solution. A homogenous solution was casted into Petri dish and left dry in the oven at 60 °C for about 24 h. The sample then was further up drying in desiccators filled with silica gel. The composition of LiNO3 and designation of sample for BEs system are tabulated in table 1.
Table 1. List of samples with their compositions respectively.
| Designation | Weight percentage (wt%) |
|---|---|
| ALNO-0 | 0 |
| ALNO-1 | 5 |
| ALNO-2 | 10 |
| ALNO-3 | 15 |
| ALNO-4 | 20 |
| ALNO-5 | 25 |
2.2. Characterization of biopolymer electrolytes
2.2.1. Fourier transform infrared spectroscopy (FTIR)
The complexation between alginate and LiNO3 in BEs system were identified by using fourier transform infrared (FTIR) spectroscopy and was recorded using Perkin Elmer Spectrum 100 equipped with an attenuated total reflection (ATR) accessory with a germanium crystal. The sample was tested with the wavenumber in the range of 700 cm−1 until 4000 cm−1 with spectra resolution of 2 cm−1.
2.2.2. Electrical impedance spectroscopy (EIS)
The ionic conduction of BEs system was analyzed using Electrical Impedance Spectroscopy (EIS). The present sample were cut into a suitable size and sandwiched between two stainless steel (SS) blocking electrodes with surface area is π cm2 [13]. The conductivity of prepared samples were performed using a HIOKI 3532–50 LCR Hi-Tester with frequency range from 50 Hz to 1 MHz. The ionic conductivity, σ of alginate-LiNO3 BEs system were calculated using equation:-

where, t (cm) is the thickness, A (cm2) is the electrode-electrolyte contact area and Rb (Ω) is bulk resistance of BEs system which can be extracted from Cole-Cole plot. The dielectric constant, εr (real part of complex permittivity) and loss, εi (imaginary part of complex permittivity) can be calculated based on the following equation:


Here Co = εoA/t is vacuum capacitance, εo is permittivity of free space, A is the area of electrode-electrolyte contact, t is the thickness of BEs system. The angular frequency ω is equal to ω = 2πf, where f is frequency of applied ac field. Zr is the real part of impedance and Zi is the imaginary part of impedance. The real, Mr and imaginary part, Mi of electrical modulus were calculated using the equation below:-


2.2.3. Transport parameter study
The transport properties of alginate-LiNO3 BEs system were analyzed via FTIR deconvolution. Deconvolution technique was performed using Gaussian-Lorentz function, which adapted from Origin Lab Pro 8.0 software. In this method, the FTIR peaks due to complexation of alginate and LiNO3 were selected based on dominant ionic movement. The area under the peaks was determined, and the free ions percentage (%) were calculated using the equation [14, 15]:

where Af is an area under the peak representing the free ions region, Ac is the total area under the peak representing the contact ions. The transports parameter such as number of mobile ions (η), ionic mobility (μ) and diffusion coefficient (D) were calculated following this equation [16, 17]:-

where:


where M is number of moles of dopant (LiNO3) used, NA is the Avogadro's constant (6.02 × 10²³ mol−1), Vtotal is total volume of BEs system, k is the Boltzmann constant (1.38 × 10⁻²³ J K−1), T is absolute temperature in Kelvin and e is electric charge (1.602 × 10⁻¹⁹ C).
3. Result and discussion
3.1. IR vibrational study
Figure 1 shows the FTIR spectra for alginate incorporate with various composition of LiNO3. Based on figure 1, it clearly can be seen there is crosslinking reaction between lone pair electrons from alginate and cation from LiNO3 at the groups of C–O–C, COO−, and –OH in the polymer matrix. The highlighted wavenumber which was believed the interaction has occurred between alginate and LiNO3 is presented in figure 2.
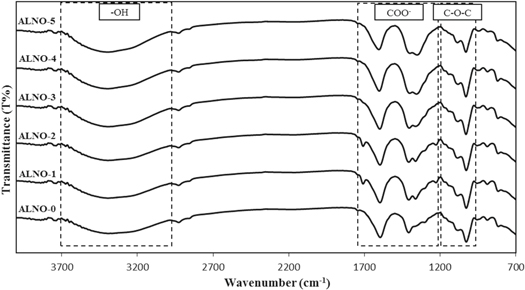
Figure 1. FTIR spectra of alginate-LiNO3 BEs system.
Download figure:
Standard image High-resolution image
Figure 2. Highlighted IR-spectra complexes of alginate-LiNO3 based BEs range.
Download figure:
Standard image High-resolution imageIn the present work, figure 2(a) denotes the ether group (C–O–C) of alginate-LiNO3 complexes in the region 900 to 1200 cm−1. The absorption peak of BEs system was slight shifting from 1027 cm−1 of ALNO-0 to 1030 cm−1 of ALNO-3 and remain unchanged until ALNO-5. This indicates the presence of high electronegativity atom (oxygen) from the ether group does not creates any opportunities for interaction occurred between alginate and lithium salt since the ether group form strong bonding in the polymer backbone.
Figure 2(b) depicts another significant peak of alginate-LiNO3 complexes between 1200 to 1800 cm−1 which attributed to symmetrical and asymmetrical of carboxylate anion, COO− [18]. It can be observed that the peak represent to COO− asymmetric stretching of pure alginate (ALNO-0) shifted to higher wavenumber, from 1596 to 1605 cm−1. It can be explained that with the increment of LiNO3 in BEs system, it will enhance the dissociation of Li+–NO3− where positively charged cations from ionic dopant will more attracted to negatively charged of electron pairs from alginate [19]. The changes in wavenumber revealed the complexes between alginate and LiNO3 via weak van der Waals attraction of dipole-dipole forces [20] and this would lead to affect the ionic conduction in BEs system. Besides, the Li+ from LiNO3 function as electrophile positive ion in order to interact with polar group of alginate (Li+...−O) [21]. On the other hand, the absorption peak for COO− symmetric stretching shifted to lower wavenumber from 1409 to 1400 cm−1 which confirms that the migration of Li+ to the coordinating site (oxygen) of COO− via electrostatic interaction in order to form (Li+...−OOC) [22]. It can be observed that there is appearance of new peak at 1362 cm−1 belongs to lithium and nitrate ion stretching which was due to addition of LiNO3 in polymer matrix. This new peak remain unchanged and similar observation was founded in Mobarak (2015) [23] work, where new appearance peak confirmed the presence of ion pairs (Li+ and NO3−) upon addition of lithium salt and would influences the ionic conductivity of polymer-salt complexes. However, this peak shifted to the lower wavenumber upon addition of salt until sample ALNO-5 and this might due to the aggregation of dopant, which lead to decreasing number of mobile ions; hence, might affect ionic conductivity of BEs system [24].
Meanwhile, figure 2(c) presents FTIR pattern for alginate-LiNO3 complexes in the range from 2800 to 3800 cm−1. The weak peak at 2928 cm−1 and strong absorption band at range 3000 to 3600 cm−1 were related to CH2 stretching and –OH stretching, respectively [25]. From ATR-FTIR analysis, it can be seen the addition of LiNO3 showed no effect on the intensity or shifting of peak at CH2 stretching. However, the absorption peak of –OH stretching band start to shift from 3368 cm−1 for ALNO-0 to higher wavenumber peak at 3390 cm−1 for ALNO-3 and remain unchanged until ALNO-5. According to Kadir et al (2018) [26], the shifted of polymer complexes to higher wavenumber indicates the dissociation of LiNO3 that lead to the interaction between cation and lone pair of electrons in oxygen atom of hydroxyl group; thus, it expected to increase the number of mobile ions and conductivity in BEs system. The summarization for all changes in functional group of BEs system are tabulated in table 2.
Table 2. Summary of IR peak in wavenumber for alginate-LiNO3 complexes as BEs system.
| Wavenumber of BEs system (cm−1) | |||||||
|---|---|---|---|---|---|---|---|
| Assignment | LiNO3 | ALNO-0 | ALNO-1 | ALNO-2 | ALNO-3 | ALNO-4 | ALNO-5 |
| Stretching of –OH | — | 3368 | 3393 | 3393 | 3396 | 3396 | 3396 |
| CH2 stretching | — | 2928 | 2928 | 2928 | 2928 | 2928 | 2928 |
| Asymmetry of COO– | — | 1596 | 1597 | 1597 | 1599 | 1602 | 1605 |
| Symmetry of COO– | — | 1409 | 1407 | 1407 | 1404 | 1401 | 1400 |
| NO3− stretching | 1403 | — | — | — | — | — | — |
| Li+ stretching | — | — | 1362 | 1362 | 1362 | 1356 | 1352 |
| C–O–C stretching | — | 1027 | 1028 | 1028 | 1030 | 1030 | 1030 |
3.2. Ionic conductivity study
According to Rani (2018) [27], impedance spectroscopy is a non-destructive and powerful technique to analyze the conduction properties of polymer electrolytes and their interfaces with electronically conducting electrodes. Figure 3 depicts the Cole-Cole and calculating fitted plots for alginate-LiNO3 BEs at ambient temperature. In the present work, the Cole-Cole plot for a blocking electrode consist of a semicircle and a spike, and only a tilted spike. Based on figure 3, the Cole-Cole plot for ALNO-1, ALNO-2, ALNO-4 and ALNO-5 showed the combination of a tilted semicircle with an inclined (tilted) spike. The semicircle in impedance plot can be represented by parallel combination of bulk resistance, Rb and CPE element with another CPE element in series due to tilted spike; therefore, it confirms the semiconducting behavior [28]. The values of Zr and Zi associated to electrical equivalent circuit (EEC) of tilted semicircle and spike can be expressed as:-


where R is bulk resistance, k1–1 is the bulk geometrical capacitance of BEs, k2–1 is the electrical double layer capacitance at the electrode/electrolyte interface during the impedance measurement. The p1 and p2 is the ratio of the angle between the diameter of the depressed semicircle from Zi axis, and p2 is the skew parameter that controls the degree of the tendency of the title spike from the real axis. From the Cole-Cole plots, the values of parameters k1 and k2 were obtained by trial and error method until the fitted points give a good fit to the experimental points. The Rb value is determined from the interception between semicircle arc and the tilted spike with the real axis [29]. The presence of high frequency arc and low frequency spike in the complex impedance plots may be attributed to the bulk conduction process and the accumulation of charges at the electrolyte–electrode (blocking electrode) interface [30]. Here, the depressed semicircle denotes the bulk material while the tilted spike represents the electrical double layer [31]. It can be observed that the incomplete semicircle curve begin to disappear at high frequency and left with only the tilted spike upon higher addition LiNO3. This phenomenon suggests that only the resistive component of the electrolyte prevails [32]. On the other hand, sample ALNO-3 shows the fully inclined spike in the impedance study. So, the values of Zr and Zi associated to EEC of only tilted spike can be expressed as:-


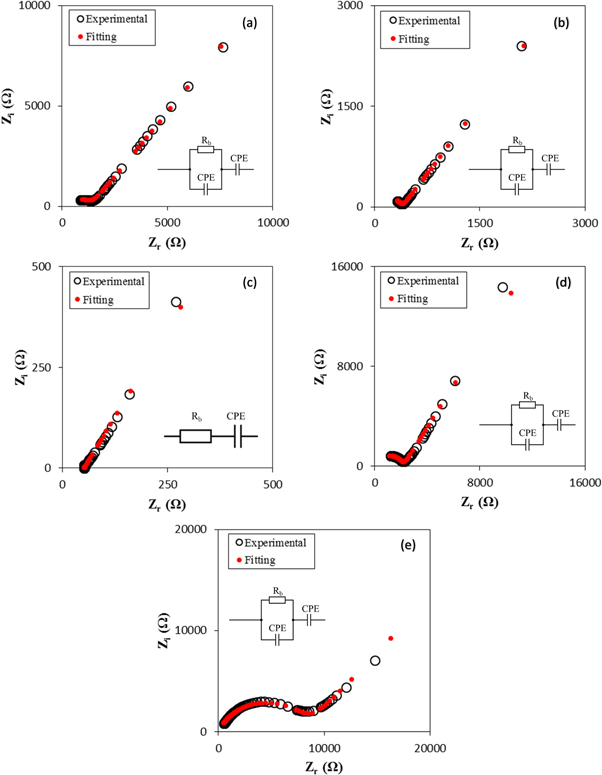
Figure 3. Cole-Cole plot with equivalent circuit for sample (a) ALNO-1, (b) ALNO-2, (c) ALNO-3, (d) ALNO-4, and (e) ALNO-5 of BEs system at ambient temperature.
Download figure:
Standard image High-resolution imageSince the spike in this study did not begin at the origin, the equivalent circuit is consist of a resistor and constant phase element (CPE) in series connection. CPE for the spike is due to the double-layer capacity of an inhomogeneous electrode surface [33]. A resistor in series with a CPE can represent the plot that takes the shape of a spike. Based on figure 3(c), ALNO-3 showed fully inclined spike with disappearance of incomplete semicircle and shifted to lower value attributable to dissociation of LiNO3, which enables the free ions to participate in conduction process [34]. The calculated values of theoretical fitting parameter are presented in table 3. It clearly can be seen that the Rb value for ALNO-3 exhibits the minimum value of 51 Ω indicates that the sample becomes more capacitive than resistive [35]. Therefore, the fully inclined spike of sample ALNO-3 were expected to have higher conductivity value in BEs system.
Table 3. The t, Rb and fitting parameters (p1, k1, p2, and k2) of BEs system.
| Sample | Thickness, t (cm) | Rb (Ω) | p1 | k1 (F−1) | p2 | k2(F−1) |
|---|---|---|---|---|---|---|
| ALNO-1 | 0.0085 | 1369 | 0.58 | 21,850,000 | 0.58 | 533,500 |
| ALNO-2 | 0.0105 | 390 | 0.72 | 94,300,000 | 0.60 | 93,950 |
| ALNO-3 | 0.0170 | 51 | — | — | 0.67 | 21,593 |
| ALNO-4 | 0.0178 | 2164 | 0.81 | 720,000,000 | 0.66 | 719,500 |
| ALNO-5 | 0.0131 | 8550 | 0.73 | 94,990,000 | 0.54 | 271,500 |
The ionic conductivity value for entire sample of alginate-LiNO3 BEs system at ambient temperature is presented in figure 4. The remarkable effect with incorporation of LiNO3 enhanced the ionic conductivity by three order of magnitude until achieved optimum value at 1.10 × 10⁻⁴ S cm−1 for sample containing 15 wt% of LiNO3 (ALNO-3). Alves et al (2018) [36] proclaim that ionic conductivity mainly affected by three factor which are (i) types of cation and anion, (ii) salt composition, and (iii) temperature. Generally, increment of LiNO3 in BEs system cause the ionic conductivity to improved which was due to the concentration of mobile charge carriers from Li+. This also can be proven as discussed earlier in FTIR analysis, increment addition of LiNO3 provide more cation to attracted with potential coordinating of alginate thus, the ionic conductivity will affected. It shows that addition above 15 wt. % of LiNO3 lead to decreasing in ionic conductivity of BEs and this might due to the aggregation of ion cluster appeared at high level and increase the formation of overcrowded ions in system.
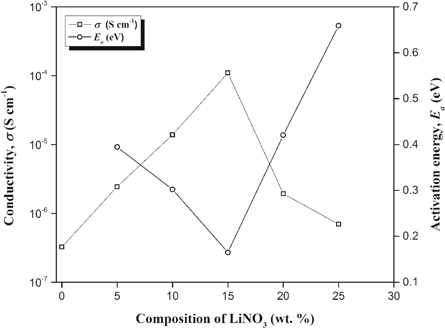
Figure 4. Ionic conductivity and activation energy for alginate-LiNO3 BEs system at ambient temperature.
Download figure:
Standard image High-resolution imageThe ionic conductivity for entire sample at various are presented in figure 5. It can been observed that the ionic conductivity increased with increasing temperature for entire sample. This was due to the formation of free volume provided by alginate from their chain and created unoccupied spaces for migration of ions [37]. The enhancement of ionic conductivity is also attributed to overall mobility of ion and polymer which determined by the free volume; hence, it will leads to the increased in ionic and segmental mobility that will assist ion transport and practically compensate the retarding effect of ion clouds [38]. The segmental motion of the polymer chain and dissociation of the dopant increased due to vibrational energy occurred in the space around its own volume of which believed to push against the hydrostatic pressure imposed by its neighboring atoms [39]. Therefore, the particles move unreservedly in the free volume around the polymer chain and lead to the enhancement of the ionic conductivity value [40]. Figure 6 depicts the log conductivity versus 1000/T for various BEs sample at the temperature range from 303 K to 348 K. It can be seen that all regression values are close to unity suggesting that the points lie on fitting lines, so the variations of conductivity with temperature is obey with the Arrhenius rule [41]:-

where Ea is the activation energy, σ is the ionic conductivity of BEs system, σ0 is the pre-exponential factor, kb is the Boltzmann constant, and T is the temperature in Kelvin. Figure 4 shows the activation energy for various composition of LiNO3 at ambient temperature. The Ea was found to be decreases as the ionic conductivity of BEs increased due to higher flexibility of the alginate backbone based on enhancement of segmental mobility of its chains [42]. Therefore, it requires low activation energy to facilitates the motion of ions in the biopolymer network [43].

Figure 5. Ionic conductivity of alginate-LiNO3 BEs system at different temperature.
Download figure:
Standard image High-resolution image
Figure 6. Arrhenius plot for alginate-LiNO3 BEs system.
Download figure:
Standard image High-resolution image3.3. Electrical study
Dielectric properties provide an important insight regarding on conduction complexes behavior in BEs system. The dielectric properties may vary in different types of polymer electrolyte system attributed to several factors including frequency of applied electrical field, temperature, structural characteristics or other external factors [44]. The variation of εr and εi as function of frequency at ambient temperature are shown in figures 7(a) and (b) respectively.

Figure 7. (a) Dielectric constant and (b) dielectric loss of alginate-LiNO3 BEs system at ambient temperature.
Download figure:
Standard image High-resolution imageIt is clear can be seen from both figures where the value of εr and εi are higher at low frequency region due to presence of polarization effect which confirms non-Debye dependence [45]. In this work, both values of εr and εi were found to be higher for sample ALNO-3 and this attributable to increment in charge carrier concentration which lead the ionic conductivity to achieved optimum value [11]. At high frequencies, it can be observed both dielectric profiles are decreased and reached plateau conditon for entire samples. This mechanism might be due to the higher periodic reversal of the applied field where there is no charge build up at the interface between the sample and the electrode (space-charge) and also no excess ion diffusion in the path of field [46, 47].
Figure 8 depicts the temperature dependence of εr and εi for most conducting sample in BEs system (ALNO-3). It can be observed that both εr and εi of BEs system increased with increasing of temperature and this is due to the polarization of the mobile ions. As the temperature increased, degree of LiNO3 dissociation and re-dissociation of ion aggregates increases due to higher content of free ions or charge carrier density; thus, it will lead to enhancement of ionic conductivity with temperature [46]. Table 4 showed the dielectric part from the literature as comparison for the present highest conducting BEs system. Its revealed that the present BEs is comparable with other types of polymer electrolytes system which implies their capability to stored a charge when apply in energy devices. A further investigation of the dielectric behavior can be more successfully achieved using a modulus formalism analysis.

Figure 8. (a) Dielectric constant and (b) dielectric loss for ALNO-3 at different temperature.
Download figure:
Standard image High-resolution imageTable 4. Dielectric part for various BEs system.
| Polymer electrolytes | εr (303 K) at 10 000 Hz | εi (303 K) at 10 000 Hz | References |
|---|---|---|---|
| Chitosan/PVA-LiClO4 | ∼3.5 | ∼ 6.75 | [48] |
| Starch/chitosan-NH4Cl | ∼50 | ∼90 | [49] |
| Cellulose acetate-LiNO3 | ∼500 | ∼900 | [11] |
| Pectin-LiCl | ∼1800 | ∼1200 | [50] |
| Alginate-LiNO3 | ∼436 | ∼1550 | Present work |
The real and imaginary part of modulus spectrum for ALNO-3 exhibited as shown in figure 9. Based on figure 9, both Mr and Mi values are increased at higher frequency region without any relaxation peak was observed. Increasing value for both modulus part is due to the distribution of relaxation processes over a range of frequencies [51]. In addition, a long tail at low frequencies depicts that there might be a large capacitance associated with the electrodes polarization effects which further confirms non-Debye behavior in the samples [52, 53]. According to Bakar et al (2015) [54], modulus part increase as frequency increase due to bulk polarization which can be differentiate into two elements; (i) transferred by electron and (ii) avalanche transit-time. In the present work, it is believed the bulk effects appeared in the complexes due to transferred by electron between host polymer and ionic dopant.

Figure 9. (a) Real modulus and (b) imaginary modulus of ALNO-3 at different temperature.
Download figure:
Standard image High-resolution image3.4. Transport properties study
Figure 10 depicts the FTIR deconvolution for various composition LiNO3. According to Ren et al (2016) [55], strong absorption peaks at ∼1400 cm−1 denotes the anion vibration mode of NO3− which proved the IR active in FTIR study. Arya et al (2019) [56] also reported that NO3− mode confirms the D3h point group and the fundamental modes proved that peak at 1380 cm−1 were correspond to asymmetric stretching of NO3− for LiNO3. Therefore, the band of NO3− showed great importance for the investigation of ions dissociation in BEs system. In this work, the region between 1200 cm−1 to 1500 cm−1 were selected due to obvious ions interaction occurred in alginate-LiNO3. Thus, the peak located at ∼1400 cm−1 of LiNO3 is believed due to the free anion (resulting from dissociation of ions) while peak located at ∼1350 cm−1 and ∼1420 cm−1 were attributed to contact ions (due to association of ions) which can be ion pairs or ion aggregates [57]. Figure 11 presents the percentage of free ions and the contact ions of alginate-LiNO3 BEs system.
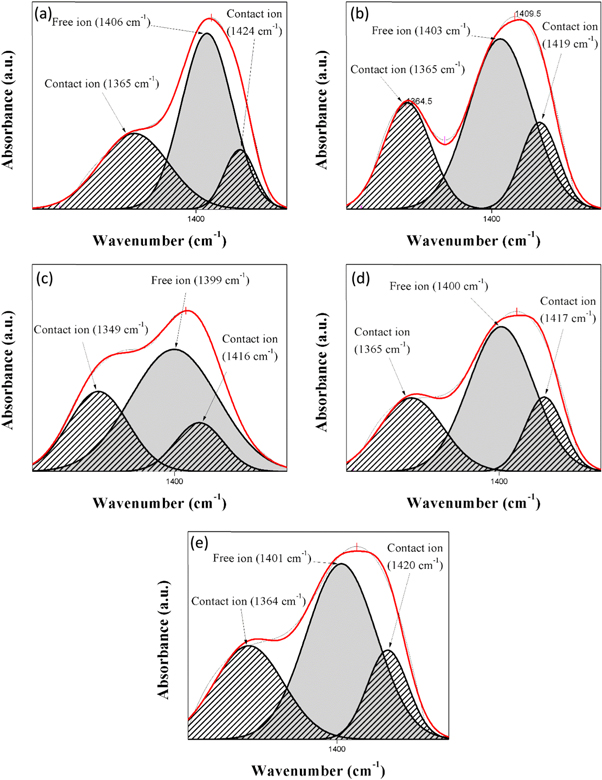
Figure 10. The IR deconvolution spectrum for samples (a) ALNO-1, (b) ALNO-2, (c) ALNO-3, (d) ALNO-4, and (e) ALNO-5 of BEs system.
Download figure:
Standard image High-resolution image
Figure 11. Free ions and contact ions of alginate-LiNO3 BEs system.
Download figure:
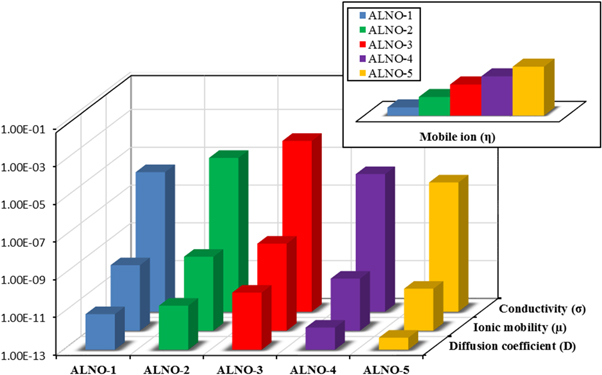
Standard image High-resolution imageIt can be observed that the percentage of free ions increases and the percentage of contact ions decreases when LiNO3 was added. The highest percentage of free ions was obtained for the optimum ionic conductivity of BEs system. This implies that more ions are dissociated and would provide with balanced interactions between alginate and LiNO3; thus, assisting more ion conduction in BEs system [58]. The calculated value of the ionic mobility (μ) and the diffusion coefficient number (D) and the number of mobile ions (η) of the BEs were depicted in figure 12.
Figure 12. Transport parameters and conductivity of alginate-LiNO3 BEs system.
Download figure:
Standard image High-resolution image
Based on figure 12, the value μ and D were found to be similar with the trend of ionic conductivity where it rise sharply at ALNO-3 with maximum value of 4.07 × 10⁻⁹ cm2 V−1 s−1 and 1.06 × 10⁻¹⁰ cm2 s−1, respectively. In the present work, addition of LiNO3 in alginate definite the conjecture in FTIR study where the diffusion of Li+ from LiNO3 and migrate to lone pair of COO− of alginate contain with huge amount of ions and also faster rate. The μ and D will lead to the enhancement of ionic conductivity where it need lesser activation energy to hopping in the backbone of alginate [59]. Referring to figure 12, it can be inferred that the number of η increased linearly upon addition higher composition of LiNO3 and this was attributed to the dissociation of dopant which lead to the overcrowding of mobile ions that obstruct the pathway for migration process; thus, the value of μ and D decreased [60].
4. Conclusion
In the present work, a favorable measured data of biopolymer electrolytes (BEs) based on alginate incorporate with lithium nitrate (LiNO3) have been successfully prepared via solution casting technique. From FTIR analysis, there are presence of new peak appeared near at symmetric COO− (∼1360 cm−1) of alginate indicates there are interaction between polymer matrix and ionic dopant. The ionic conductivity of alginate-LiNO3 at ambient temperature exhibits optimum value at 1.10 × 10⁻⁴ S cm−1 for 15 wt. % of LiNO3 (ALNO-3). The temperature dependence of conductivity was found to obey the Arrhenius behavior. The dielectric behavior of BEs system were characterized by using complex permittivity and electrical modulus and shown non-Debye behavior. Based on IR-deconvolution technique, it shown the ionic conductivity of BEs is governed by mobile ions (μ) and the diffusion coefficient number (D). Based on present results, it can be concluded that the biopolymer namely alginate, showing good potential to act as host polymer, which can be used as an electrolyte for application in electrochemical devices.
Acknowledgments
The authors would like to thank MOHE for FRGS (RDU 1901114) for financial assistant, Faculty of Industrial Science & Technology for internal grant (RDU 190389), Universiti Malaysia Pahang, technical staff of Laboratory Science & Technology Industry for the research support and Universiti Malaysia Pahang for providing Master Research Scheme (MRS).