

Abstract
A temperature sensor based on a Sagnac interferometer with a liquid crystal-filled microstructured optical fiber was investigated using the finite element method. Six submicron liquid crystal columns with refractive indexes higher than that of silica were introduced near the fiber core. The power of the core fundamental modes was still confined in the silica core and the mode field characteristics were strongly influenced by the six submicron liquid crystal columns. Based on the thermo-optic effect, the temperature-sensing property of the resulting liquid crystal-filled microstructured optical fiber in the range of 265–325 K was investigated by inserting it into a Sagnac interferometer. The temperature sensitivity reached −6.23 nm K−1 in the range of 265–295 K with good linearity. The sensing property could be further improved by optimizing the structure parameters of the microstructured optical fiber.
Export citation and abstract BibTeX RIS
1. Introduction
A liquid crystal (LC) is an intermediate state between a crystal and a liquid that has both, the orientational order of a crystal and the fluidity of a liquid [1–3]. The optical properties of LCs have been sufficiently studied for the extensive use of LCs in display applications [4], laser beam guidance [5], tunable photonic devices [6], and sensors [7]. As an important physical quantity, birefringence plays a vital role in LC applications. LC anisotropy originates from the different interactions between light and the long and short axes of an LC molecule. In addition, LC anisotropy is tunable using external stimuli, e.g., through the application of an electrical field, magnetic field, and under certain temperature [8–10].
In recent years, owing to their excellent optical properties, LCs have been used in photonic devices based on microstructured optical fibers (MOFs) [11, 12]. The cladding air holes in MOFs offer natural channels for LC infiltration. Because the refractive index of LCs is usually higher than that of silica, the transmission mechanism of silica MOFs changes from refractive index guiding to bandgap guiding for fully LC-filled MOFs (LC-MOFs) [13, 14]. The propagating wavelengths are commonly divided into several short bands whose boundaries could be modulated via electric fields and temperature. Thus, LC-MOFs can be used as photoswitches, polarization splitters, filters, and sensors [15–18].
In this study, we designed LC-MOFs by filling LC E7 into six submicron holes in MOFs. LC E7 is a nematic LC in which the rod molecules tend to be parallel along the long axis due to the van der Waals force. The background material of MOFs is silica, which has a smaller refractive index than both the ordinary and extraordinary refractive indices of LC E7. The six submicron LC columns were located in the neighborhood of the fiber core to ensure a strong influence of LC E7 on the fiber core modes. In contrast to general bandgap guiding MOFs, the designed LC-MOFs supported low loss transmission over a large and continuous wavelength range. Based on the thermal effect of LC E7, the designed LC-MOF was used as the sensing head in a Sagnac interferometer for temperature sensing. The temperature-sensing characteristics were theoretically investigated using the finite element method. The results indicated that the sensitivity could be further improved by optimizing MOFs structure parameters.
2. Design of the LC-MOF
Figure 1(a) presents the cross-section of the designed LC-MOF. Silica was used as the background material. Three-layer air holes in the cladding area were distributed in a hexagonal lattice arrangement. The six air holes in the second layer were rotated 30◦ relative to the air holes in the other two layers. The diameters of the air holes in the three-layer are denoted as d1, d2, and d3. The adjacent air holes pitches in the three-layer are correspondingly labeled as Λ1, Λ2, and Λ3. The six air holes in the inner layer were of submicron size, which is considerably smaller than the input wavelength. Yannick K. Liz et al fabricated a robust, low-loss photonic wire with subwavelength core diameter using tapered microstructured silica optical fiber [19]. The subwavelength inclusion in MOF could be used to alter the optical properties [20]. These submicron air holes in our designed MOF were assumed to be infiltrated with LC E7. According to the infilling theory [21], the infilling rate in the inner-layer air holes would be slower than that of the other two-layer air holes. Therefore, the axial multistep injection-cure-cleave method [22] could be used to achieve the infilling process based on the different infilling rates of the air holes.

Figure 1. (a) Cross-section of the liquid crystal microstructured optical fiber (LC-MOF). Electrical field distribution of core fundamental modes in the (b) x-polarized direction and (c) y-polarized direction.
Download figure:
Standard image High-resolution imageThe mode transmission characteristics of the designed LC-MOFs were analyzed using the COMSOL software which was established based on finite element method. A perfect matched layer and scattering boundary condition were added outside of the PCF in calculation. The dispersion relationships of silica and LC E7 used in this paper can be found in references [23–25]. Figures 1(b) and (c) depict the electrical field distribution of the core fundamental modes in the x-polarized and y-polarized directions, respectively. The parameters were set as follows: d1 = 0.20 μm, Λ1 = 2.5 μm, d2 = 2.0 μm, Λ2 = 4.0 μm, d3 = 4.0 μm, Λ3 = 7.0 μm, and T = 300 K. The mode field maintained quasi-Guass distributions for both orthogonal polarized directions. The power flow ratios along the z-axis direction in the six LC E7 columns were merely 0.34% and 0.37% for the x-polarized and y-polarized directions, respectively. Thus, majority of the power for the core fundamental modes was still confined in the central silica core.
The six submicron LC E7 columns were located near the silica core to help modulate the mode field characteristics. Figure 2 shows the mode birefringence of B as a function of wavelength. To obtain clear evidence of the vital role the six submicron LC E7 columns play, the mode birefringence with no submicron holes and six submicron air holes is also depicted in figure 2 using dashed and dotted lines, respectively. This plot illustrates that the MOF with no submicron holes had a weak birefringence of less than 5E-7. As six submicron air holes were introduced in the MOF, the symmetry was enhanced and the mode birefringence further decreased . After LC E7 was filled in the six submicron holes, the mode field characteristics significantly changed. Assuming the electrical field was loaded along the y-axis, the direction of the LC E7 molecules reoriented along the y-axis. Then, LC E7 became anisotropic and exhibited large birefringence. The solid lines in figure 2 illustrate the mode birefringence variations with wavelength when LC E7 infiltrated the six submicron holes. The mode birefringence mainly depended on the birefringence of LC E7 for the symmetric hole distribution in MOF. According to figure 2, the mode birefringence increased about three orders of magnitude after the infiltration of LC E7. The refractive index of LC E7 is also sensitive to temperature. As the temperature increased, the ordinary refractive index of LC E7 slightly changed whereas the extraordinary refractive index obviously decreased. The birefringence of LC E7 gradually decreased as the temperature increased. Consequently, the mode birefringence of LC-MOF decreased as temperature increased. Moreover, the confinement of power in the fiber core weakened as the wavelength increased. Thus, the mode birefringence decreased as the wavelength increased.
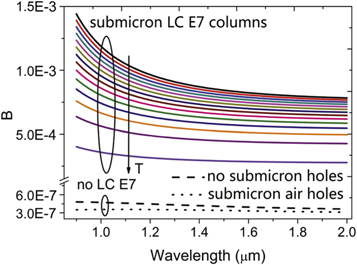
Figure 2. Birefringence of B as a function of wavelength. The dashed line denotes the condition of 'no submicron holes'. The dotted line denotes the condition of 'with submicron air holes'. Solid lines denote the condition of 'with submicron LC E7 columns'. The temperature was increased from 265 to 325 K in steps of 5 K.
Download figure:
Standard image High-resolution imageConfinement loss is an important factor for MOF applications. Figure 3 shows the confinement loss of core fundamental modes as a function of wavelength. The existence of submicron air holes in the MOF increased the confinement loss. There was no obvious difference between the confinement losses in the two orthogonally polarized directions for both MOFs without and with submicron air holes. After LC E7 was filled in the submicron holes, the confinement loss decreased and was different between the two orthogonally polarized directions. The confinement loss in the y-polarized direction was lower than that in the x-polarized direction. This was because the refractive index of LC E7 in the y-polarized direction was higher than that in the x-polarized direction. As the temperature increased, the confinement loss in the x-polarized direction slightly changed, whereas the confinement loss in the y-polarized direction notably increased.

Figure 3. Confinement loss of core fundamental modes as a function of wavelength.
Download figure:
Standard image High-resolution image3. Sagnac interferometer and its temperature measuring property
The designed LC-MOF demonstrated a large mode birefringence that could be thermally modulated. Therefore, we introduce the LC-MOF into a Sagnac interferometer for temperature measurements. Figure 4 shows the schematic of a Sagnac interferometer. A broadband source (BBS) outputs the laser into a 3 dB coupler. The 3 dB coupler splits the input light into two counter propagating waves. The LC-MOF is spliced with two single mode fibers. Then, an electrical field is applied to the LC-MOF. The polarization controller rotates the linear polarized light by 90° and the two counter propagating waves combine at the 3 dB coupler output port. This output spectrum is measured using an optical spectrum analyzer.

Figure 4. Schematic of a Sagnac interferometer.
Download figure:
Standard image High-resolution imageThe interference spectrum depends on the phase difference between the two orthogonal polarized core fundamental modes. The normalized output power can be obtained from the following expression:

where ϕ = BL/λ is the phase difference, L is the length of the LC-MOF, and λ is the wavelength in free space. On the one hand, the normalized output power reaches the maximum value when the phase difference of ϕ is equal to half integers. On the other hand, the normalized output power reaches the minimum value when the phase difference of ϕ is equal to full integers. Figure 5 shows the phase difference of ϕ as a function of wavelength. The temperature increases from 265 to 325 K in steps of 10 K. L was set to 2 mm. When ϕ was equal to 1, 2, and 3, the normalized output power reached the minimum values. Notably, ϕ decreased as temperature increased. The wavelength at ϕ that was equal to integers experienced a blue shift as the temperature increased. Figure 6 shows the normalized output power of P in dB as a function of wavelength. The temperature was increased from 265 to 325 K in steps of 10 K. The normalized output power of P in dB exhibited a minimum value when ϕ was equal to integers. A dip wavelength is the wavelength when P reaches a minimum value. As the temperature increased, the dip wavelength was blue shifted. There were multiple dip wavelengths at certain temperatures. This could result in a disturbance in temperature measurements. Therefore, determining a wavelength range in which only one dip wavelength existed at each temperature was necessary. One free spectrum range (FSR) demonstrated this one-dip wavelength requirement with a relatively large wavelength range is labeled in figure 6. The FSR covers the wavelengths from 1.075 (dip wavelength at ϕ = 2 and 265 K) to 1.635 μm (dip wavelength at ϕ = 1 and 265 K). Figure 7 shows the dip wavelength as a function of temperature at ϕ = 1. The dip wavelength decreased as temperature increased. The decreasing tendency accelerated as it approached the clearing temperature of LC E7. The black solid line depicts the third order polynomial fit over the 265–325 K temperature range. This revealed that a polynomial function could precisely fit the data over a large temperature scale. To a certain extent, a linear relationship is more convenient for detecting physical parameters in practice; therefore, we selected a short temperature range for linear fitting where the temperature was not near the clearing temperature of LC E7. The red line in figure 7 illustrates the linear fit curve covering the temperature range from 265 to 295 K. The temperature sensitivity reached−6.23 nm K−1 in this temperature range. The blue dashed line depicts the temperature sensitivity derived from the derivative of the solid black line. Notably, the sensitivity slowly varied at the beginning and increased in speed as it approached the clearing temperature of LC E7.
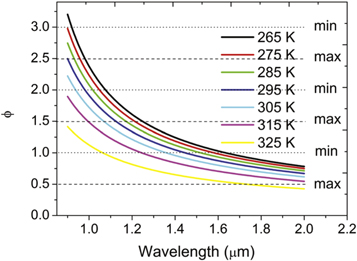
Figure 5. Phase difference of ϕ as a function of wavelength. Temperature increased from 265 to 325 K in steps of 10 K.
Download figure:
Standard image High-resolution image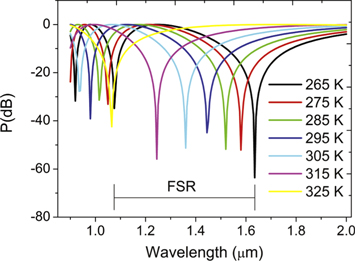
Figure 6. Normalized output power of P in dB as a function of wavelength. Temperature increased from 265 to 325 K in steps of 10 K.
Download figure:
Standard image High-resolution image
Figure 7. Dip wavelength as a function of temperature at ϕ = 1. The black solid line shows the third order polynomial curve fit from 265 to 325 K. The red solid line shows the linear curve fit from 265 to 295 K. The blue dashed line shows the temperature sensitivity derived from the derivative of the black solid line.
Download figure:
Standard image High-resolution imageThe temperature sensitivity (S) can be obtained according to the following expression:

where Bg =  is the group birefringence. Figure 8 shows the birefringence of B variation with temperature as the wavelength increased from 1.3 to 1.9 μm in 0.1 μm steps. As the wavelength increased, the birefringence of B gradually decreased. The birefringence yielded a linear relationship with temperature in the temperature range of 265–295 K. The derivative of B with respect to T can be calculated from figure 8. Table 1 lists the ∂B/∂ T values at different wavelengths. Figure 9 shows the group birefringence of Bg variation with wavelength as the temperature increased from 265 to 295 K in 5 K steps. This revealed that Bg decreased with increasing wavelength and temperature.

Figure 8. The birefringence of B variation with temperature as the wavelength increased from 1.3 to 1.9 μm in 0.1 μm steps.
Download figure:
Standard image High-resolution image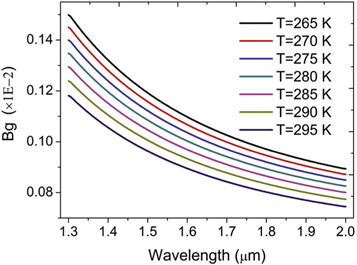
Figure 9. Group birefringence of Bg variation with wavelength as the temperature increased from 265 to 295 K in 5 K steps.
Download figure:
Standard image High-resolution imageTable 1. ∂ B/∂ T at different wavelengths.
| λ | 1.3 | 1.4 | 1.5 | 1.6 | 1.7 | 1.8 | 1.9 |
|---|---|---|---|---|---|---|---|
| (μ m) | |||||||
| ∂ B/∂ T | −4.93 | −4.56 | −4.30 | −4.11 | −3.97 | −3.86 | −3.77 |
| (×1E-6/K) |
By substituting ∂ B/∂ T and Bg into equation (2), we obtained the temperature sensitivity of S as functions of wavelength and temperature, as shown in figure 10. On the one hand, S slightly increased as the temperature increased from 265 to 295 K at the same dip wavelength. On the other hand, S rapidly increased as the dip wavelength increased. This provided us an approach to improve the sensitivity: moving the dip wavelength toward a longer wavelength.
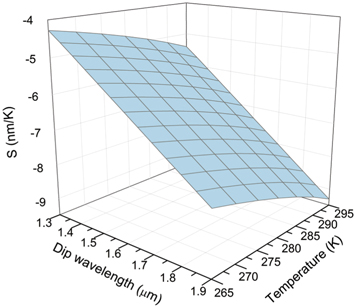
Figure 10. Temperature sensitivity of S as functions of dip wavelength and temperature.
Download figure:
Standard image High-resolution image4. Optimization of the sensing property
As is well known, the mode field characteristics in MOFs are affected by the fiber structure parameters. This offered us the possibility of increasing the sensing sensitivity by optimizing the LC-MOF structure parameters. Among the several LC-MOF structure parameters, the diameter of d1 and adjacent air holes pitch of Λ1 significantly influence the LC-MOF because the six submicron LC E7 columns are close to the fiber core. Figure 11 demonstrates the dip wavelength variation with temperature at different adjacent holes pitch of Λ1. The LC-MOF length and phase difference were set to 2 mm and 1, respectively. As Λ1 decreased from 2.5 to 2.4 μm, the mode birefringence of the core fundamental modes increased. As a result, the dip wavelength experienced a red shift. The temperature sensitivity increased from −6.23 to −7.14 nm K−1 in the temperature range of 265–295 K. On the contrary, the mode birefringence decreased as Λ1 increased from 2.5 to 2.6 μm, and the dip wavelength experienced a blue shift. The temperature sensitivity decreased from −6.23 to −5.4 nm K−1 in the temperature range of 265–295 K. Figure 12 shows the dip wavelength variation with temperature at different diameters of d1. The MOF length and phase difference were fixed at 2 mm and 1, respectively. As the diameter d1 decreased from 0.20 to 0.19 μm, the mode birefringence decreased, leading the dip wavelength to experience a blue shift. Meanwhile, the temperature sensitivity decreased from −6.23 to −5.55 nm K−1 in the temperature range of 265 to 295 K. On the contrary, the birefringence increased as d1 increased from 0.20 to 0.21 μm, leading the dip wavelength to experience a red shift. The temperature sensitivity increased from −6.23 to −7.03 nm K−1 in the temperature range of 265–295 K.
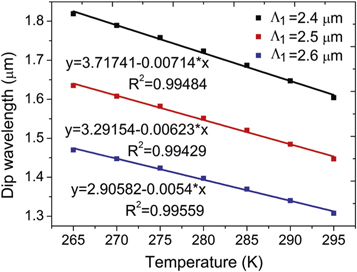
Figure 11. Dip wavelength variation with temperature at different adjacent holes pitches of Λ1. The other parameters were fixed: d1 = 0.20 μm, d2 = 2.0 μm, Λ2 = 4.0 μm, d3 = 4.0 μm, and Λ3 = 7.0 μm.
Download figure:
Standard image High-resolution image
Figure 12. Dip wavelength variation with temperature at different diameters of d1. The other parameters are set as Λ1 = 2.5 μm, d2 = 2.0 μm, Λ2 = 4.0 μm, d3 = 4.0 μm, and Λ3 = 7.0 μm.
Download figure:
Standard image High-resolution imageAs described in equation (1), the phase difference of ϕ yields a linear relationship with an LC-MOF length of L. This provided a convenient method to adjust the phase difference by changing the LC-MOF length. Figure 13 shows the dip wavelength variation with temperature at different LC-MOF lengths of L. The other parameters were fixed: d1 = 0.20 μm, Λ1 = 2.5 μm, d2 = 2.0 μm, Λ2 = 4.0 μm, d3 = 4.0 μm, and Λ3 = 7.0 μm. The phase difference of ϕ was set as 1. As L decreased from 2.0 to 1.8 mm, the phase difference of ϕ decreased, and the dip wavelength experienced a blue shift. Consequently, the temperature sensitivity decreased from −6.23 to −5.57 nm K−1 in the temperature range of 265–295 K. On the contrary, as L was increased from 2.0 to 2.2 mm, the phase difference of ϕ increased, and the dip wavelength experienced a red shift. The temperature sensitivity increased from −6.23 to −6.98 nm K−1 in the temperature range of 265–295 K.

Figure 13. Dip wavelength variation with temperature at different MOF lengths of L. The other parameters are set as d1 = 0.20 μm, Λ1 = 2.5 μm, d2 = 2.0 μm, Λ2 = 4.0 μm, d3 = 4.0 μm, and Λ3 = 7.0 μm.
Download figure:
Standard image High-resolution image
To sum up, the temperature sensitivity could be further promoted by moving the dip wavelength toward longer wavelengths. Specific measures include decreasing Λ1, increasing d1, and increasing L. Among these three parameters, the LC-MOF length of L is the most convenient factor for adjusting the interference wavelength region and sensing sensitivity. Table 2 depicts part of the recently reported temperature sensors based on optical fibers. These temperature sensors showed intersects with the temperature measuring range in this paper. Various thermal-optical materials (such as alcohol, methylbenzene, metal, LC, and so on) were introduced into the fiber temperature sensor. Li et al reported a Fabry–Perot interferometer based on metal film coated fiber [26]. This temperature sensor showed a large measuring range of 194.15–343.15 K while the sensitivity is only 14 pm K−1. The sensing sensitivity could be further improved at the expense of a narrower measurement range [27, 28]. Surface plasmon resonance (SPR) with sharpness spectra was used in the temperature sensor by filling both metal and thermal-optical liquids into air holes in PCF [29, 30].
Table 2. Comparison of recently reported temperature sensors based on optical fibers.
| Sensor type | Range | S | Reference |
|---|---|---|---|
| Fabry–Perot | 194.15– | 14 pm K−1 | [26] |
| 343.15 K | |||
| Loop mirror | 281.15– | 6.6 nm K−1 | [27] |
| 293.15 K | |||
| Fabry–Perot | 288.15– | 5.2 nm K−1 | [28] |
| 295.15 K | |||
| SPR | 283.15– | −7.069 nm K−1 | [29] |
| 308.15 K | |||
| SPR | 193.15– | −6.02 nm K−1 | [30] |
| 363.15 K | |||
| Sagnac | 265– | −7.14 nm K−1 | This work |
| 295 K |
5. Conclusion
In this study, we designed a temperature sensor based on a Sagnac interferometer using an LC-filled silica MOF. Six submicron LC E7 columns were located near the fiber core. In contrast to previous LC-filled silica MOFs, the designed LC-MOF could support light transmission over a large wavelength range. Meanwhile, LC E7 columns depicted a significant influence on the fiber core modes. This provides a novel method for designing MOFs filled with high refractive index materials. By inserting the LC-MOF into a Sagnac interferometer, we created a temperature sensor. As the temperature increased from 265 to 325 K, the temperature sensitivity changed gradually at the beginning; however, the rate of change increased sharply when approaching the clearing temperature of LC E7. The sensitivity reached −6.23 nm K−1 in the range of 265–295 K with good linearity. Based on theoretical analyses, the sensitivity can be further improved by moving the dip wavelength toward a longer wavelength. To achieve this, the following parameters could be modulated: decreasing of Λ1, increasing of d1, and increasing of L. Among these three parameters, the LC-MOF length (L) is the most convenient to adjust. The optimizing method used herein could also be applied to other fiber sensing devices based on optical interferometers.
Acknowledgments
This project was supported by the Natural Science Foundation of Hebei Province China (Grant No. F2017203110, F2017203193), the Postdoctoral Preferred Funding Research Project of Hebei Province, China (Grant No. B2018003008), and the National Natural Science Foundation of China (Grant No. 61505175, 61475134).