

Abstract
The magnetic and thermal properties of TbAl2 nanosized alloys (diameters, 12 nm  20 nm) obtained by high-energy milling are characterised by specific heat, magnetisation and neutron scattering. The specific heat shows that the λ-anomaly at Curie temperature vanishes when the milling time reaches 300 h and its field variation shows a broad peak around 70 K disclosing a disordered magnetic state. The thermal variation of magnetization follows a Bloch process with a decrease of the stiffness constant and a faster demagnetisation with a quadratic exponent instead of the bulk ordinary
  -dependence. The magnetic moment reduction in the nanosized alloys follows a 1/D dependence, remarking the role of disordered moment surface. The Rietveld analysis of the neutron diffraction patterns indicates a collinear ferromagnetic structure, with a reduction of the Tb-magnetic moment when decreasing the particle size. The temperature dependent overall magnetic signal of nanoparticles is derived from small-angle neutron scattering. A magnetic nanoparticle structure with an ordered ferromagnetic core and a disordered surface layer is proposed.
Export citation and abstract BibTeX RIS
1. Introduction
The study of magnetic nanoparticles (MNP) is a vast field within the more general research of magnetic nanostructures. The interest is due to the need of getting a precise interpretation of the basic magnetic parameters driving their applications in ferrofluids and biomagnetic devices, among others [1–3]. The reduction of dimensions of a magnetic material to the nanometer scale leads to novel phenomena absent in the bulk counterpart. The interpretation of those phenomena is basically understood assuming the single-domain behavior and the existence of an external shell of surface moments [4–6].
Among metallic MNPs, the rare-earth intermetallic 4f-based nanoalloys have been barely studied in comparison to those containing magnetic 3d transition atoms. Increasing evidence is being gathered especially in binary RX2 (R = 4f rare earth, X = 3d transition metal) nanoalloys, given that the properties of bulk alloys had been precisely determined [7]. In these nanoalloys some of the underlying ingredients driving the MNPs properties have been put forward [8–14]. An outstanding advantage of these rare-earth intermetallic binary nanoalloys is the ease to change the sign of the magnetic coupling by modifying the R-atoms and/or transition metal nature. One of the first examples was the milled cubic GdX2 (X = Al, Pt, Ir, Rh and Mg) Laves phase system, where the ferromagnetic (FM) contribution is inhibited in favour of a glassy magnetic state at lower temperatures [8–10]. This particle size reduction was achieved via the increase of milling time. Precisely, previous low-field dc-magnetisation and ac-susceptibility results in milled FM TbAl2 alloys, were interpreted due to the presence of a collective freezing [12].
The presence of magnetic disorder in nanosized RX2 alloys allows to classify them more generally as members of the so-called supermagnetic materials [6]. These involve ensembles of MNPs which can behave as super spin-glass, when there is a manifest moment freezing among interacting nanoparticles. A similar trend has been observed in other Tb-based nanoalloys, such as TbCu2, although they exhibit antiferromagnetic (AFM) behaviour. The magnetic contribution observed in the bulk sample (TN = 50 K) disappears for 20 h of milling time, and a spin glass (SG) behavior appears at lower temperatures (Tf =15 K) [14]. Furthermore, it also appears an unusual  superantiferromagnetic state induced by the particle size reduction and characterized by simultaneous AFM and SG behaviours, as established by neutron diffraction experiments [15]. Consequently, it is evident that neutron scattering techniques are a useful tool to disclose and characterise novel magnetic behaviours at the nanoscale. This also include the analysis of small-angle neutron (SANS) data as it reveals information on nonuniform magnetic interactions, as in Tb-based alloys [16, 17].
An overwhelming majority of these results stem from the analysis of both the irreversibility of low magnetic field dc-magnetisation data and of spin-dynamics from frequency-dependent ac-susceptibility results. In the present work we will put forward a complementary interpretation of the magnetic nanostructure of milled TbAl2 provided by specific heat (cp), a technique very sensitive to the destruction of magnetic order. As the cp(T) is affected by spin wave excitations, high-field magnetisation  will also be presented to study the magnon demagnetisation. Finally, the interpretation will be supported by a neutron scattering analysis. Within rare earth intermetallic alloys, the Tb-based ones are nicely suited for neutron scattering experiments because of the lower neutron absorption with respect to other rare earth ions with high intrinsic magnetic moment, such as Gd.
2. Experimental
The starting polycrystalline TbAl2 bulk alloy was prepared by arc melting suitable amounts of pure elements, Tb (3N-Alfa) and Al (5N-Alfa), in an arc furnace under a protective Ar atmosphere. Samples collected at different milling times (150 and 300 h) were prepared in a planetary high-energy ball system, Retsch PM 400/2, at a rotation speed of 200 rpm, as reported elsewhere [12]. The structural characterization was performed by x-ray diffraction in a Philips PW1710 diffractometer, using  radiation. The magnetic properties were measured with a Quantum Design PPMS multipurpose instrument in the 2–300 K temperature range, with applied magnetic fields up to 80 kOe. Neutron diffraction (ND)experiments have been carried out at the D1B high-flux two-axis diffractometer (Institut Laue-Langevin, France) using a wavelength λ = 2.52 Å. Neutron diffraction data were collected between 10 and 150 K in an Orange Cryostat. The corresponding patterns were analysed by Rietveld refinement (FULLPROF Suite package [18]). A large amount of MNP (around 4 g) and a long data collection time allow a good signal-noise ratio. SANS measurements were taken at the PAXY spectrometer (Laboratory Léon Brillouin, France) at four different temperatures, between 5 and 150 K. In-field (H = 80 kOe) patterns were also collected. The incident wavelength was set to λ = 5 Å, and the detector was placed at distances of 1.3 and 6 m. The covered q-range spans 0.003 Å
 0.2 Å−1. Particle size on 300 h milled alloy was examined using a Jeol Jem 2100 transmission electron microscope operating at 200 kV. For the specimen observation, the particles were first dispersed in methanol and sonicated in an Elmasonic SH-15 unit (ultrasonic frequency 37 kHz) at room temperature. A drop of the resulting suspension was deposited onto a carbon film coated copper grid and dried under ambient conditions.
3. Results and discussion
The x-ray diffraction patterns obtained for the alloys milled for 150 h (not shown) present broader and less intense diffraction peaks than those of the bulk alloy, although the broadening and intensity reduction are not so strong as those already reported for the sample milled for 300 h [12]. All the reflections were identified as coming from the bulk Laves phase ( space group). Using the Williamson–Hall procedure, a mean value of the particle diameter D = 20(1) nm and a lattice strain
  % are estimated for the 150 h milled TbAl2 alloy. This result matches with the tendency of the behaviour of the particle size and lattice strain, as previously obtained for other TbAl2 milled samples (20, 70, 180 and 300 h), using both the Williamson-Hall procedure and Rietveld refinement of the x-ray data [12]. Then, the milling route provides samples with a variation of size and a high amount of MNPs in a controllable procedure.
Figure 1 shows a high resolution transmission electron micrograph (TEM) of the fine fraction of the particle size of the 300 h milled TbAl2 sample. This fraction represent a tail of the distribution centered at a mean grain size of 14 nm, as obtained from the Rietveld analysis of the x-ray diffraction data. In this sense, x-ray diffraction has provided a good estimate of nanoparticle sizes in various materials, sampling a larger volume in comparison with TEM images ([12], and therein). In any case, the particles we observe in figure 1 provide the expected characteristic of the rest of the particles about their shape(near to spherical one) and their crystallinity, as depicted in detail in the inset, with the high resolution image of four nanoparticles.
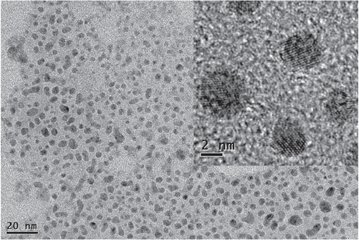
Figure 1. TEM image of the fine-sized nanoparticles fraction of the 300 h milled TbAl2 alloy. The inset shows a high resolution image of four nanoparticles of the mentioned fraction.
Download figure:
Standard image High-resolution image3.1. Specific heat and magnetisation
Measurements of the specific heat cp(T) on TbAl2 for the 300 h sample compared to the bulk (unmilled) alloy are shown in figure 2. The λ-anomaly observed for the bulk sample at the ferromagnetic ⇔ paramagnetic transition (TC = 105 K) is practically wiped out in the nanosized sample. The broadening of the  transition has been explained as a consequence of the combination of finite-size and surface effects, whose influence increases when decreasing the particle size [19, 20]. However, a careful analysis of the dc-magnetization data reveals that the FM transition does not fully disappear, and the TC of these nanometric alloys is strongly size dependent and decreases from 103 K for the bulk alloy down to 98 K for the 14 nm (300 h) alloy, as the particle volume is reduced. This reduction of TC has been explained by a finite-size scaling law [13]. Thus, specific heat measurements seem to be more sensitive to changes in disorder and particle size. Moreover, when comparing the specific heat of this sample with the unmilled one, besides the disappearance of the FM contribution, the cp(T) shows an enhancement in two different temperature ranges: above 120 K and below 20 K. We aim to better quantify these enhancements by plotting, in the inset of figure 2, the difference curve between the milled and the unmilled samples and marking with arrows the regions in which this difference reaches a positive value. The origin of these two contributions, both at low and high temperatures, has been explained with a model including a modification in the phonon spectrum of atoms at the core and at the surface. Such a modification is not specific of RX2 nanoalloys but appears on simple nanometric metals as well [21].
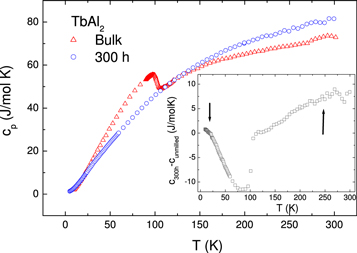
Figure 2. Temperature dependence of the specific heat (cp) in bulk and 300 h milled TbAl2 alloys. The inset details the subtraction between both curves. The arrows indicate the temperature regions in which this contribution becomes positive, due to size effects (see text) [21].
Download figure:
Standard image High-resolution imageOn the other hand, the 300 h milled sample was already reported to show SG behaviour, with a freezing temperature Tf = 45 K [12]. For canonical SG systems, a contribution to the cp(T), in the shape of a broad maximum, is expected around 1.3–1.5 Tf with a tail, due to short-range magnetic correlations, that may extend up to ≈ 4Tf [22, 23]. Thus, considering the Tf value for the 300 h milled TbAl2 alloy, a weak SG contribution would be expected around 60 or 70 K. As this contribution is not directly inferred from the curve presented in figure 2, a way to reveal it might be to subtract the electronic as well as the lattice contributions, from both the core and surface atoms in the particle [21]. This is traditionally carried out by choosing a non-magnetic isostructural material (LaAl2), but if it was to be employed it would be extremely difficult to set in the exactly same nanostructure, affecting the validity of the subtraction.
In this context, we suggest another way round to manifest the feeble magnetic contribution. It is well-known that the application of magnetic field in an ordinary ferromagnet would tend to broaden and shift the λ-anomaly towards higher temperature. Then, assuming that the magnetic field will only influence the contribution with magnetic origin, the differences with regard to the curve measured at zero field will yield information on the magnetic state. These results are presented in figure 3 for applied magnetic fields H = 1, 5 and 9 T. For any applied magnetic field, a maximum around 70 K is observed which is affected by the magnitude of H. Hence this is fingerprint of the magnetic contribution in 300 h nano-TbAl2. Incidentally the peak temperatures are close to those expected from the above commented freezing temperature.

Figure 3. Change in the specific heat of the 300 h TbAl2 nanocrystalline alloy at different magnetic fields. A peak at 65 K (H = 1 T) shifts to higher temperatures with the increase of the magnetic field, as indicated by the arrow.
Download figure:
Standard image High-resolution imageThe disclosure of a strong disordered magnetic state in cp(T) agrees well with the behaviour reported for the low-field irreversibility temperature dependence of the saturation magnetization (MS) of bulk and 300 h milled TbAl2 alloys [13]. In addition, the analysis of high-field thermal (low-T) demagnetisation of the nanoalloys also provides supportive magnetic information relating the propagation of spin waves whose dispersion relation for ferromagnets is  , in which Δ is the spin wave stiffness. These experimental data are presented in figure 4 for the two alloys. First we concentrate on the low-T M(T) variation. Visually there is a faster thermal reduction of the magnetisation (Tb3+ magnetic moment) in nanometric alloys respect to the bulk. Given that the particles comprise nanometric single crystals it is possible to use the Bloch's law, which considers the temperature dependence of the magnetisation following, if we drop higher order T-dependent terms [26]:

where M(0) is the saturation magnetisation at 0 K, and  is a coefficient depending on the spin wave stiffness. In conventional ferromagnets, α = 3/2, and hence should be employed for the bulk alloy. However, it has been proposed that there could be modifications in the exponent for nanostructures and α = 2 for MNPs have provided good results [27, 28]. The present fits have been performed within a temperature range up to 0.2 TC as it is usually considered in conventional magnets [26]. The result gives for the bulk sample
  =12·10−5
  , which is of order to that reported for GdAl2 (32·10−5
  ) [29]. In the nanometric alloys, B2 = 11 · 10−5 K−2 and B2 = 16 · 10−5 K−2 for 150 and 300 h, respectively. There is a certain tendency to increase the value as a consequence of a faster demagnetisation process. The tendency to find a B increase when the particle size is reduced has also been studied in other nanometric (ferrite) compounds [27, 30].
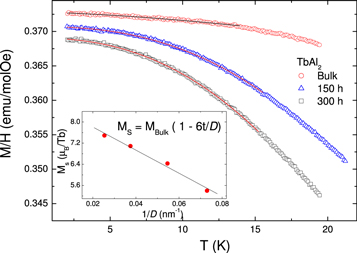
Figure 4. Thermal dependence of the saturation magnetisation in bulk and 300 h milled TbAl2 alloys. The solid lines are fits according to the Bloch's law expression (see text), as given in the label. The highest  coefficient is obtained for the nanocrystalline alloy (300 h−14 nm). Inset: Variation of saturation magnetization with
  .
.
Download figure:
Standard image High-resolution imageThe MNP size-reduction can also be tackled by establishing a correlation between the values of the saturation magnetization and the particle diameter. Using previous magnetisation data [12], it is possible to plot the MS as a function of  , as shown in the inset of figure 4. There is a linear behavior which can be connected to a reduction of the
  magnetic moment can be explained by the existence of a spin disorder layer at the surface of the particles. In this sense, and as was also applied in other nanoparticle systems [30–32], the width of this surface layer can be estimated from the plot of MS versus the inverse of the mean diameter of the particles (1/D), assuming a core-shell structure in which the non-magnetic shell has a constant thickness (t). The behaviour of this relationship is well accounted by the expression
  [30], being t = 0.8 nm in the case of the TbAl2 alloys. This value is close to that reported for MnFe2O4 nanoparticles (t = 0.7 nm) [31].
3.2. Neutron scattering
Before analyzing the neutron scattering results on the nanosized TbAl2 alloys, it is convenient to investigate the reference bulk alloy (0 h milled sample). Thus, figure 5 shows the Rietveld refinement (a = 7.7877(6) Å, Bragg error RB = 3.72) of the neutron diffraction pattern obtained for the bulk TbAl2 alloy at 10 K, well below the ferromagnetic transition temperature TC = 105 K [12]. Another diffraction pattern, measured at 150 K, is also plotted in the same figure, in order to notice the differences with the paramagnetic state. At 10 K, the increase of the intensity of several peaks is associated with the magnetic contribution. As expected for a ferromagnetic collinear structure, the magnetic peaks are superimposed to those corresponding to the crystallographic structure. The Rietveld refinement of the neutron diffraction data is consistent with a collinear FM structure with a  propagation vector, and having the magnetic moments aligned along the c-axis, as shown in the inset of figure 4. The value obtained for the
  ordered magnetic moment from this refinement at 10 K is
  , agreeing with previously reported data [25].
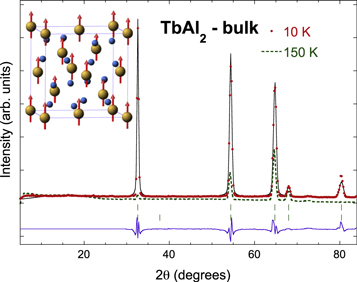
Figure 5. Rietveld refinement of the neutron diffraction pattern obtained for the TbAl2 bulk alloy at 10 K. The calculated and difference profiles are shown with a solid line and the position of the diffraction peaks for the nuclear and magnetic phases is shown with vertical tick marks. The diffraction pattern obtained at 150 K is shown, as a paramagnetic reference, with a discontinuous line. The inset details the magnetic structure. A collinear FM arrangement of the Tb-magnetic moments is observed.
Download figure:
Standard image High-resolution imageIn the case of the nanosized alloys, we have measured several patterns for the 150 and 300 h milled samples. The Rietveld refinements performed on the 10 K data corresponding to the both milled TbAl2 alloys are presented in figure 6. The diffraction pattern obtained at 150 K is also shown as a paramagnetic reference. In comparison with the bulk alloy, for 150 h, we can notice a broadening of the peaks and a decrease of their intensity, both effects associated with the particle size reduction. The magnetic core structure is not altered with a ferromagnetic collinear arrangement.

Figure 6. Rietveld refinement of the neutron diffraction pattern obtained for the 150 h (a) and 300 h (b) milled TbAl2 alloys at 10 K. The calculated and difference profiles are shown with a solid line and the position of the diffraction peaks for the nuclear and magnetic phases is shown with vertical tick marks. The diffraction pattern obtained at 150 K is shown, as a paramagnetic reference, with a discontinuous line.
Download figure:
Standard image High-resolution imageThe results on the 300 h milled alloy follow the same trend (see figure 6), exhibiting a larger broadening of the peaks due to a further reduction of the particle size down to 14 nm. Here, the average  magnetic moment at 10 K strongly reduces, down to 5.7
  . This is a microscopic confirmation of the reduction of MS with decreasing size. From the analysis of all the different neutron diffraction patterns (not shown), we have obtained the temperature dependence of the
  magnetic moment for the bulk sample, the 150 and 300 h milled TbAl2 alloys; these results are depicted in figure 7. The values obtained at the lowest measured temperature (10 K) are 6.6
  for the 150 h sample and 5.7
  for the 300 h sample, and they are reduced respect to the value obtained for the bulk alloy. In all cases, the magnetic moment decreases when increasing the temperature, but the reduction is faster for the milled alloys than for the bulk one, in agreement with the above results gathered for the Bloch demagnetisation.
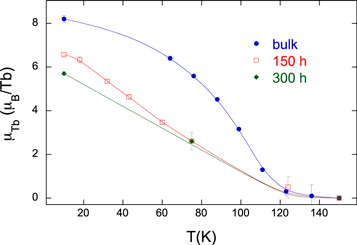
Figure 7. Temperature dependence of the Tb3+ magnetic moment in bulk, 150 h and 300 h milled TbAl2 alloys, as derived from the neutron diffraction measurements.
Download figure:
Standard image High-resolution imageIn order to gain complementary information on the magnetic behaviour of this nanoparticle system, we have performed small angle neutron scattering (SANS) in the sample with the smallest particle size: the TbAl2 300 h milled alloy. SANS experiments can supply information on the magnetic microstructure with a resolution of length scales in the nanometer regime [17, 33, 34].
Figure 8 shows the total SANS integrated intensity as a function of the momentum transfer (q), in a standard log-log representation, for different temperatures. SANS total intensity comprises both the nuclear and magnetic contributions ( ). In the left inset, the intensity variation with the magnetic field is presented, clearly affecting the central q-range. Under an applied magnetic field (H = 8 T), we expect an alignment of the
  magnetic moments along the direction of the magnetic field and, thus, a decrease on the magnetic SANS signal. To extract more information we use the thermal variation of the intensity. At low temperatures (5 K) a definite hump centered around q = 0.04 Å−1 is observed. This contribution decreases for higher temperatures (40 K, 60 K), becoming negligible for T > 100 K. For
  0.02 Å −1, the signal remains practically constant. The variation of the signal can be better inspected by the subtraction of the paramagnetic data (T = 150 K) to the lower T patterns, thus extracting the magnetic contribution to the intensity. The result is shown in the right inset of figure 8 where there is peak that decreases with increasing temperature. The peak position is associated to a periodicity of 16 nm [34]. The MNPs are concentrated and closely packed meaning that this is a reasonable value for the particle. The integrated intensity of this peak decreases with increasing temperature (at T = 60 K, the value is 18% respect the intensity at T = 5 K). Respect the correlation length ξ extracted from the peak width, the values are practically constant with temperature giving
  ;
;  ;
;  This is pointing to magnetic correlations among particles which become slightly more important when the system is at the lowest temperature.

Figure 8. SANS total intensity versus modulus of the scattering vector (q) for the 300 h milled alloy at various temperatures and zero applied magnetic field. Notice the log-log scale. The increase in temperature results in a decrease of the hump around q = 0.04 Å−1. For T > TC = 105 K, it disappears. Left inset: Variation of the intensity with the magnetic field. Right inset: subtracted intensity, providing the magnetic signal.
Download figure:
Standard image High-resolution image
4. Discussion
Now, considering the present results and those previously reported (low-field magnetisation and ac-susceptibility) for the TbAl2 milled samples [12, 13, 19], it is possible to propose a model of magnetic structure for these nanometric alloys. This consists of a FM core surrounded by a layer of misaligned surface moments, similar to that reported for other AFM nanoparticles, such as TbCu2 [15]. The additional lattice microstrain in the alloys should appear as the ingredient affecting the atoms close to the surface.
It is reasonable to assume a smooth crossover between the direction of the spins in the ordered core and the disordered layer. The presence of a disordered layer has a strong influence on the overall magnetic behaviour, with some consequences such as the decrease of the average  magnetic moment and the saturation magnetization when the particle size is reduced, or a faster thermal reduction of the magnetisation (with higher
  and α values) in the nanometric alloys than in the bulk sample. It can also have a determining role in the formation of the SG state, as postulated for other nanoparticle systems showing a spin-glass-like state at low temperatures [35, 36]. It is well known that both ingredients needed to establish a SG state, randomness and frustration on the magnetic interactions [23], can be favoured by the presence of magnetic disorder at the particle surface in this kind of system. ND is revealing that there is a definite FM order at the core of the particles which becomes to assemble several nanoparticle when the temperature is decreased, as witnessed by the ξ-variation. Therefore, a set of interacting FM nanoparticles showing SG behaviour indicates an overall magnetic behaviour as superspin glasses [6].
5. Conclusions
The influence of size effects on the magnetic state of a pure FM rare earth metallic system (TbAl2) has been investigated by complementary techniques (specific heat and neutron scattering) which are not frequently discussed in the magnetic nanoparticle studies. The results are consistent with a particle model consisting of an ordered FM core and a disordered surface layer. The magnetic bulk structure is retained with the core nanoparticles but there is some low-temperature coupling involving several nanoparticles. Further SANS studies under applied magnetic fields and different temperatures for intermediate milling times, between 20 and 150 h, might be needed, as the disordered magnetic behaviour is significative in those samples. In addition, these studies might clarify possible changes in the surface anisotropy when comparing with the bulk sample, or the existence of extra magnetic anisotropy energy due to microstrain when reducing the particle size, as observed in nanocrystalline Tb [37].
Acknowledgments
This work has been supported by the Direction of the Universities of the Ministry of Science and Education of Spain under contract MAT 2011–06542-c04. Authors want to thank Institut Laue-Langevin for allocating beamtime at D1B.