

Abstract
The current study investigates the erosion performance of high-velocity oxy-fuel (HVOF) sprayed Alloy718-nanoAl2O3 composite coatings on cast iron. The effect of the addition of nano-Al2O3 reinforcement in the Alloy718(AL718) matrix was studied by varying the nano-Al2O3 content from 10wt% to 30wt%. Initially, the microstructural and phase analysis of the developed coatings was conducted. The as-deposited coating in the AL718matrix showed the well-scattered nano-Al2O3particles in the AL718 matrix. The highest micro-hardness was found to be1296 ± 40 HV0.2 for Alloy718%-30%nanoAl2O3 (30N) coating, which is around 3.56 times higher than the grey cast iron (GCI) substrate. The air-jet erosion test was conducted at 900 °C at both low and high degrees impact angles (30° and 90°). The 30N coating showed the maximum erosion resistance due to the higher micro-hardness and fracture toughness amongst all the deposited coatings. The increased nano-Al2O3 content enhanced the erosion resistance of the coatings by providing dispersion strengthening to the matrix. The formation of cavities, ploughing, lip formation and micro-cutting were observed in all deposited coatings at 30° impact angle as wear mechanism. The formation of cracks, craters and pullout was the responsible wear mechanism at 90° impact angle for all deposited coatings. The developed coatings showed mixed behaviour of ductile and brittle mode of failure at 30° impact angle and brittle mode of failure at 90° impact angle for 30N coating.
Export citation and abstract BibTeX RIS
1. Introduction
The typical engineering components made of GCI include various turbocharger parts that experience high-temperature erosion when subjected to an elevated temperature environment. The surface of the mechanical components like turbocharger case, turbocharger housing, furnace parts and engine manifolds fails due to interaction with aggressive environments [1]. The materials required for power generation and integral parts of automotive engines such as engine manifolds must withstand hostile conditions such as high-temperature erosion at 400 °C–900 °C [2–4]. The commercially used material for turbocharger housing, turbocharger case and engine manifolds is GCI. The GCI subjected to high-temperature conditions oxidizes rapidly, and its surface properties get demolished as it cannot sustain the aggressive condition of elevated temperature. However, the surface properties of the GCI can be modulated using various surface treatment processes to enable it to be used in high-temperature conditions. The various surface treatment techniques include heat treatments, laser melting, TIG cladding and microwave cladding etc. These techniques are mostly applied to protect the surfaces of engineering components against wear and corrosion in harsh conditions [5–8]. Thermal spraying coating techniques are also widely practised to deposit coatings for combating erosion at high-temperature conditions [9–11].
One of the thermal spray coating techniques that utilize a high flame temperature (3000 °C) and a high velocity of up to 1000 m s−1 is the high-velocity oxy-fuel technique. In this process, a mixture of oxygen and fuel such as kerosene or propane is ignited in a small combustion chamber of a spray gun. The combustion products liberated with high-pressure heat up the feedstock powder particles and propelled them rapidly [12]. These molten and semi-molten feedstock particles are deposited on the substrate in the form of splats. The HVOF technique offers high hardness coatings with minimal porosity.
Further, the deposited coatings have good mechanical anchorage with the substrate surface [13]. The application of high-temperature erosion requires a coating with multiple sets of properties such as hardness and toughness. The composite coatings consisting of hard reinforced hard particles in the metal-based matrix fulfil this requirement and thereby provide erosion resistance at elevated temperatures.
The Ni-Cr-based coatings are a suitable candidate to resist high-temperature oxidation, whereas the reinforcements of hard particles (Al2O3 & Cr3O7) are added in Ni-Cr-based coatings to enhance its erosion resistance [14, 15]. The HVOF sprayed NiCr-Cr2C3 coatings showed better erosion resistance at 700 °C on T22 steel [16]. The HVOF technique was utilized to deposit the WC-10Co-4Cr coating on cultivator blades. The coating was observed to be well bonded, both mechanically and metallurgically. As a result, the HVOF coating was shown to minimize wear, which is a big problem in tillage machinery [17]. In another study, WC-12% Ni coating was deposited on the lamellar graphite cast iron substrate by the HVOF technique. It was found that the WC-12% Ni coating exhibited a lower wear rate [18]. The graphite cast iron was coated with Cr2O3-40%TiO2 by using the atmospheric plasma spraying (APS) technique. The Cr2O3-40%TiO2 coating showed improved wear and corrosion resistance compared to the substrate [19].
The NiAl-Al2O3 coatings sprayed by using the HVOF process showed better shock resistance at 400 °C as compared to bare 1018 low carbon steel [20]. The HVOF sprayed nimonic (Ni-20%Cr)and Cr3C2-NiCr coatings showed good performance at 900 °C [18]. The Alloy718 coating deposited with the HVOF technique on GCI showed an excellent performance in resisting the oxidation at 900 °C for 50 cycles [1]. The addition of hard particles in the form of reinforcements (like Al2O3, WC and SiC) in suitable proportion helps in enhancing the erosion performance of the composite coatings. The addition of such reinforcements helps in tailoring the mechanical properties by varying the shape and size of particles to be added as reinforcements in the composite coatings [21].
The main aim of the present work was to examine the high-temperature erosion resistance of the composite coatings composed of the Alloy718 matrix and agglomerated nano-Al2O3 reinforcement particles in three proportions(10, 20 & 30wt%). These composite coatings were deposited on GCI by utilizing an HVOF process. The designation system used for the three composite coatings is as follows: AL718 + 10% nano-Al2O3 (10N), AL718 + 20% nano-Al2O3(20N) and AL718 + 30% nano-Al2O3 (30N). The deposited coatings were evaluated regarding their microstructural features, the evolution of phases, fracture toughness and microhardness values. The high-temperature air-jet erosion behaviour of the coatings was studied according to the ASTM G76 standard at 900 °C. The as-sprayed coatings and the wear mechanisms in worn-out coatings were analyzed with the help of SEM-EDS techniques. The outcome of the presented work shall be used in the typical engineering components like engine manifolds and various parts of turbochargers exposed to elevated temperatures for enhancing erosion performance.
2. Experimentation
2.1. Materials and coating deposition
The GCI was taken as substrate materials due to its extensive application in exhaust manifolds in automotive engines, turbocharger housing and case. The GCI flat was cast and then cut into the required size for coating by employing a wire-cut machining process. The AI718 and nano-Al2O3 feedstocks were mixed in three different proportions. The AL718 powder was procured from Metallizing Equipment Co. Pvt. Ltd (MECPL), India and nano-Al2O3 powder was supplied by HI Group, Hong Kong, China. The nano-Al2O3 powder was agglomerated to a particle size closely matching that of the AL718 commercial powder. The manual granulation technique was adopted to agglomerate the nano-Al2O3 powder particles. In this process, small quantity of nano-Al2O3 powder particles (approximately 20 g) are taken in a glass mortar. This powder is stirred gently using a glass pestle, and a 10 wt% poly-vinyl alcohol-distilled water slurry is added to it drop-by-drop. The agglomeration of the processed nano-Al2O3 particles was confirmed by visual inspection and ensuring their flowability on shaking inside the glass mortar.
During the manual granulation process, a wide range of powder agglomerates with sizes varying from 15 to 165 μm was obtained. The agglomerated particles were finally heated in an oven at 150 °C for six hours to remove the moisture present in the powder. The powder granules with this size range are not suitable for the HVOF spraying process. Hence, mechanical sieving was carried out to obtain powder granules within the size range of 25–65 μm, as required for the HVOF spraying purpose. The three composite powders were prepared by mixing AL718 powder and agglomerated nano-Al2O3 powder (10, 20, & 30wt%)in a V-type mixer for 6 h [22]. A NiCrAlY bond coat was also introduced between the substrate and composite material topcoat. Here, the main function of the bond coat is to minimize the gradient of mechanical and thermal properties between the topcoat and the substrate. It also provides a rough surface for proper mechanical adherence of the topcoat. Additionally, the bond coat being rich in Ni and Cr prevent the diffusion of elements at high temperatures from the coating to the substrate and vice-versa. The elements present in the GCI are 3.49-C, 1.91-Si, 0.587-Mn-0.025-P, 0.024-S, Fe-93.57 and Bal.-others. The actual chemical composition of GCI was checked by an optical spectrometer (Make: Metal Vision, Model: 1008i), and the chemical compositions of thermal spray feedstock powders are presented in table 1.
Table 1. Compositions of base metal and various feedstock powders.
| Wt % of elements | |||||||||
|---|---|---|---|---|---|---|---|---|---|
| Ni | Cr | Fe | Nb | Mo | Al | O | C | Others | |
| AL718 | 54.0 | 17.9 | 18.0 | 4.9 | 2.9 | 0.6 | — | 0.09 | Bal. |
| NiCrAlY | 68.37 | 21.7 | — | — | — | 10.21 | — | — | Bal. |
| Al2O3(nano) | — | — | — | — | — | 66.40 | 33.60 | — | — |
The HVOF technique with Hipojet-2700 gun at MECPL, Jodhpur, India, was utilized for coatings. The standard process parameters used for the deposition of composite coatings were varied within the feasible ranges. These ranges were explored based on the standard process parameters available with the coating service provider (MECPL) for similar types of coatings. Moreover, the quality of deposited coatings with respect to the visible defects like surface porosity and surface roughness, proper coating build-up, and bonding with the substrate was accessed for these feasible ranges. Various trials were performed before the selection of final coating parameters. The coupons were grit blasted before deposition of coating for proper mechanical bonding between the coating and substrate. The final deposition parameters used for coatings are presented in table 2.
Table 2. Spraying parameters used for deposition of composite coatings.
| Spraying parameters | Units | AL718 coatings | NiCrAlY |
|---|---|---|---|
| Flow rate (Oxygen) | splh | 270 | 245 |
| Pressure (Oxygen) | bar | 9 | 11 |
| Feed rate(Powders) | g min−1 | 60 | 40 |
| Flow rate (LPG) | splh | 55 | 45 |
| Pressure (LPG) | bar | 8 | 6 |
| Stand-off distance | mm | 200 | 210 |
2.2. Analysis and characterization
2.2.1. Surface roughness and microhardness measurement
The different surface roughness parameters of the composite coatings were measured by utilizing an SJ-201, Mitutoyo, Japan contact form roughness tester. For the limit, average and root mean square roughness, an average of ten readings was considered as a cut-off length of 3 mm. The Vickers microhardness tester was employed to assess the microhardness values across the cross-sections of the deposited coatings(EcoNet VH1, Chennai Metco, India). An average of ten readings was considered for microhardness calculation. The fracture toughness (K1C) was calculated at the polished cross-sections of coatings. For this purpose, a load of 10 kg was applied for a dwell period of 15 s. After that, SEM imaging was performed to measure the size of indents and cracks emerging from the corners. The Evan's and Wilshaw's relationship was used to calculate K1C of the developed composite coatings, as mentioned in equation (1) [23].

Where f is the applied load, 'a' is the half diagonal length of the indent and c is the crack length from the center of the indent.
2.2.2. Microstructural and phase analysis
For the morphology and topological features, SEM-EDS (JSM6610-LV, Joel, Japan) were utilized for the examination of the powders, as-sprayed coatings and worn-out surfaces of both (bare GCI and coatings) specimens. The XRD analysis was performed on AXS-diffractometer, operated with Cu-Kα radiation, step time of 1° min−1 and step size of 20° to 100°.
2.3. High-temperature erosion testing
An erosion test (air-jet) was conducted on both (bare and coatings) specimens by utilizing an air-jet erosion tester (TR-471-M10 Ducom Inst., Banglore, India) as per ASTM G76-02 at 900 °C. The density and weight loss values were used to measure the erosion rate (g/g) of the base material and coatings. The hot air-jet erosion rig consists of an accelerated chamber mixing particle feeder equipped with an air compressor and air particle mixing, as presented in figure 1.

Figure 1. Schematic representation of hot air-jet erosion test apparatus.
Download figure:
Standard image High-resolution imageThe compressed air is combined with eroding particles, and then the mixture is accelerated by a 4 mm diameter converging nozzle, which was made of a tungsten carbide-based ceramic material. Both (bare and coatings) specimens were impacted by the accelerated solid eroding particles, which were placed in an interchangeable sample holder at 30° and 90° angles, as seen in figure 2.

Figure 2. (a) Sample holder for 90°, (b) Sample holder for 30° impact angle, and (c) Erosion test chamber.
Download figure:
Standard image High-resolution imageBy adjusting the pressure of compressed air, the impact velocity of eroding particles can be changed. The erodent material used in the present study was alumina, having particle size 45 ± 3 μm. Preheating of the erodent powder was carried out for 1hrduration at 900 °C to extract moisture. The erosion test was carried out at 900 °C in an erosion tester and the test time for one specimen was 10 min. The weight change was measured for every specimen before and after experimenting with an electronic balance. Both coated and uncoated specimens underwent the same procedure for comparison.
3. Result and discussion
3.1. Coating characterization
The surface topology of agglomerated nano-Al2O3, AL718 and NiCrAlY feedstock powders are shown in figure 3. The nano-Al2O3powder with a 200 nm average size was agglomerated by using a manual agglomeration process, and the obtained powder fabricated through the agglomeration process showed a particle size ranges between 40–45 μm. The EDS of the agglomerated powder is shown in figure 3(b). The AL718 powder shows a particle size of 40–45 μm with spherical morphology, and corresponding EDS is also presented (figures 3(c) and (d)). Whereas the NiCrAlY powder also shows a particle size matching with the AL718 powder (figure 3(e)) and the corresponding EDS of NiCrAlY powder is shown in figure 3(f).

Figure 3. Surface morphology and EDS of (a) & (b) agglomerated nano-Al2O3 powder, (c) & (d) NiCrAlY powder, and (e) & (f) AL718 powder.
Download figure:
Standard image High-resolution imageThe as-sprayed surface characteristics of all combinations of deposited coatings are shown in figure 4. The coatings showed the characteristics of the HVOF process like melted, partially-melted and un-melted matrix [24]. The morphology difference can be seen between the melted AL718 splats and nano-Al2O3 particles (mostly in partially melted &unmelted states) in the SEM micrographs (figures 4(a)–(c)). In the SEM micrographs, the nano-Al2O3 particles seem to be embedded in the matrix of melted AL718 splats. These nano-Al2O3 particles are uniformly dispersed in the AL718 matrix. However, some nano-Al2O3 particles in agglomerated form can also be seen in SEM micrographs (figure 4(c)). The agglomerate size of nano-Al2O3 powder particles was in the range of −15/+45 μm. The agglomerated powder particles provide excellent flowability to the mixed feedstock powders during the coating deposition using a dedicated HVOF gun [25]. The overall idea of agglomeration is to maintain the flowability of powder from the nozzle of the spraying gun. During the spraying of powders in an HVOF process, most of the agglomerated powder particles were dispersed due to the high velocity involved in the process. The scattered nano-Al2O3 particles (mostly in an un-melted state) can be observed uniformly distributed within the as-sprayed coating microstructure.

Figure 4. Surface topology of the as-sprayed (a) 10N, (b) 20N, (c) 30N coatings at different magnifications, and (d) EDS corresponding to 4(b).
Download figure:
Standard image High-resolution imageThe micrograph of as-sprayed 20N coating is represented in figure 4(b). The agglomerated and un-agglomerated particles embedded in the Al718 matrix are confirmed by EDS, as shown in figure 4(d). The agglomerated nano-alumina particles are of sub-micron size, whereas the un-agglomerated particles are even less than 500 nm, as observed in figure 4(b).
The cross-sectional SEM micrographs of all combinations of deposited coatings at various magnifications are shown in figure 5. The cross-section of the coatings presents a mechanical anchorage between the topcoat and substrate through a bonding layer. There is a mechanical bonding between the coating and the substrate. The microstructure features include a typical splats formation, and no cracking or large voids appear across the cross-section micrographs of the deposited coatings. The bi-layer composite coatings showed a thickness of 200 ± 10 μm for topcoats (10N, 20N and 30N) and 40 ± 5 μm for bond coats as seen in (figures 5(a)–(c)). The black phase observed in the cross-sectional SEM micrographs of the deposited coatings at higher magnifications (figures 5(d)–(f)) were corresponded to the nano-Al2O3 particles. The area fraction of the nano-Al2O3 particles were measured from optical micrographs for 10N, 20N and 30N composite coatings. The corresponding calculated values were found around 14%, 19% and 28%, respectively. The percentage porosity of the deposited coatings was determined by processing the BSE images of coating cross-section into the image analysis software. It was observed that the percentage porosity value for all combinations of deposited coatings was in the range of 1%–1.5%. The low value of the porosity was attributed to the high ductility associated with the melted AL718 splats, which makes it possible to accommodate the nano-alumina particles onto the substrate without creating porosity. The use of nano-alumina particles in the AL718 matrix has also resulted in better surface bonding with AL718, which resulted in a lower porosity in the deposited coatings, as seen in the SEM cross-section micrographs of coatings (figure 5).

Figure 5. Cross-section SEM micrographs of (a) 10N, (b) 20N, and (c) 30N composite coatings [4].
Download figure:
Standard image High-resolution imageFigure 6 displays the XRD patterns of formed coatings. The peaks in the XRD patterns of the coatings corresponded to mainly Ni-Cr-Fe based solid solution phase and Al2O3 phase. Ni, Cr, and Fe are the main elements present in the AL718 powder, and these elements were present in the starting AL718 powder in a solid solution phase. Some small peaks corresponding to Cr2O3 were also observed in the XRD patterns. The development of the Cr2O3 phase occurred during the oxidation of Cr element present in the AL718 powder in the spraying process [24].

Figure 6. XRD patterns of (a) 10N, (b) 20N, and (c) 30N composite coatings.
Download figure:
Standard image High-resolution image3.2. Surface roughness, micro-hardness and fracture toughness of the composite coatings
3.2.1. Surface texture analysis
For the limit (RZ), average (Ra), and root mean square roughness (Rq), the average of ten readings were taken as per the procedure explained in section 2.2.1. The corresponding results were indicated in figure 7. Amongst all combinations of the deposited coatings, the 10N coating exhibited the lowest surface roughness. The 10N coating's lowest surface roughness value can be attributed to the higher concentration of AL718 matrix. The AL718 (1492 °C) has a low melting point as compared to Al2O3 (2100 °C) [26]. Moreover, the AL718 matrix has high plasticity as compared to the Al2O3. Therefore, during HVOF spraying, the AL718 particles get melted (only a considerable amount). The melted AL718 splats impacted upon the substrate and on the previously deposited splats of AL718 and Al2O3. The high plasticity of the AL718 powder contributes to the formation of flattened splats. Therefore, the melted splats of AL718 in the as-sprayed coatings resulted in reduced pore formation. Whereas the low plasticity of un-melted Al2O3 particles has contributed to the higher surface roughness. Therefore, the 10N coatings have a lower surface roughness value, followed by 20Nand 30N coatings, respectively.
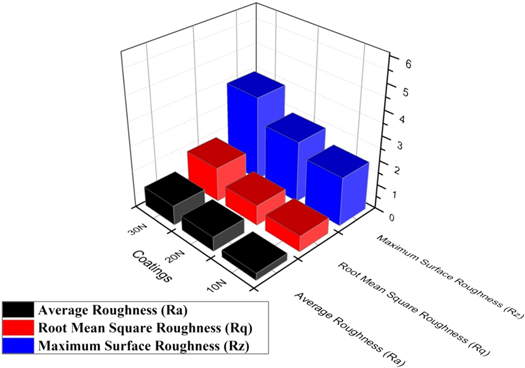
Figure 7. The magnitude of surface roughness parameters of10N, 20N and 30N deposited coatings.
Download figure:
Standard image High-resolution image3.2.2. Microhardness analysis
The substrate material (GCI) used in the present investigation revealed an average micro-hardness of around 229 ± 10 HV0.2 [4]. The maximum average micro-hardness value of 1296 ± 40 HV0.2 was obtained in 30N coating, which is around 3.56 times higher than the substrate material. In 10N, and 20N coatings, the microhardness values (average) were found to be 789 ± 45HV0.2 and 920 ± 78HV0.2, respectively. In the high-velocity combustion spraying techniques, the near interlamellar contacts and minimal porosity resulted in a higher hardness of the deposited coatings [9]. The increased microhardness of the formed coating is attributed to the presence of nano-Al2O3 in it, which is responsible for enhanced surface bonding with the AL718 matrix. The other possible cause for improved microhardness is a decreased defect level such as nano-scale porosity in the deposited coatings [27]. In an earlier published research work, the authors have deposited the alone AL718 coating and AL718 with varied reinforcement of micron-sized Al2O3 (10, 20 and 30 wt%) coating on the GCI substrate by utilizing an HVOF technique [4]. The microhardness of 563 ± 15 HV0.2 was seen by the as-sprayed AL718 coating deposited on GCI using the HVOF technique. Further, the maximum hardness was found around 801 ± 40 HV0.2 in AL718 + 30%Al2O3 coating sprayed by using HVOF coating on GCI substrate [4]. The microhardness of 1151 HV in Ni+60wt% Al2O3 coating was observed in high-velocity flame sprayed coating on turbine steel (13Cr4Ni) [28]. The average microhardness of about 673 HV0.2 was observed in plasma-sprayed NiCrSiB-40% Al2O3 coatings on AISI 304 substrate [22]. The microhardness value of 225 HV0.2 was found in the cold sprayed Ni+40% Al2O3 coatings [29]. The hardness of 411 HV0.2 was found in HVOF sprayed NiAl-40%Al2O3 coating [30]. In the present case, the microhardness value observed in the deposited coatings was higher than the previous work reported by many authors, in which the metallic matrix was mainly strengthened by micron-sized Al2O3 reinforcement. Therefore, relative to the as-sprayed AL718 and micrometric Al2O3 strengthened AL718 coatings, the inclusion of nano-Al2O3 in the AL718 matrix increased the microhardness values of the composite coatings [31]. The nano-alumina particles increased the hardness of the deposited coatings through a dispersion strengthening mechanism. During plastic deformation caused by indentation, there is a generation of dislocations in the matrix. These dislocations further interact with nano-sized Al2O3 particles, which act as a hindrance to the dislocation movement. Thus, the presence of nano-sized Al2O3 particles helps to increase the hardness of the composite coatings through Orwan strengthening mechanism. The nano-Al2O3 particles effectively pin the dislocations by lowering the inter-particle spacing in the deposited coatings, which further improved the hardness of the composite coatings.
3.2.3. Fracture toughness
The procedure of measuring fracture toughness has been presented in section 2.2. The calculated value of the fracture toughness for 10N, 20N and 30N coatings in MPa.m1/2 was found to be 3.24, 3.64, and 4.2, respectively. The SEM micrographs present the indents formed on the developed 10N, 20N and 30N coatings across the cross-section, as shown in figures 8(a)–(c). The values of 'a' is the half diagonal length of indent and c is the crack length from the centre of the indent were measured from these SEM micrographs for calculating the fracture toughness as presented in figure 8(c). The fracture toughness values are scattering around 4 MPa.m1/2 due to increasing porosity in the coatings with the increase in Al2O3 contents in it. The proportion of alumina (by wt%.) present in the coatings was also observed to affect the fracture toughness of the coatings. Crack distances for all three coatings in the longitudinal direction are higher than those in the transverse direction. These findings show that the resistance provided by coatings to crack propagation is more in the transverse direction compared to the longitudinal direction. The results supported the earlier findings also [32].

Figure 8. SEM micrographs of 10N, 20N and 30N composite coatings showing indents taken for fracture toughness calculation.
Download figure:
Standard image High-resolution image3.3. High-temperature test for air-jet erosion
In erosion testing, the stream of the eroded particles at a particular speed will be impinging at an angle to the flat substrate surface. Depending upon the erodent type and velocity, the surface and subsurface of the flat material experienced the wear. The detailed procedure of high-temperature tests for air-jet erosion has been elaborated in section 2.3. The erosion performance of all the fabricated composite coatings has been presented in the following sections. The findings have been further analyzed by the SEM micrographs to investigate the probable wear mechanism responsible for the coating's erosion.
3.3.1. Effectof impingement angle in the solid particle Air-jet erosion test
The high-temperature solid particle erosion analysis on the uncoated GCI and coated specimens were conducted at 30° and 90° angles. The low magnification optical images corresponded to the eroded surfaces of both (bare and coatings) specimens subjected to various test angles are seen in figure 9. It can be found that at all research angles, 30N coatings sustained less damage compared to the 10N, 20N and uncoated GCI substrates. The erosion resistance of the base material and coated specimens can be measured by the shape and size of the impression (wear zone) formed on their erosion-tested surfaces. A deeper impression on the substrate can be observed at both the testing angles, as shown in figures 9(a) and (b), respectively. The smallest impressions were seen on the surface of 30N coatings as compared to 10N and 20N coatings.

Figure 9. (a) & (b) Typical photographs of eroded substrate at 30°&90°, (c) & (d) Typical photographs of eroded 10N coatings at 30°&90°, (e) & (f) Typical photographs of eroded 20N coatings at 30°&90°, (g) & (h) Typical photographs of eroded 30N coatings at 30°&90°.
Download figure:
Standard image High-resolution imageFigure 10 presents the erosive wear rates (g/g) for uncoated GCI and all deposited coatings. In the case of the coated specimen, the erosion rate depends on the composition of the coating [33, 34]. The wear mechanism for GCI and coatings depends on the angle of impact of the erodent particles. In all the test conditions, the erosion resistance of all combinations of deposited coatings exhibited better erosion resistance as compared to GCI substrate material at all test angles. This indicates the use of coatings in protecting the GCI substrate surfaces. Furthermore, the 30N coating was found to be superior in providing erosion resistance as compared to the 10N, 20N and GCI substrates. For the 30N coated specimen, the erosive wear rate (g/g) demonstrated approximately 4.7 times better output in erosion tests performed at an angle of impact of 30° and 2.9 times better resistance at an angle of impact of 90° relative to the substrate. The findings thus suggest the effectiveness of the 30N coating in all the test conditions against high-temperature erosive wear. The 30N coating's high-temperature erosion resistance was due to the solid solution hardening effect created in the AL718 powder by different alloying elements, such as W and Mo. The increased erosion resistance of the composite coating was also due to the presence of nano-Al2O3 particles in it. The nano-Al2O3 particles were uniformly dispersed throughout the coating's microstructure. Thus, they contribute to enhanced erosion resistance of the impinged solid particles by providing dispersion strengthening to the coating matrix [35].

Figure 10. Comparison between GCI substrate and coatings for erosion wear rate of at 30° and 90° impact angles.
Download figure:
Standard image High-resolution image3.3.2. Erosion mechanism
The SEM micrographs illustrate the surface characteristics of the eroded GCI specimens are shown in figure 11. The micro-cutting produced with sharp edges of erodent can be seen on the eroded surface at 30° angle. The minor craters and cavities were conjointly created at an angle of impact of 30° on the eroded surface. These properties were different to those present within the uncoated surface that was subjected to erosion testing at an impact angle of 90°. The fatigue loading is responsible for the creation of cracks resulting in the removal of the debris at 90° impact angle [36]. The presence of fine cracks and few erodent particles embedded on the surface were also seen at a 90° impact angle [37]. These cracks have emerged because of the persistent fatigue loading induced by the varied impacts of the erodent that caused the brittle fracturing of the GCI material. The repetitive impacts lead to the pullout of material and forming craters at separate locations as shown in figure 10(a) [38, 39]. From the above findings, it has been revealed that the brittle erosion mode is mainly accountable for damaging material from the uncoated GCI substrate surface.

Figure 11. SEM of the eroded surface of un-coated GCI at (a) 30, and (b) 90° angle of impacts.
Download figure:
Standard image High-resolution imageThe SEM micrograph illustrates the surface characteristics of the eroded 10N coated specimens are shown in figure 12. It has been found from the SEM micrographs of the eroded 10N coatings that the process behind the accumulated coating degradation consists of removing AL718 splats, micro-cutting, removing fewer embedded un-melted alumina particles, and cracking (figure 12). In the present case, the nanometric Al2O3 has been added into the AL718 alloy powder in three proportions (10, 20 & 30wt%) and deposited on GCI substrate using an HVOF process. The addition of nano-Al2O3 increased the cohesion of powder particles as compared to the micrometric coatings [4]. The eroded surface of 10N coatings showed fewer micro-cutting impressions and ploughing at 30° impact angle, as shown in figure 12(a). Whereas, some impact sites along with cracks and pullout were also observed at 90° impact angle as shown in figure 12(b). During erosion tests conducted at a 30° impact angle, ploughing and abrasion marks can be seen along with the plastically deformed and strain-hardened material (lip), as seen in figure 12(a) [40]. In the worn-out surface of 10N coated specimens, the ploughing and plastic deformation reveals the tendency of failure as a ductile mode of erosion at a 30° angle of impact [41]. The erosion of the 10N coated specimen in ductile mode is further confirmed by the higher erosion rate at 30° angle of impingement as seen in figure 10. The fatigue loading caused by the repeated normal impacts (at 90° angle) of the eroding particles on the un-melted splats present in the 10N coatings resulted in the formation of craters. The pullout of these un-melted splats from the matrix is caused by the impact of the erodent particles. The cracks, cutting marks, pullout and embedded erodent particles on the surface can be observed at an impact angle of 90° on the exposed eroded surface as shown in figure 12(b).

Figure 12. SEM of the eroded surface of 10N coated GCI at (a) 30°, and (b) 90° angle of impacts.
Download figure:
Standard image High-resolution imageThe SEM micrograph of eroded 20N coating is presented in figure 13. The SEM micrograph of eroded 20N coating showed some abrasion marks with less plastic deformation and some shallow grooves formed on the surface at 30° angle of impingement, as shown in figure 13(a). At a 30° angle, the eroding particles exert a strong repetitive tangential force on the targeted surface. This tangential force resulted in the removal of un-melted alumina particles from the AL718 splats matrix, and it leaves behind the marks of tiny craters. The uniformly embedded nano-Al2O3 particles hold the AL718 matrix and restrict the plastic deformation of the deposited composite coating compared to 10N coating (figure 11(a)). The 20N coating showed the formation of fewer cracks, and the same crack growth has been arrested by nanostructured coating at 90° angle of impingement, as shown in figure 13(b). At a higher impact angle, material removal from the surface in the form of fewer shallow grooves was occurred due to repetitive impact of erodent particles and thereby resulting in brittle failure of the surface.
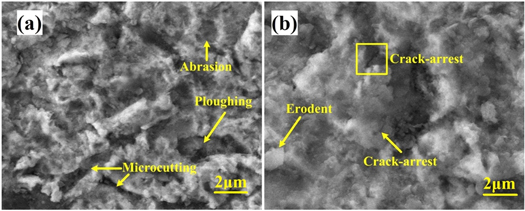
Figure 13. SEM of the eroded surface of 20N coated GCI at (a) 30°, and (b) 90° angle of impacts.
Download figure:
Standard image High-resolution imageThe SEM micrographs of the eroded 30N coating are presented in figure 14. At a 30° angle, the eroding particles exert a strong repetitive tangential force on the targeted surface to form abrasion marks. The SEM micrographs of eroded 30N coating showed the retained nano-structure morphology of the coating as compared to 10N and 20N coatings with some shallower cavities and abrasion marks. These cavities are not much deformed at 30° impact angle as compared to other deposited coatings, as shown in figure 14(a) [42]. The cavities formed are therefore attributed to the mixed behaviour of ductile and brittle mode of failure in 30N coating. There are impact sites on the eroded coating at 90° angle of impact, as shown in figure 14(b). The shallow craters formed on the surface are formed due to the repetitive action of erodent particles, thereby causing brittle mode of failure at 90° angle of impact. Therefore, the mixed mode of failure occurred in the 30N coatings in which the damage to the coatings occurred at both 30° and 90° impact angle. It has been reported that with the addition of hard reinforcement particles in the metal-based matrix, the mode of failure of the coatings depends on the concentration of hard reinforcement particles in the metal-based matrix. Generally, when the concentration of reinforcement exceeds some particular value, the behaviour of the composite coatings changes from ductile to mixed to brittle mode [29]. If the concentration of reinforcement is less than 30wt%, the behaviour of the composite coatings is mainly ductile [26]. From 30 to 60wt%t, the behaviour is mainly mixed, and after 60 wt%, the behaviour changes to completely brittle mode [21].

Figure 14. SEM of the eroded surface of 30N coated GCI at (a) 30°, and (b) 90° angle of impacts.
Download figure:
Standard image High-resolution imageThe schematic representation of the proposed wear model for the 10N coating is presented in figure 15. The solid erodent particles strike at the AL718 splats as most surface areas have been covered with the matrix. The plastic deformation of AL718 splats occurs due to the striking of erodent particles as presented in figure 15(a). The impact of erodent on the splats resulted in the accumulation of debris released from the AL718 matrix at the point of impingement and a chunk of debris gets removed from the surface. The removal of a chunk of debris from the surface is responsible for the crater formation, as presented in figure 15(b).

Figure 15. Schematic representation of wear model (a) plastic deformation of AL718 splats, (b) formation of craters due to repetitive striking of erodent, (c) crack propagation and fracture and, (d) removal of fractured particles.
Download figure:
Standard image High-resolution image
Further, the impact produced by the erodent gets transferred to the un-melted alumina particles and thereby forming cracks and leads to crack propagation and fracturing as shown in figure 15(c). Finally, the fractured particles are removed from the developed coating as presented in figure 15(d). The increased nano-Al2O3 content could hold the AL718 matrix and arrest the cracks by restricting the crack growth, as seen in figure 13(b). The improved cohesion between matrix and reinforcement with the increased nano-Al2O3 content in the developed composite coatings resulted in the improved solid particle erosion resistance.
4. Conclusions
The composite coatings consisting of AL718 and nano-Al2O3 powders were developed by using the HVOF technique on the grey cast iron substrate. The content of alumina was varied from 10wt.% to 30wt.%. in the AL718 matrix. The following conclusions have been drawn from this work:
- The developed coatings showed crack-free interfaces and dense structure, thereby resulting in well-bonded coatings.
- The developed coatings showed porosity in a range of 1.5%–2%.
- The 10N coating showed the lowest surface roughness amongst all combinations of the deposited coatings. The lowest surface roughness of the 10N coating is attributed to the high concentration of AL718.
- The increase in the wt.% of alumina presented an increasing trend in the hardness of coatings and therefore, 30N coating showed a maximum hardness of 1296 ± 40 HV0.2 amongst all coatings.
- The 30N coating yielded higher fracture toughness as compared to 10N and 20N composite coatings. The increased fracture toughness significantly improved the erosion resistance of the 30N composite coatings.
- The higher magnitude of hardness and fracture toughness in the 30N coatings lowers the wear rate when tested at a high temperature of 900 °C at impact angles of 30° and 90°, respectively. The enhanced wear performance of 30N coatings is attributed to the crack arrest at 90° impact angle by the nanostructured coatings. The main wear mechanisms were groove formation, lips, crater and pullout under the mixed mode of erosion.
Data availability statement
All data that support the findings of this study are included within the article (and any supplementary files).