

Abstract
In recent years, the application of fluorescence spectroscopy has been widely recognized in water environment studies. The sensitiveness, simplicity, and efficiency of fluorescence spectroscopy are proved to be a promising tool for effective monitoring of water and wastewater. The fluorescence excitation-emission matrix (EEMs) and synchronous fluorescence spectra have been widely used analysis techniques of fluorescence measurement. The presence of organic matter in water and wastewater defines the degree and type of pollution in water. The application of fluorescence spectroscopy to characterize dissolved organic matter (DOM) has made the water quality assessment simple and easy. With the recent advances in this technology, components of DOM are identified by employing parallel factor analysis (PARAFAC), a mathematical trilinear data modeling with EEMs. The majority of wastewater studies indicated that the fluorescence peak of EX/EM at 275 nm/340 nm is referred to tryptophan region (Peak T1). However, some researchers identified another fluorescence peak in the region of EX/EM at 225–237 nm/340–381 nm, which described the tryptophan region and labeled it as Peak T2. Generally, peak T is a protein-like component in the water sample, where T1 and T2 signals were derived from the <0.20 μm fraction of pollution. Therefore, a more advanced approach, such as an online fluorescence spectrofluorometer, can be used for the online monitoring of water. The results of various waters studied by fluorescence spectroscopy indicate that changes in peak T intensity could be used for real-time wastewater quality assessment and process control of wastewater treatment works. Finally, due to its effective use in water quality assessment, the fluorescence technique is proved to be a surrogate online monitoring tool and early warning equipment.
Export citation and abstract BibTeX RIS
1. Introduction
Over the past few decades, the spectroscopic fluorescence technique has been widely used in environmental monitoring, mainly to analyze water quality [1–4]. This technique has been used as an alternative tool for biological oxygen demand (BOD) measurement, which usually takes five days to execute [5, 6]. Different studies have confirmed trace organic pollutants, in China [7–9]. The trace organic compounds were formerly measured with the help of UV spectra, IR spectrum, and GC- MS [10, 11]. However, the disadvantages of these methods were observed as the requirement of pretreatment of sample, complex procedure, high financial cost, and long-term calculations [12].
Therefore fluorescence spectroscopy as a promising technique is used as a surrogate monitoring tool to identify dissolved organic matter (DOM) [13] in water bodies, wastewater, and waste [14], thanks to its simplicity and sensitiveness. Generally, organic matter (OM) is successfully identified by the fluorescence spectroscopy technique. The composition of OM varies with the type of sewage, time, and weather conditions, the OM from crude sewage, which is the combination of industrial and domestic wastewater, is complicated (table 1) [15].
Table 1. Components of DOM in the wastewater.
| Sr.No | Wastewater components | Percentage (%) of the component of wastewater in organic matter (OM) composition | References |
|---|---|---|---|
| 1 | Proteins | 50%, 12.38%, 15% | [15, 18] |
| 2 | Carbohydrates, | 14%, 10.65 % | |
| 3 | Fats and oils | 10 % | |
| 4 | Priority pollutants and surfactants | trace amount | |
| 5 | Fiber | 20.64% |
The DOM in wastewater is consists of a variety of fluorophores mainly, proteins, carbohydrates, fats, and some other compounds (lipids, humic acids, volatile fatty acids). The researchers have classified these compounds based on their emission spectra [19, 20]. The emission spectra of the compounds less than 380 nm are associated with the aromatic compounds with a limited number of aromatic rings. However, the fluorophore with polyaromatic rings displays emission at more than 380 nm [15, 21]. Therefore it is easy to find the composition of the wastewater by studying the excitation and emission with fluorescence spectroscopy [22].
The general principle of fluorescence spectroscopy can be understood by observing the Jablonski diagram [23, 24] (figure 1), which shows that fluorescence is a type of luminescence emitted from molecules named fluorophores in electronically excited states. Fluorophores absorb the energy of light at a specific wavelength and release it in the form of light again, but with a specific longer wavelength (i.e., lower energy) [24]. The mechanism of fluorescence spectroscopy shows that the molecule in a sample passes through an electronic transition depending upon the molecular structure and bond description. Some atomic bonds are responsible for higher fluorescence characteristics of the molecule. Aromatic compounds with delocalized pi (π) bonds are good fluorophores [23]. The Jablonski diagram represents that all molecules at the ground state are in the lowest possible vibrational state. The sample subjected to fluorescence assessment remains at thermal equilibrium with the environment before it goes for excitation. The sample molecules are excited by high-energy photons from the light source (xenon lamp). The electrons absorb energy and jump to higher energy unoccupied orbitals. This state is the transition state of the molecule between the ground and excited state and can be represented as S1, S2. The molecule's excited state also undergoes various vibrational states (V0, V1, V2, V3) [25]. The molecules reaching a higher energy state begin to lose energy through vibration and return to the lowest vibrational level of their excited singlet state. There are two mechanisms through which the molecule drops at the lowest vibrational level (V0). These are internal conversion or tunneling and the lowest excited singlet state. The energy difference between lower and higher excited states dictates the mechanism utilized [23, 26]. At the lowest excited state S0, the molecule proceeds back to its initial ground state through a series of possible mechanisms such as internal conversion, single-triplet intersystem movement (altering the spin of electrons), or fluorescence. The possibility of the fluorescence is of the molecule depends upon the difference of energy between the lowest excited singlet state and the ground state. The deactivation of high-energy molecules from excited singlet state to ground state tends to emit visible or UV fluorescence [25, 27–29]. Some of the molecules receive energy from photons to reach an excited state; they emit some of the energy while returning to the ground state level, and this emitted energy is termed fluorescence. Fluorescence is generally observed between the first excited state and the ground state for the molecule [25, 29–31].
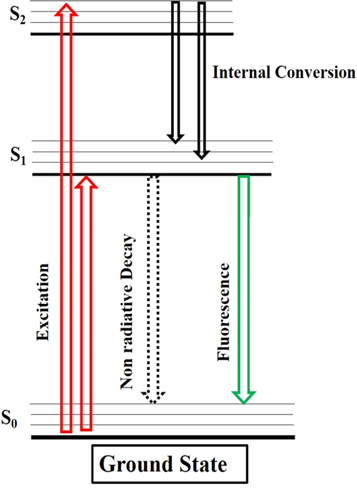
Figure 1. Jablonski diagram, processes of absorption and fluorescence.
Download figure:
Standard image High-resolution imageFluorescence is defined as a process in which a molecule in its ground singlet state (S0) absorbs light whose energy induces electronically excited singlet states (S1, or S2) [29]. Subsequently, the molecule undergoes internal conversion or vibrational relaxation, which implies the transition from an upper electronically excited state to a lower one, lasting from 10–14 to 10–11 s. Emission occurs when the molecule returns to the ground state S0, in 10–9 to 10−7s, through the emission of light with a longer wavelength, determined by the energy difference between the two electronic states [24, 32].
Although the fluorescence spectra are highly sensitive to identifying pollutants at low concentrations, some factors affect quantification correctness. These factors are pH, concentration, metal ion quenching, and temperature. Alkaline pH (≥10) can determine an increase in fluorescence intensity for specimens like raw sewage [33]. Sometimes fluorescence peak wavelength changes significantly because of structural modifications in the fluorophores caused by pH variation; for example, humic substance coil structure at low pH becomes linear at high pH values [34, 35]. Similarly, salinity could cause conformational alteration as it induces charge transfer that increases photoreactivity and fluorescence loss in fluorescent organic compounds [36, 37]. The fluorescence of treated wastewater decreased 30%–40% by changing the pH from neutral (pH 7) to acidic (pH 3) [38].
The temperature has an inverse effect on fluorescence intensity due to internal collision quenching [39]. In general, this effect is reversible as the DOM structure remains stable without chemical changes. However, in some cases, the photodegradation of molecules caused by light exposure might result in a non-reversible temperature effect [40, 41]. Temperature variation affects the medium's viscosity and hence changes the characteristics of fluorophores, respectively [42]. Generally, molecular movement and collision change with the temperature variation. Therefore, to get stable results, thermostatted cell holders avoid the temperature effect [43]. The instrument can work efficiently at room temperature. The temperature can be adjusted by heating or cooling, and the solution must be adjusted at the required temperature before analysis [42]. The temperature also affects the fluorescence of OM in water and wastewater. A temperature compensating tool for fluorescence measurement has been used, which is adequate to minimize the effect of temperature on fluorescence [44, 45].
Specifically, the inner filter effect (IFE) decreases emission quantum yield and distortion of band shape due to the absorption of excitation or emission fluorescence photon through the sample matrix. The absorption of the excitation photon is called the primary inner filter effect, whereas the absorption of emitted photons causes the secondary filter [46]. Another type of IFE is known as the IFE due to other substances. This effect is attributable to the presence of some chromophores absorbing photons in the same wavelength range of the target fluorescent compound [47]. The IFE is one of the impact factors of fluorescence, and it limits the fluorescence intensity. There are two types of IFE based on the absorption phenomena: primary IFE and secondary IFE. The primary IFE is caused due to the absorption of radiations by the fluorophore or chromophore. The radiation absorption by the fluorophore or chromophore in the solution causes the secondary IFE [45, 47]. The spectral distortion observed by the absorption of excited and emitted light represents a non-linear relationship between the concentration and the fluorescence intensity. This phenomenon affects the fluorescence analysis negatively. Researchers are seriously putting efforts into overcoming the IFE in measurement. In some cases, the low concentration solutions were used where IFE is negligible. However, the IFE needs correction at a higher concentration for accurate fluorescence measurement [48].
There are some correction methods to remove the IFE from the measurement and to obtain the real fluorescence. These correction methods include direct correction and parameter correction. In direct correction is done by mathematical correction and instrumental correction. In mathematical correction, mathematical expressions are used to correct the IFE from the fluorescence data. However, the instrumental correction is done with instrument theory. The parameter correction is carried out using various parameters, including absorbance, optical density, and instrumental parameters [49]. An absorbance-based model can correct the IFE; it proposes the dilution of the sample by a factor of 2 if the absorbance value of the wastewater sample is up to 1.5 cm1. The other method is the post-measurement mathematical correction [46, 48, 49].
Metal ions (Cu 2+ , Fe 2+ /Fe 3+ , Al 3+ , etc.) also have a quenching effect by forming a metal ion complex with fluorophore molecules. Unlike thermal quenching, metal ion one generally affects the humic-like substances instead of the tryptophan (amino acid) [33, 50]. Fluorescence quenching consists of two types: static and dynamic quenching. Static quenching is caused by the formation of a complex by the fluorophore molecules at the ground state. The static quenching is temperature-dependent; it can be reduced by increasing the temperature of the system. However, the dynamic quenching will increase on temperature increase. Some mathematical models are proposed to remove the static quenching from the measured fluorescent data [51]. In dynamic quenching, non-fluorescent complexes are formed, and the quencher molecule, like oxygen, deactivates the excited molecule by intermolecular or intramolecular collisions [24]. The fluorescence of some molecules may be quenched as the temperature increases because the higher is the temperature, the more probable it is that the excited electron returns to the ground state without fluorescing. This type of quenching is called thermal quenching and generally affects the fluorophore's fluorescence in the tryptophan region [42]. It should be noted that filtration and dilution of water samples have been used successfully to overcome factors that affect fluorescence spectra. Thus such a technique has a wide range of use in water quality monitoring.
In recent years another use of fluorescence property of chemo-sensors has been used to determine carcinogenic pollutants by employing fluorescent nano-probe. This technique was successfully implemented to determine Cr(+6) in drinking and river water samples. Fluorescent chemosensors such as coumarin derivatives, due to their strong fluorescence properties were used to detect Pb2+ [54]. In addition to waste identification in water, the nanostructures also have application in the wastewater treatment industry. The photocatalytic nature of nanostructures such as Cu2O/TiO2/Ti3C2 was used to remediate polluted wastewater [55, 56]. Similarly, carbon dots (C-dots) are also used for the same purpose as the c-dots showed stable fluorescence properties when examined under various environmental conditions of ionic strength, pH, photobleaching, and different physiological conditions [52]. Some low-cost C-dots chemosensors with high fluorescent properties are obtained from waste which helps identify tracer elements in the environment [53].
Given the remarkable potential of fluorescence-based methods, research in this field has recently taken giant steps forwards so that such signs of progress deserve to be reviewed critically [57]. The use of fluorescence EEMs coupled with Parallel factor analysis (PARAFAC) has effectively improved the fluorescence study of the water and wastewater [58–60]. This model can decompose a large dataset of fluorescence EEMs into components. Based on their concentration, these components provide sufficient information about the type of fluorophore in DOM in water [61, 62]. This model has led the fluorescence to address the measurement problem of trace photochemical and microbial reactions with OM [63, 64]. Therefore the EEMs/PARAFAC have been widely used in recent years for wastewater monitoring [65]. Quality assessment of drinking water, groundwater, surface water (lakes, reservoirs, streams, and rivers), and marine water has become easy with fluorescence spectra analysis [15]. Synchronous fluorescence spectra and function of excitation and emission spectra are functional data analyses that allow studying water quality [15]. Expressly, in recent years components identification by the PARAFAC model has provided essential information to find pollution sources in water [66]. For example, online monitoring of water and wastewater by fluorescence spectroscopy has been proved to be a promising technique for organizational and industrial use [61, 67–69]. However, there is notable literature on fluorescence spectroscopy applied as an in situ monitoring tool for water and wastewater. In addition, such a technique has been utilized as an early warning tool for wastewater treatment plants (WWTPs) fouling or detecting contamination events in water bodies [70].
In this review, we discussed the current situation of fluorescence technology and its application in water research. The significance of fluorescence technology for online monitoring of water and wastewater has been described in detail. In the current paper, section-2 covers the study of organic matter (OM) and dissolved organic matter (DOM) in water bodies. In section-3, the fluorescence characteristics of different water bodies, including rivers, lakes, and other water channels, are discussed. The fluorescence characteristics of wastewater and waste is described in section-4. Then the section-5 describes the fluorescence technique as a possible monitoring tool. Finally, in section-6, the review has been concluded.
2. Fluorescence characterization of organic matters
The fluorescence technique is a powerful tool for the characterization of organic matter (OM) in the aquatic environment (lakes, rivers, streams, and marine sources) [66]. Organic matter in water is mainly composed of two fractions, dissolved and non-dissolved, obtained by isolation technique using filters (0.1–0.7 μm). The dissolved organic matter (DOM) is the fraction of OM that can pass through the filter, whereas particulate organic matter (POM) is retained on the filter. DOM is generally originated from three primary sources: (a) allochthonous or terrestrial material from soils, (b) autochthonous or surface water-derived of algal or phytoplankton origin, and (c) synthetic organic substances of fabricated or industrial origin. DOM in natural waters is composed of a heterogeneous mixture of organic compounds with smaller molecular weights [71, 72]. The availability of OM for microbial transformation depends on the stabilization factors such as physical, biochemical, and chemical stabilization. The physical stabilization provides lower access of OM by microbes in soil and landfill leachate environments [73]. The OM with complex organic compounds including lignin, lipids, and polyphenols are more stable, referred to as biochemical stability of the OM. The formation of complexes of organic compounds with metals and other inorganic compounds in OM is termed chemical stability. Therefore, the metal complexes with organic compounds through intermolecular attraction forces affect the fluorescence of OM. Which can be reduced or corrected by filtration or pretreatment of wastewater samples before fluorescence measurement [4].
On the other hand, POM is composed of plant debris, algae, phytoplankton cell, bacteria, etc. The EEM of DOM found in the natural ground and surface waters is referred to as natural organic matter (NOM) [13]. Organic matter is one of the key components in water analysis to describe the extent and type of water pollution [74–76]. It can help to determine the suitable water treatment process and improvement of the available treatment process.
2.1. Dissolved organic matter
2.1.1. Humic-like substances
Humic-like substances are naturally derived from plant materials through chemical and biological processes entrenched in aquatic (water bodies and leachate) and terrestrial (land and soil) environments [22, 77–79]. As per solubility of these substances in water at different pH, the humic-like substances can be further divided into three types: (a) humic acids that are insoluble in the water below pH = 2 and soluble above pH = 2 (b) fulvic acids, water-soluble in all pH ranges, and (c) humic acids, which are not soluble in all conditions of pH [77, 80, 81]. Humic substances (fulvic and humic acids) of terrestrial origin are the dominant DOM fractions in freshwater and coastal seawater [82]. Differently, autochthonous fulvic-acids (or marine humic-like) of algal or phytoplankton and bacterial origin are the essential DOM fractions in lakes and oceans [83]. Besides, among the major classes of DOM components, there are carbohydrates, proteins, amino acids, lipids, phenols, alcohols, organic acids, and sterols. DOM is recognized as the larger pool of organic matter in a variety of waters, including more than 90 % of total organic matter [13, 59, 84–86].
2.1.2. Protein-like substances
Proteins and peptides are identified by fluorescence by three kinds of amino acids, i.e., tryptophan, tyrosine, and phenylalanine [39, 71]. These amino acids generate fluorescence due to the presence of homocyclic (e.g., benzene) and heterocyclic (e.g., indole group containing nitrogen), aromatic moieties [87, 88]. The protein-like fluorescence study can identify bacterial and algal tryptophan characteristics in the emission wavelength, indicating microbial activity of biological products and organic substrates [87, 89–92]. The protein-like and humic-like fluorescence can be identified in a distinct fingerprint region. The fluorophores may be further determined after fractionating their chemical features (e.g., hydrophobic or hydrophilic; acidic, basic, or neutral) [71, 72, 93, 94].
2.1.3. Data analysis of fluorescence spectra
In recent years, excitation-emission matrix (EEM) and synchronous fluorescence spectra have been used widely as analytical techniques to study fluorescence spectra [15]. In synchronous fluorescence spectra, the EX/EM wavelengths are measured at fixed intervals [95]. By scanning the excitation and emission simultaneously, the synchronous fluorescence spectra (SFS) are obtained, the study of which presents some advantages such as spectral simplification, narrowing of bandwidth, reduction of scattering interference, and relatively improved resolution. SFS offers an effective technique to increase analytical selectivity with high sensitivity. Therefore, SFS has been an attractive tool to analyze multi-compound complex samples [19, 96]. The EEM technology allowed detection in a short time (<1 min) through emission scans from a single sample and at incrementing EX wavelengths arranged in a grid (EX, EM, and intensity) [59]. Data obtained by EEM provide more details thanks to a series of repeated emission scans recorded in a range of excitation and emission wavelength.
Furthermore, the analytical technique for such detailed data is easier to find the peak by parallel factor analysis (PARAFAC) and self-organizing maps (SOM), which is helpful in wastewater monitoring [97]. The mathematical trilinear data have been used to explain the PARAFAC model for the component identification in water. The fluorophore differentiation in PARAFAC by EX/EM is determined as components [66]. The fluorescence properties are helpful to determine the efficiency and fouling of the treatment plants. The component identification of wastewater by PARAFAC model with four components model was applied to identify the organic matter, and represent three humic-like and protein-like components [70, 98]. This technique of analysis of fluorescence data is useful to find out the components in water bodies, and these components lead the scientists to specific pollutants in water bodies.
Fluorescence PARAFAC modeling is a powerful tool for recognizing specific water components impacted by sewage or industrial effluents [77, 99]. Five fluorescence peaks are recognizable in a freshwater system, including Peak A, Peak B, Peak C, (Peak C1, Peak C2) Peak T1 and Peak T2. Among these peaks, Peak A is the humic-like substance with EX/EM 237-260 nm/400-500 nm, and this region generally contains natural organic matters or polyaromatic compounds. The second is Peak B with EX/EM 225-237 nm/309, 321 nm, and 275/310 nm which describe the presence of Tyrosine-like compounds in the samples. The third form of the peak is named Peak C, which is referred to humic-like substances with EX/EM 300-370 nm/400-500 nm, which is further divided into two sub-peaks named Peak-C1 with EX/EM 320–340 nm/410–430 nm and Peak-C2 with EX/EM 370-390 nm/460-480 nm. The fourth fluorescent peak is labeled as Peak T1, which describes tryptophan-like material in the water samples, and the fluorescence EX/EM is observed at 275 nm/340 nm. The fifth peak was labeled as Peak T2, which describes the tryptophan region with EX/EM at 225-237 nm/340-381 nm. Generally, peak T is referred to the protein-like component in the water sample [6, 83, 100]. Protein-like (Tryptophan) fluorescence assesses water quality standards [101], particularly in urban rivers impacted by WWTP and other activities with strong tryptophan-like fluorescence along with two humic-like components (C1 and C2) [102].
These fluorescent components offer information on the water quality, where the protein-like (C3) region was proposed to be used as online monitoring of fouling events in river water [103]. These studies show the significance of protein-like components as a promising surrogate fluorescent description for online monitoring of water bodies ahead of conventional methods to detect anthropogenic activity. The components studied by the PARAFAC model in water are briefly described [59, 77]. Generally, peaks A, C, and M are labeled as humic-like substances, whereas A has been associated with the terrestrial humic substance, C as humic-like, and M as marine humic substance (table 2). Similarly, two peaks associated with the protein-like region are labeled peak T for the tryptophan region and peak B for the tyrosine region. The description of peak locations in water analysis by fluorescence provides essential information about the nature and origin of the pollutants in water. Therefore, the scientists in water research pay attention to the peak location and label to categorize the pollutants in the water sample easily.
Table 2. Characteristics of the components identified in previous researches.
| Descriptions | Components studied | Excitation (nm)/Emission (nm) | Peak label |
|---|---|---|---|
| Humic substance | C1 a,b,c,d,e,f,g,h,I,j,l,m,n,o,p,q,r | 260-360/480, 390/472, <240/522, 350/410-420 | A |
| Terrestrial | C2 o,q | 250-275(280-400)/370-500,237-260/400-500, 260(360)/480 | Fulvic acid |
| C3 g,p | 250/405, 240 (320)/428, 280/350-360, 270/460, <240/522 | ||
| 330-339/430-434 (330-339/430-434), 240-310/400-450 | |||
| 325/426, | |||
| Humic substance | C1 I,q,r | 250-320/410, 270(360)/478, 310/392, <240, 300 420, ˜325/380-410, 250-300/320-410, 300 e370/400 e500, | C |
| C2 a,b,d,e,g,h,I,j,m,o,p | 250(320)/410, 250 /450 and 350/450, 240 (320)/428, | Humic acid | |
| C3 b | 200-370/280-500, 270/460, <240, 300/420, | ||
| G2 c | 272-281/437-440 (249-259/434-443), | ||
| PC1 l | |||
| Humic- substance | C2 i , C3 a | <250-330/420, 350/428, <240, 310 432, 270/400(490), | M |
| C4 b,d , G3 c C6 a | <240, 310/432, 325(250)/416 | Marine-like | |
| Protein like (Amino acid) | C2 j | <250-290/360, 278/348, | N or T (biological activity) |
| C4 a, I, r | 280(<240)/368,280/344,275/340(T1), | (Tryptophan) | |
| C5 b,d,j,m | 225-237/340-381(T2), | ||
| In-situ k | 280/344, | ||
| G4, G5, G6 c | 290/352 | ||
| C3 e,f,g,h,l,n,o,p,q | 280-290/305-350,275/340,220-280/350,280/330,281/348-359,225-280/340,300/350(T1),225/350(T2),300/350(T1), 225/350(T2) | ||
| 250-300/320-410, 340/390(in-situ),260/360 | |||
| Protein-like (Amino acid) | C3 e,q | 280-290/305-350,225/350, | B |
| C7 a,c | 270/306, 270/304, | (Tyrosine) | |
| G4 c | 250/428, | ||
a [59]. b [77]. c [104]. d [105]. e [106]. f [107]. g [108]. h [102]. i [109]. j [110]. k [111]. l [105]. m [112]. n [103]. o [113]. p [84]. q [114]. r [115].
These fluorescence peak descriptions of different compounds with EX/EM wavelength regions are mentioned in figure 2 illustrating the peak label with wavelength region discrimination [21, 116, 117].

Figure 2. Fluorescence peak locations of chemical compounds in protein-like and humic-like regions.
Download figure:
Standard image High-resolution image2.2. Characterization of DOM in wastewater
Fluorescence spectroscopic technique can detect the DOM of water at a temporal scale [5, 13, 39]. This technique is becoming widely utilized thanks to the rapid collection of data with small sample volumes (< 5 ml) and non-destructivity, which are advantageous characteristics as a surrogate monitoring technique for characterization of DOM in wastewaters [13, 100, 118, 119]. The composition of DOM in wastewater is very complex. Therefore the EEM data generally show strong peaks at the humic-like and the protein-like regions [20]. The protein-like DOM is generally associated with municipal and industrial effluents. Fluorescence EEM has been used to identify textile industry discharge in water bodies with protein-like peak (Tryptophan Peak T), Tyrosine (Peak B); by applying component identification model (PARAFAC), additional two peaks as C1 and C2 were identified. These fluorescence peaks were typical of the textile industry as the sampling was performed in 12 wastewater treatment plants impacted by textile effluents [120].
Similarly, the EEM of sewage impacted water DOM have additional peaks at EX 375 nm, 350 nm, and 330 nm for EM of 410-450 nm, which could be ascribed to optical brighteners (used in washing powder) [121]. Wastewater treatment is capable of removing about 40%–80% of optical brighteners. Thus, the release of these chemicals in river water at low concentrations (approximately 0.5 mg l−1) can be identified in the protein-like peak location [100, 122, 123]. The wastewater effluent investigation by EEM was also used to identify the dissolved organic nitrogen and bioavailable dissolved organic nitrogen [124]. Fluorescence intensity can monitor DOM removal processes because the decrease in fluorescence intensity is associated with DOM removal. Therefore, such a technique is helpful to identify pollution sources but also helpful to check and monitor wastewater treatment processes [125].
3. Fluorescence characteristics of water bodies
The significance of fluorescence spectroscopy as a potential technique to assess water quality is its unique and distinct features to characterize the DOM in water bodies [41, 77, 84]. Compared to the conventional water quality parameter like BOD, DOC, Nitrate, and phosphate, fluorescence intensity at EX/EM 275/350 nm protein-like provides an alternative water quality index for DOM in river water [111], as well as for groundwater pollution originated from irrigation and agriculture [112].
3.1. Fluorescence characteristics of clean water bodies
Most of the potable water around the world is obtained from surface waters. However, in quite a few countries drinking water mainly comes from groundwater [22, 71, 100]. Drinking water facilities are monitored by studying the fluorescence characteristics of organic matter in water sources [104, 126]. Organic matter in drinking waters has been characterized by fluorescence spectroscopy in a typical humic-like area, similar to the natural waters [5, 13, 39]. The fluorescence spectra for natural water show excitation at 320 nm with maxima at less than 240 nm and emission at 428 nm, which is considered a humic-like region (C-peak) [71, 78, 100]. The excitation and emission maxima at a lower wavelength (315 nm, 384 nm) but similar to C-peak are characterized as M peak, which overlaps to humic-like fluorescence [127]. This phenomenon previously was thought to be identified with oceanic water, but the latest studies have also identified it in the freshwaters, usually impacted by agriculture activities [78, 83, 127]. Another fluorescence fingerprint region that characterizes the surface water is found at two excitation maxima (270 nm and 400 nm), while the emission at 490 nm is referred to as terrestrial soil organic matter [77]. In the case of waste impacted water bodies, the fluorescence spectra show an additional peak with excitation at 278 nm and emission maximum at 348 nm, which is a typical protein-like fluorescence area and identified as tryptophan (T-peak) [71, 88, 128]. Some researchers have noted that the use of fluorescence spectroscopy for water quality monitoring compared to standard laboratory measurement is a potentially useful replacement for identifying pollution [5, 13, 39]. This technique has been utilized to monitor contamination in drinking water and is recognized as an advanced practical tool to study wastewater biological oxygen demand (BOD) correlated to organic matter (protein-like substance) in natural and sewage impacted surface waters [13, 39, 100, 119]. The three-dimensional fluorescence spectra of drinking water before pretreatment and those after pretreatment showed that only the meaningful part could be retained (figure 3). These fluorescence scans are essential in determining water quality based on fluorescence patterns [129].
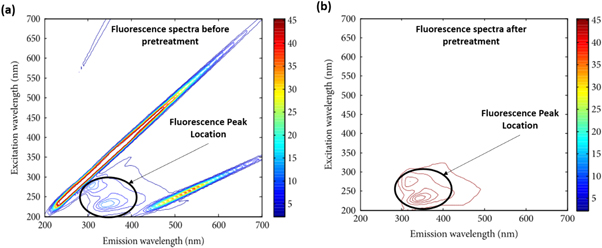
Figure 3. Fluorescence EEM spectra of background drinking water samples (a) before pretreatment (b) after pretreatment [129].
Download figure:
Standard image High-resolution image3.2. Fluorescence characteristics of water reservoirs
The fluorescence spectroscopy in water quality research has been used as a key technique for characterizing natural water, polluted water, and determining the efficiency of treatment plants in urban areas by characterizing the organic matter [1, 2, 4]. Due to its sensitivity, this technique is very effective in identifying contamination in a short time [6, 119] and could be used as a potential monitoring tool for surface water and municipal water supply systems [3, 13]. The component identification of water bodies by PARAFAC model showed three components in some studies, these components are component-1 (peak at 322 nm/407 nm Ex/Em), whereas component-2 and component-3 (360 nm/425 nm and 294 nm/320 nm) respectively [77, 99].
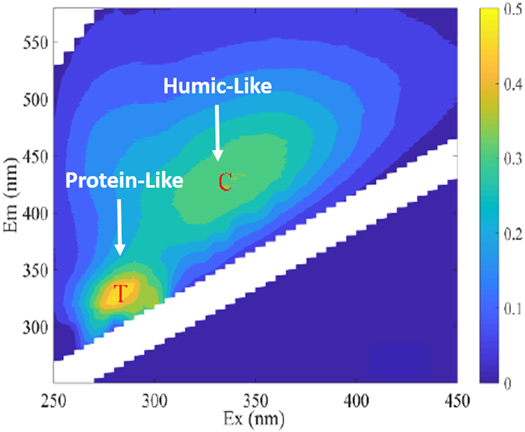
The parallel factor analysis of fluorescence EEM in water study of Lake Kinneret and rivers, including its catchment basin (Jordan River, Dan, Banias) and Yarmouk, is adequately characterized by using two humic-like and one protein-like component [130]. Similarly, the parallel factor analysis of different lakes shows six components (C1, C3, C4, and C5), one for in situ protein-like and another protein-like [61, 110]. The boreal lake survey suggests that DOM reactivity depends on the duration of time to get through the entire region rather than temperature. Runoff in the boreal lake contributes to higher DOM with a strong fluorescence signal at a humic-like region [131]. The PARAFAC analysis was used to observe the DOM characteristics of Taihu lake and Hongze lake water samples. The analysis showed two specific peaks appeared at humic-like (Peak C) and protein-like (Peak T) region, where the peak C indicates terrestrial, anthropogenic sources whereas peak T showed autochthonous origin (figure 4) [132]. These studies corroborated fluorescence spectroscopy as a useful tool for the quality assessment of water sources and origin identification of pollution in water.
Figure 4. Fluorescence EEMs spectra showing, Humice like DOM (Peak C) and protein-like DOM peak (Peak T) in water samples of the littoral zones of Lakes Taihu and Hongze [132].
Download figure:
Standard image High-resolution image
Moreover, the seasonal effect on DOM concentration in water has also been identified in the study of Erhai Lake, which explained the observed higher sedimentation in the dry season than in the wet one. The DOM content comprised humic-like and protein-like substances, and the results indicate that the protein-like are abundant in the dry season. The possible source of DOM in the lake during the dry season is terrestrial, while in the wet season, it is influenced by terrestrial and biological sources. The external pollution and aquatic plants impact the DOM composition of the sediments in Erhai lake [133]. Similarly, in a study of Lake Taihu, the fluorescence intensities by using the PARAFAC model were categorized into four main components C1 (Ex/Em 280/320 nm) C2 (Ex/Em 295(233)/405 nm), C3 (Ex/Em 240/455 nm) and C4 (245/340 nm). Where C1 belongs to Tyrosine (amino acid), C4 is related to Protein like material (Tryptophan), and C2 and C3 are described as Humic-like (C2 Humic material from the microbial process and C3 Terrestrial humic-like substance) [134]. The fluorescence spectroscopy is also helpful in source identification, such as the upstream pollutants were the primary source of the CDOM distributed throughout the Xinjiang reservoir. Three components were identified using EEM and the PARAFAC model: humic-like, tyrosine-like, and tryptophan-like substances. A highly significant linear relationship was found between the CDOM concentration and the maximum fluorescence intensities of the humic-like component and the tyrosine-like component [135]. The fluorescence characteristics of polluted water reflect irrigation and agriculture activities as DOM sources for groundwater, [112] which relates to monitoring protein-like (C3) for detecting online fouling in river water to detect the online-fouling in river water [103].
Surface water supplies are increasingly affected by wastewater discharges adding to the DOM composition of receiving reservoirs, such as lakes and rivers [136, 137]. Therefore a study has been done to investigate the quality and quantity variation of five DOM along with wastewater treatment plants (WWTPs), a river-like continuum. The results showed that the variation in DOM receiving water sources is linked to discharge from WWTPs and external input of DOM [138].
4. Fluorescence characteristics of wastewater and wastes
The use of fluorescence EEM is recognized as a rapid monitoring technique for the characterization of DOM in wastewaters to collect data from specimens with shallow volumes (<5 ml) in a non-destructive way [118]. This technique is widely used to monitor sewage impacted rivers by characterizing the protein-like substances in DOM [13, 100, 119].
4.1. Sewage and municipal wastewater
Fluorescence spectroscopy has become a promising technique to identify pollution sources in surface waters, like domestic sewage in the urban and peri-urban rivers. Urban activities influence the water quality of WWTP upstream river and downstream water, which is impacted by WWTP effluent [139]. Nevertheless, in urban river WWTPs, agricultural runoff (nitrates) and effluents from industrial processes could also contribute to water pollution. For example, humic-like substances due to wood processing in the paper mill and polycyclic aromatic hydrocarbons (PAHs) from steel mills were identified as a source of pollution by fluorescence EEM [139, 140]. Specifically, DOM originated by sewage pollution typically has additional peaks at excitation 375 nm, 350 nm, and 330 nm and emission at 410−450 nm, which have been identified as optical brighteners commonly used in washing powder [121]. About 40%–80% of optical brighteners are being removed by wastewater treatment. However, these are still present in river water at low concentrations of approximately 0.5 mg l−1 [100, 122].
Various studies proposed that fluorescence characteristics of sewage effluent were associated with soluble microbial products and extracellular polymeric substances in the protein-like (peaks T1, T2) and humic-like (peak C1) regions [38, 141, 142]. Different pollutants in water from waste produce different fluorescence spectra, e.g., tryptophan-like fluorescence obtained from PAHs or related substances associated with untreated domestic sewage [140] and humic-like fluorescence obtained from optical brighteners in greywater [143]. The fluorescence signatures used to track water pollution and distinguish the DOM source in sewage impacted water were investigated [100, 144].
The water quality of reservoirs provides unpolluted natural water, but the DOM components are linked to the humified terrestrial materials originating from plants, and soil decay [85]. Humus structure is closely related to fluorescence characteristics of DOM [59, 86]. However, humus identified in reclaimed water has the same root source as the excess sludge of WWTP [13, 84]. The fluorescence characteristics of DOM in sewage impacted water correlate among the various sample sites, with upstream of WWTP and downstream through urban areas with the quality deterioration of water [111]. On studying the fluorescence characteristic of wastewater, it can be concluded that Tryptophan-like (T1 and T2) fluorescence was rich in sewage water and different from natural reservoirs and rivers, where Peaks C1, C2, and A predominate [1], thus promoting the fluorescence technique as effective technique for water quality monitoring [104, 126]. The EEM spectra indicated the presence of three different fluorophores, centered at EX/EM wavelength pairs of 250 − 280/315 − 350 nm, 340 − 350 nm/400 − 450 nm and 420 – 450 nm/470 − 530 nm, in municipal solid waste (MSW) during anaerobic degradation and landfilled leachate. These fluorophores are recognized, respectively, to have protein-like, fulvic-like, and humic-like structures. Similarly, a water quality study demonstrated that labile organic compounds produced by microbial activity consist of significant DOM components in the drinking water reservoir [145, 146]. These studies prove that the spectroscopic fluorescence technique is suitable for detecting the discharge of organic matter pollutants into the river and shows the characterization of peaks per different types of pollution [147, 148].
4.2. Industrial and other wastes
Various industries emit their specific pollutants (table 3) through their effluents [149]. The industrial effluents such as paper, pulp, food, brewery, steel, manufacturing, textile, and chemical encompass different compositions of wastewater due to different processes involved, such as raw material, production, packaging, and waste emission [61, 150]. In the urban river, pollution sources are agricultural runoff (nitrates), wastewater streams, and effluents from industrial processes [139, 140]. These different sources were identified with fluorescence spectroscopy by characterizing organic matter in polluted water channels [68, 147, 148]. The organic pollutants define the characteristics of wastewater and can be used to reveal their source. For instance, high bromide concentration in waters is often due to mercury emission control from coal power plants [151]. Likewise, boron can also be used to determine the source of water pollution, as it has less clarity by the wastewater treatment plant [152]. The fluorescence study of anaerobic co-digestion of food waste from the food industry and landfill leachate in a single-phase batch reactors process gives the emission wavelengths <300 nm. Fluorescence peak location of excitation wavelengths 250–280 nm and emission wavelengths 300–320 nm is related to soluble microbial byproduct-like materials [150]. The fluorescence Peak location at EX < 250 nm and EM < 380 nm is related to pure aromatic proteins (tyrosine and tryptophan) [153].
Table 3. Fluorescence EX/EM wavelength region of pollutants in water.
| Pollutants | Fluorescence Excitation/Emission (nm) | Stokes shift | Quantum yield | References |
|---|---|---|---|---|
| Benzo[c]phenanthridines | 379/432 | 53 | 0.14 | [155] |
| 8-Hydroxy-2'-deoxyguanosine | 255/353 | 98 | 2.3 | [156] |
| Resazurin | 530/590 | 60 | [157] | |
| Calixarene-2 | 350/565 | 215 | [158] | |
| 1,2 Naphtoquinne-4-sulfonc acid | 270/400, 360/580 | (130) (220) | [159] | |
| Naphthalene | 220/334 | 122 | [63, 160] | |
| Pyrene | 270/392 | 50 | ||
| Fluorene | 260/310 | 116 | ||
| Phenanthrene | 250/366 | (137) (157) | ||
| Anthracene | 245/382, 245/402 | (115) (135) | ||
| Benzo[a]anthracene | 275/390, 275/410 | (123) (113) | ||
| Benz[e]pyrene | 275/398, 285/398 | (169) (113) | ||
| 2-phenyl phenol | 245/414, 280/414 | (114) (59) | ||
| Carbaryl | 220/334, 275/334 | (112) (59) | ||
| Thiabendazole | 240/352, 295/354 | (25) (25) | ||
| o, m xylene, p-xylene | 260/285, 265/290 | [161] | ||
| Benzene | 255/280 | 25 | 0.1 | [21] |
| Toluene | 260/285 | 25 | 0.11 | |
| Ethylbenzene | 250/305 | 55 | 0.1 | |
| Isopropylbenzene | 260/285 | 25 | 0.1 | |
| Anisole | 270/295 | 25 | 0.11 | |
| Aniline | 280/340 | 60 | 0.1 | |
| Benzaldehyde | 270/300 | 30 | 0.1 | |
| Benzonitrile | 255/280 | 25 | 0.1 | |
| 2-phenyl ethanol | 255/280 | 25 | 0.11 | |
| Methyl benzoate | 275/310 | 35 | 0.09 | |
| Fluorobenzene | 255/280 | 25 | 0.091 | |
| Chlorobenzene | 260/290 | 30 | 0.08 | |
| Bromobenzene | 265/295 | 30 | 0.0085 | |
| Iodobenzene | 270/300 | 30 | 0.0075 |
A specific fluorescent region (Ex/Em 380/440 nm) was previously reported for lignin, cellulose, and paper fluorescence in cardboard spectra. Furthermore, a second peak, located at (Ex/Em 270/440 nm), was probably due to the inner filter effect of the lignocellulosic fluorophores on the protein-like signal. These two fluorescent regions in cardboard spectra matched the ones observed on municipal solid waste spectra [149]. Besides, fluorescence peaks in the region of excitation wavelength 250-300 nm and emission wavelength 280-320 nm were related to soluble microbial byproduct-like materials [150, 154].
5. Fluorescence technique as a possible monitoring tool
The fluorescence EX/EM and intensity of water body samples are highly dependent on the origin, surroundings (urban or rural), and activities (industrial, agriculture, airport, etc., [101, 162]. DOM two- and three-dimensional spectra have helped to point out the concentration and nature of the DOM employing both offline and online monitoring of waters [71, 163, 164]. The dominating fluorescence spectra of samples from the riverine system show the availability of humic-like substances. At the same time, protein-like substances were also identified in surface water (riverine water) depending on the location and contributing water into the mainstream [111, 165, 166]. Protein-like fluorescence intensity has become an easy, simple, quick, and efficient tool for measuring surface water and groundwater quality, contributing to preventing the use of polluted water by humans [167, 168].
As a helpful monitoring tool in identifying sources of pollution, fluorescence spectroscopy has been applied to identify WWTPs fouling events and provide information for process control [144]. The technique has been proved to be a reliable tool to detect allochthonous contamination in the water bodies [70, 71, 169, 170]. Finally, fluorescence spectroscopy has proved to be a novel online monitoring instrument for rapid water quality measurements. Although it has revolutionized water studies, further research is required to identify the particular fingerprint region excitation and emission wavelength spectra for other specific pollutants/chemicals.
5.1. Potential wavelength regions for online monitoring
Fluorescence is used to predict the presence of pollution in surface water bodies. With the development of precise sensors, the capacity to monitor online water characteristics has been improved significantly [171]. The fluorescence spectroscopy as a susceptible instrument [115] can be used as an effective field instrument with PARAFAC modeling and component study to characterize the type of contamination in water [109]. The fluorescence spectra of water bodies contaminated with wastewater have appeared to be very sensitive for determining the DOM, with one excitation and two emission wavelengths applying PARAFAC modeling [109]. The fluorescence monitoring was more efficient than UV254, pH, and DOC to identify the quality of potable water and wastewater treatment plants. For online contamination monitoring, peak T (protein-like) measurement is a more effective method [59, 168, 172]. Furthermore, it offers a convenient way to monitor the water quality as an early warning instrument by measuring only the protein-like component (tryptophan) [109].
The EEM fluorescence principal component approach is reported as a possible monitoring tool for identifying the fouling events at a shallow organic carbon level, offering a priority over other conventional (chromatographic), methods in off-line monitoring (nearly real-time monitoring) [173, 174]. These modern data analysis techniques have led to the rapid detection (<1 min) of three-dimensional excitation-emission matrices, which includes a complex of emission scans generated from a single sample and recorded at incrementing excitation wavelengths arranged in a grid (excitation, emission, and intensity) [59, 70, 163].
5.2. Online monitoring fluorometers
The fluorescence spectroscopy for its higher efficiency control has become a surrogate online monitoring tool for identifying DOM in water since its sensitivity provides an opportunity to measure a low NOM concentration [59, 130]. As a potential online monitoring tool, it can identify protein-like components with a fraction of biopolymers containing nitrogenous compounds, allowing the opportunity to modify the technique for real-time monitoring [59]. Different studies suggest that monitoring protein-like fluorescence at peak T (Ex/Em 300 nm/350 nm) identifies the contamination as a unique property in wastewater studies [113]. Studies proved the dominated protein-like substance is directly related to the allochthonous source due to effluent addition to the natural water system. It shows the seasonal variations in the lake and river water systems [130].
Freshwater applications, including tracking sewage-derived drain in rivers [2, 100] and fluorescence sensitivity, have been recognized, more recently through its use as in situ spectrometers for monitoring [101, 162]. It can be concluded that protein-like fluorescence at peak T (Ex/Em 300 nm/350 nm) is a potential surrogate property for the detection of contamination in wastewater studies [113]. In situ fluorometers have been used to monitor cyanobacteria in water in near real-time [175].
The portable fluorescence spectrophotometer was used as a pollution monitoring tool in measuring the contamination in river water and wastewater treatment plant effluents by studying the tryptophan-like fluorescence [111]. The research to identify the microbial quality of the river water has become more accessible by applying a handheld spectrophotometer studied in KwaZulu Natal, South Africa [167]. This technology is simpler for identifying microbial content, including E. coli in Umegni water than standard laboratory methods for determining the water quality [176]. The handheld fluorimeter (SMF-4, safe training system, Wokingham, UK) is used to identify the fluorescence spectra, the samples were collected, and on sight, the measurement was taken without the filtration of water, so to retain the microbial content in the sample for measuring the sample in its natural environment [176].
6. Conclusion
Generally, water and wastewater quality are measured by a series of testing of various parameters, including physical, chemical, and biological. These parameters due to longer time and complicated procedures are not useful for online monitoring or quick assessment of water quality. Therefore to cover this gap the use of fluorescence spectroscopy for water quality monitoring has gained much attention, due to its simple, easy and efficient technique. The use of fluorescence spectroscopy provides an advantage over other techniques as the measurement is background-free, unlike absorption spectroscopy, with a detection strength of a very small amount of concentration. The fluorescence technique is selective and specific due to the unique photophysical properties of the analyte. Therefore, fluorescence spectroscopy in water quality assessment has been widely used in the wastewater treatment industry and water resource (river, lake, sea, etc.) monitoring.
This review covers the application of fluorescence techniques for water and wastewater, and it also describes the significance of fluorescence spectroscopy as potential monitoring and early warning tool for water quality assessment. In general, the samples taken from water bodies are highly dependent on the origin, surroundings (urban or rural), and activities (Industrial, agriculture, airport, etc.) [101, 162, 177]. The fluorescence technique has proved to be a suitable tool for detecting the allochthonous contribution in the water bodies [71, 169, 170]. The characterization of DOM in water by fluorescence has helped scientists assess its concentration and nature by both offline and online monitoring of waters [71, 163]. The dominating fluorescence spectra of water bodies studied in the riverine system show humic-like substances' availability, while protein-like substances were also identified in riverine water depending on the location and contributing water channels to the river [111, 165, 166]. Protein-like fluorescence intensity in the application of handheld fluorescence has become an easy, effortless, quick, and efficient tool for measuring surface and groundwater quality. The applications of fluorescence spectroscopy help in preventing the accidental use of contaminated water by the human population. Furthermore, this technique is contributing to saving lives through its simple, immediate results to identify microbial pollution (E.coli) [167].
Although it has transformed water monitoring studies, further research is required to identify the specific fingerprint region in a complex wastewater media for each pollutant based on molecular structures. It is difficult to discriminate the extent and nature of pollution in real-time highly polluted water. Future research may be needed to study the fluorescence spectra by data extraction and computer modeling for effective online monitoring.
Acknowledgments
We are thankful for the support for this work by the Independent Research Program of Tsinghua University (20131089252) and the National Major Scientific Instrument Equipment Development Project (2017YFF0408500) Beijing, China.
Data availability statement
No new data were created or analyzed in this study.
Conflict of interest
The authors have declared that no conflicting interests exist in this article.