

Abstract
DNA methylation plays an important role in development process which contributes to genome stability and also regulates gene expression and gene silencing. Detection of genome regions with altered 5-methylcytosine distribution at a genome-wide scale is very important for early detection of gene silencing related diseases. In the present study as a continuation of studies on DNA methylation, the interactions between graphene quantum dots (GQDs) and unmethylated and methylated deoxyribonucleic acid (DNA) fragment were investigated. Based on above interaction a novel GQDs-DNA nanoassembly was developed. Two types of DNA including unmethylated and methylated sequences were interacted with GQDs and contributed to the formation of unmethylated and methylated nanoassemlies. Analysis of the interaction indicated that the GQDs could bind to DNA fragments and led to different fluorescence pattern in two different mechanisms and could provide an efficient biosensing platform for label free and sensitive fluorescent assay of DNA. The excitation and emission wavelengths of experiment were 380 and 480 nm respectively. Fluorescence intensity of unmethylated DNA concentration were detectable from methylated DNA in linear range from 10.0−10M to 10.0–6M and the detection limit was estimated at 7.3 × 10⁻¹¹ M. Above interaction was not observed in methylated DNA, indicated of distinguished interaction effect. Herein we further showed that GQDs could induce B-DNA to A-DNA form in methylated structure of DNA. The methylation sensitivity of the experiment was also testified by methylation sensitive restriction process. It was assumed that the involvement of methylation alteration in DNA structure could alter not only mechanism of DNA/GDQs interaction but also helical structure of DNA.
Export citation and abstract BibTeX RIS
Introduction
The main epigenetic modification in mammals which widely has been studied is DNA methylation. DNA methylation resulted from the covalent addition of a methyl group from the methyl donor S-adenosylmethionine to the carbon-5 position of cytosine within the CpG dinucleotide. Advances in biosensor technology during recent years include development in medical diagnosis and analytical systems in order to detect and determine the quantity of biological molecules such as DNA and proteins. Application of nanomaterials in biosensors could help the biosensors to enhance the performance of them and promote recognition sensitivity of biomolecules e.g. DNA methylation detection [1–4]. The interface between biological elements and conducting nanomaterials could create the specific interaction and resulted to efficient recognition and developing of hybrid biosensors [5–7]. These specific interactions could also provide label free detection of biomolecules.
Nanomaterials could improve the performance of biosensors through increasing their sensitivity and lowering their detection limits. These benefits originated from their high specific surfaces which enable them to immobilize more amounts of biomolecule receptors. The particular properties of such biosensors can be tuned and adjust by selection of desired shape or size of nanoparticles [8–17].
In recent years, graphene has attracted special attention owing to its excellent properties such as electronic, thermal, optical and mechanical characteristics [18]. It has been found that graphene oxide (GO) can be used as a quenching agent to quench the fluorescence of fluorophores thus many scientists attempt to make fluorescence sensing platforms based on graphene oxide for biological molecule detection [19]. Interesting interaction of DNA and graphene and carbon dots nanoparticles could inspire the introduction of novel methods for DNA [20–22] and aptamer [23, 24] based biosensors.
Graphene quantum dots (GQDs) showed many advantages due to the additional unique properties that arise from their nanoscale small size and had excellent performance in photovoltaic devices, drug delivery and biological imaging [25, 26]. Biomolecular detection is one of the most promising applications of GQDs due to their outstanding fluorescence performance [27–29]. Compared with other semiconductor QDs, GQDs have many advantages including their low toxicity, excellent biocompatibility, stable emission and photobleaching resistance [30].
Recognition of interaction mechanism of DNA with GQDs not only opens new opportunities for specific molecular recognition, but it also expands the promising applications of GQDs in nanomaterial technology, biotechnology and biomedicine. In the present study, we focused on interactions between GQDs and DNA (methylated and unmethylated) in which we determine their promising applications in DNA sensing and biomedicine.
Scheme
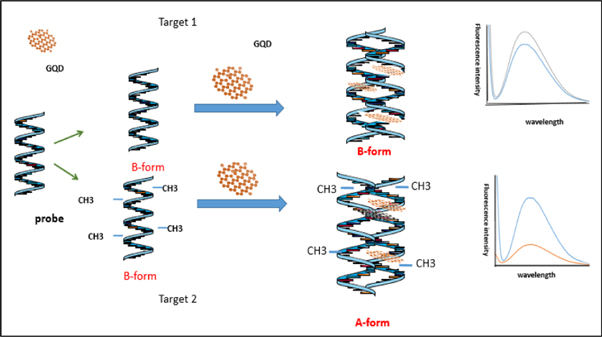
Scheme 1. Schematic representation of label free fluorescence assay of DNA methylation based on GQDs and DNA interaction.
Download figure:
Standard image High-resolution imageExperimental
Apparatus
All fluorescence measurements were carried out on a Perkin-Elmer LS50 luminescence spectrometer with a xenon lamp as source of excitation while the spectral bandwidths of monochromators for excitation and emission were 10 nm. The sizes of GQDs were measured by Transmission electron microscope (TEM) (Zeiss, EM10C, 80KV, Germany). All of experiments were carried out at room temperature. CD spectra were measured at 25 °C on a JASCO J-810 spectropolarimeter with a computer-controlled water bath. The optical chamber of CD spectrometer was deoxygenated with dry purified nitrogen (99.99%) and kept the nitrogen atmosphere during experiments. Three scans were accumulated and automatically averaged. Absorbance measurements and melting experiments were made on a Perkin Elmer Lambda 25 UV/V`is spectrophotometer. All UV/Vis spectra were measured in 1.0 cm path length quartz cuvettes with the same concentration of GQDs aqueous solution as the reference.
Reagents and solutions
All of the reagents and solvents were of analytical grade and used without further purification. Ultrapure water (deionized and doubly distilled) was used throughout the reaction process. Nitric acid (HNO3), Sulfuric acid (H2SO4), Sodium carbonate (Na2CO3) and sodium borohydride (NaBH4) were purchased from Merck. Other chemicals were of the reagent grade from Fluka chemical companies.
The tested 24 bp oligonucleotides used in this work were synthesized according to specific sequence of APC gene by Shanghai Generay Biotech Co. Their base sequences are shown as follows:
Probe sequence: 5'-TCCGCTTCCCGACCCGCACTCCGC-3'
Complementary unmethylated sequence (target 1):
5'-GCGGAGTGCGGGTCGGGAAGCGGA-3'
Complementary methylated sequence (target 2):
5'-GC(M)GGAGTGC(M)GGGTC(M)GGGAAGC(M)GGA-3'
Single base mismatch unmethylated sequence (target 3):
5'-GCGGAGTACGGGTCGGGAAGCGGA-3'
Single base mismatch methylated sequence (target 4):
5'-GC(M)GGAGTAC(M)GGGTC(M)GGGAAGC(M)GGA-3'
All oligonucleotides stock solutions were prepared with TE Buffer and kept frozen until used. To make a TE Buffer, 1 ml of 1 M Tris-HCl (pH 7.5) and 0.2 ml EDTA (0.5 M) were added to deionized water to total volume of 100 ml of solution. All chemicals were of analytical grade and used without further purification.
Preparation of GQDs
The GQDs were prepared according to the protocol reported in the literature [31]. Briefly, 0.05 g of graphene sheets (GSs) were oxidized in 10 ml concentrated H2SO4 and 30 ml HNO3 for 15–20 h under mild ultrasonication (500 W, 40 kHz). The mixture was then diluted in 250 ml deionized (DI) water and filtered through a 0.22 mm microporous membrane to remove the acids. Next 0.2 g of purified oxidized GSs were re-dispersed in 40 ml Milli-Q water and the pH value was adjusted to 8.0 by the addition of NaOH (1.0 molL). The suspension was transferred to a polytetrafluoroethylene (Teflon) lined autoclave and heated at 200 °C for 10 h. After cooling to room temperature, the resulting black suspension was filtered through a 0.22 mm microporous membrane and a brown filter solution was separated. The brown GQDs solution was neutralized with Na2CO3. The final product solution was further dialyzed in a dialysis bag (retained molecular weight: 1000 Da) for 3 days. Then, the GQDs were stored in the refrigerator at 4 °C for further use. Fourier transform infrared (FTIR) spectra were collected using a FTIR spectrometer (Bruker, Germany).
Preparation of ssDNA-GQDs and hybridization
In order to provide the ssDNA-GQDs assembly, the single stranded DNA was subjected to the GQDs through an incubation reaction. First 60 μl of above prepared GQDs solution added to 435 μl TE buffer and following after addition 5 μl (1 μM) of ssDNA probes it was incubated at 37 °C for 2 h. Hybridization was carried out by gently stirring at 37 °C. Basically, 3 ml of the suspension of 0.01 M Tris–HCl and 0.20 M NaCl hybridization buffer was prepared and after addition of 150 μl of ssDNA probe-GQDs mixture, ssDNA targets was added and incubated for 2 h by gently stirring to mix thoroughly. In order to prepare both types of methylated and unmethylated DNA with the same nucleotide sequences, probe sequence (P1) was hybridized with unmethylated target (T1) and methylated target (T2) at different concentration in hybridization buffer.
Fluorescence analysis
The effect of dsDNA on fluorescence of GQDs was conducted as follows: 3.0 ml of ssDNA-GQDs suspension in buffer solution was prepared at first; then specific concentration of complementary unmethylated and methylated ssDNA targets were added into the resultant solution respectively; and the resulted solutions were stand for 20 min at room temperature, the fluorescence intensity was measured under the optimal excitation wavelength. The fluorescence intensity was recorded at the excitation and emission wavelength of 380 and 480 nm respectively.
Results and discussion
Synthesis of GQDs
The GQDs were prepared from graphite sheets through oxidation by nitric acids and sulfuric acids and then were dialyzed with dialysis bag to remove the extra original compounds. Figure 1(a) shows the fluorescence spectra of GQDs involved in the detection route. The GQDs presented blue fluorescence with the central emission peak of 480 nm. The morphologies of GQDs were characterized by the transmission electron microscopy (TEM) shown in figure 1(b). They had similar morphology and size distribution from 2 to 5 nm. Size distribution histogram of GQDs presented a narrow distribution with average diameter of 3.5 nm (figure 1(c)). In order to determine the presence of functional group on the surface of GQDs, FTIR spectra were collected. During the oxidation process in the synthesis of GQDs, oxygen-containing functional groups, including carbonyl/carboxylate, hydroxyl, and epoxide groups, is introduced at the edge and on the basal plane, as shown in the Fourier transform infrared (FTIR) spectrum (figure 2). The existence of these groups on the surface of the chemically synthesized GQD makes it easily water dispersible. The peak around 1363 cm−1 indicates the presence of COO− while the broad peak area from 3000 to 3600 cm−1 refers to the carboxylic acid O–H stretching mode. Moreover, the peaks at 1018, 1200, 1660, and about 1720 cm−1, are assigned to C–O–C stretching, C–OH stretching, C=C stretching, and C=O stretching mode of vibration, respectively.
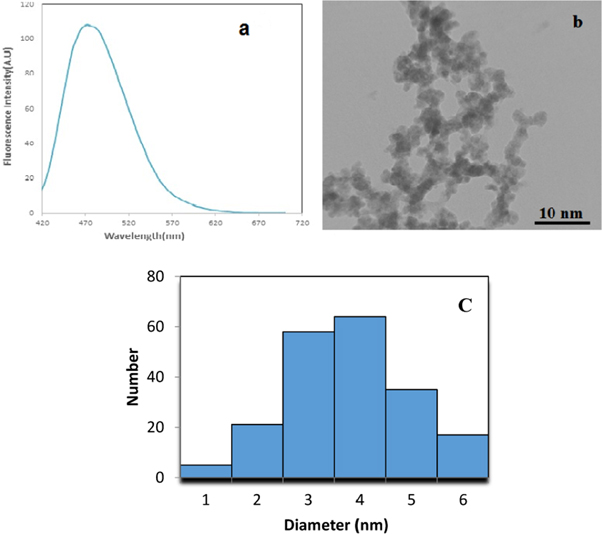
Figure 1. (a) Fluorescence spectra of GQDs with central emission of 480 nm, (b) TEM image of synthesized GQDs and (c) Size distribution histogram of GQDs.
Download figure:
Standard image High-resolution image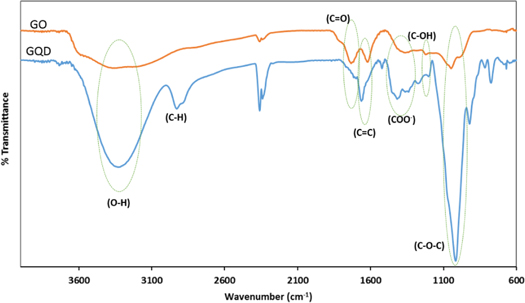
Figure 2. FTIR spectra of GO and synthesized GQDs.
Download figure:
Standard image High-resolution imageGQDs and ssDNA probe interaction
Superiority in chemical inertness, biocompatibility and low toxicity of GO based nanomaterials make them favorite alternative targets in biological studies. It has been reported that the existence of π-rich conjugation domains gives graphene-based nanostructures the ability to interact with ssDNA molecules via π–π stacking interactions [32–34]. The interaction of GQDs with DNA oligomers had been studied previously in several reports [35–37]. Technically, GQDs are only composed of elemental C and H, but the oxidation during GQDs synthesis methods make them partially oxidized with the hydroxyl, epoxy/ether, carbonyl and carboxylic acid groups on the surfaces [38–40]. Generally, it has been reported the existence of C, O and H elements and the surface groups such as carbonyl, carboxyl, hydroxyl and epoxy groups of GQDs are similar to graphene that contribute to formation of electrostatic or H bonding [41–45]. As shown in FTIR spectra (figure 2), the introduction of oxygen-containing groups, including carboxyl, hydroxyl, and ether groups during the oxidation was quite obvious. Wang et al reported that the nanostructures which composed of oxygen or nitrogen sites on their surfaces could interact strongly with DNA oligomers through electrostatic interaction [46]. Recently our research group reported that QDs with –COO negative charge group on their surfaces could absorbed by ssDNA with positive charge of bases [47]. It was illustrated in another study that ssDNA and GQDs interaction will be facilitated through π–π stacking the nucleobases of DNA and functional groups of GQDs [48]. Regarding to previous literatures and our obtained results of FTIR analysis it would be possible to expect the strong interaction between ssDNA and GQDs by electrostatic or π–π interaction.
Fluorescence analysis
After addition of complementary unmethylated and methylated ssDNA targets the hybridization process results to different fluorescence behavior. Previously it has been reported that GQDs can intercalate into dsDNA at the major groove and bind much stronger than GO because of a size effect [49, 50]. In the case of unmethylated DNA our obtained results were consistent with the Lu et al [50]. They reported when the GQDs bind to the DNA through intercalation, the GQDs surface is passivated and the fluorescence intensity of GQDs is efficiently enhanced. Our finding shows this enhancement has increasing trend with increase of unmethylated DNA target (figure 3). It is concluded that increase of unmethylated DNA target concentration and DNA hybridization results to intercalation of more passivated GQDs leads to gradual fluorescence enhancement. In contrast, in figure 4, in the presence of methylated ssDNA targets, the fluorescence intensity ratio of GQDs decreased significantly and showed no changes in fluorescence intensity after addition of more concentration of methylated DNA. The quenching behavior of methylated DNA would be originated from presence of methyl group on methylated ssDNA target. It is widely accepted that alkyl substituents (e.g. –CH3, –CH2CH3) are electron donating groups which activate the aromatic ring (e.g. purines and pyrimidines nucleobases) by increasing the electron density on the ring through an inductive donating effect [51]. Also, it was shown the covalent addition of methyl group to DNA would make DNA less flexible with lower mechanical stability [52]. In our opinion methyl group not only change the net charge of DNA and affect the passivated GQDs but also change the flexibility and intrinsic curvature of the DNA molecule. These effects could finally disrupt the electrostatic or π–π interaction of GQDs with methylated DNA and even interfere in intercalation process lead to following fluorescence quenching.
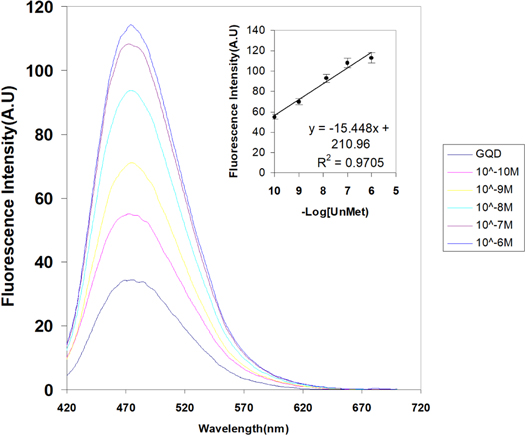
Figure 3. Fluorescence spectra of GQDs in the presence of different concentration of unmethylated DNA.
Download figure:
Standard image High-resolution image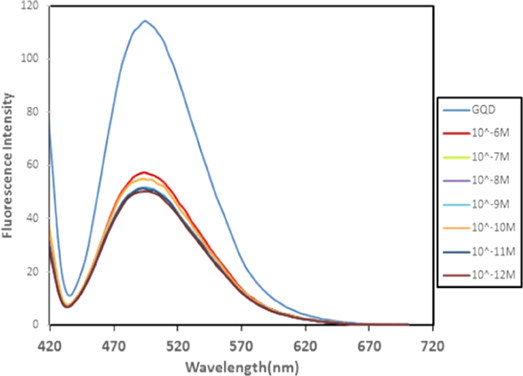
Figure 4. Fluorescence spectra of GQDs in the presence of different concentration of methylated DNA.
Download figure:
Standard image High-resolution imageCD spectra analysis
In order to determine the effect of GQDs on molecular structure of unmethylated and methylated DNA, CD spectra of both interactions were studied. Considering both the fluorescence intensities and signal changes, the concentration of 1 × 10⁻⁶ M of both type of DNA and same concentration of GQDs was selected for this study. The obtained results indicated that intercalation of GQDs and unmethylated DNA caused no change in structure of DNA (figure 5(a)) while above interaction for methylated DNA showed not only a dominant positive band at 260 nm but also a negative band at 210 nm which indicated induction of B-A transition (figure 5(b)). So it would be possible to interpret that induction of A-form of DNA provide more free space for interacted/intercalated GQDs in above assembly and maybe leads to quenching of GQDs fluorescence. Previous studies indicated that some of the interaction could induce right-handed B-DNA to left-handed Z-DNA [53–56]. Feng et al [57] have also reported that photoluminescent carbon dots could bind to DNA major groove and induce B-A transition. As DNAs bind to GQDs, various interactions of DNA bases and backbone, such as hydrophobic, electrostatic and van der waals interaction will take place with GQDs. It seems that in methylated DNA the strong interaction between GQDs and DNA can disturb DNA hydration layer or even DNA structure. So the induction of B-A DNA transition through interaction of methylated DNA with GQDs even could help us to detect methylated DNA. The obtained results also indicated that methylated DNA/GQDs interaction may have inhibitory effect on DNA expression which could be efficient in genetic studies.
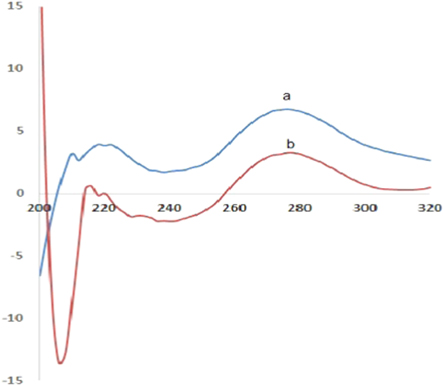
Figure 5. CD spectroscopy analysis of unmethylated DNA (a) and methylated DNA (b).
Download figure:
Standard image High-resolution imageDetection of DNA with GQDs
To demonstrate the effect of DNA targets on fluorescence of GQDs under optimal conditions, the reaction solution titrated by different concentrations of unmethylated and methylated ssDNA targets and the fluorescence intensity of them was measured. Figure 3 shows the increasing effect of unmethylated DNA on fluorescence of GQDs and subsequently fluorescence could increase gradually by the addition of unmethylated DNA from 1.0 × 10⁻¹⁰ to 1.0 × 10⁻⁶M in the presence of same concentration of GQDs. However, the fluorescence of GQDs quenched significantly upon addition of 10−6 M of methylated DNA. The fluorescence intensity was constant and exhibited no fluorescence changes after addition of more concentration of methylated DNA, which make no contribution to detect the methylated DNA based on fluorescence intensity of each sample.
The increased values of fluorescence intensity for unmethylated dsDNA concentration were in linear range from 10.0−10M to 10.0−6M with regression equation of ΔF = −15.44 C + 210.6 (unit of C is –Log unmethylated DNA), the regression coefficient (R) of the linear curve was 0.970 and the detection limit was estimated at 7.3 × 10⁻¹¹ M.
In order to characterize the effect of unmethylated DNA, binding constant value was determined through the modified Benesi-Hildebrand equation [58].
Where F = Fx-F0 and Fmax = F-F0 where F0, Fx and F are the emission intensities of GQDs in the absence of complementary strand, at an intermediate concentration and at a concentration of complete interaction respectively. K is the binding constant for the interaction and [C] is the complementary strand concentration. From the plot of (F-F0)/(Fx-F0) against [C] for GQDs, the value of K extracted from the slope was 3.3 × 10¹⁰ M−1.
This specific fluorescence process based on interaction between GQDs and dsDNA can serve as a sensitive nanobiosensor for quantitative analysis of unmethylated DNA. It also could help us to distinguish unmethylated from methylated DNA at the same concentration.
Optimization of analysis method
In order to optimize this analytical method, some conditions including effects of pH and incubation time on fluorescence intensity were explored. Figure 6(a) shows the effect of various pH values on the fluorescence emission of dsDNA-GQDs assembly. The results demonstrated that with decrease in pH from 9 to 5, the fluorescence intensity of GQDs increased gradually. So due to the experiment condition optimal pH was determined at pH = 7. The fluorescence increasing effect of GQDs with DNA as a function of incubation time is displayed in figure 6(b). One can note that the fluorescence is gradually increased with time, and remains nearly constant after 30 min Thus, optimal fluorescence incubation time was chosen as 30 min in the following experiments.
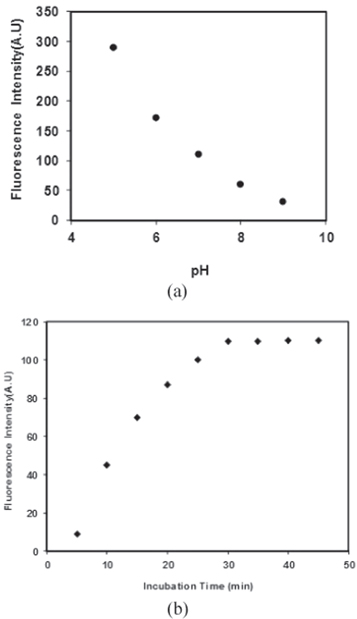
Figure 6. (a) Effect of pH on fluorescence intensity of dsDNA-GQDs, (b) Effect of incubation time on the fluorescence intensity of dsDNA-GQDs.
Download figure:
Standard image High-resolution imageAssay of methylation sensitivity of experiment by restriction enzyme
In order to verify the methylation sensitivity of experiment another test was performed. It is known that HpaII restriction enzyme is methylation sensitive enzyme which is able to digest CCGG site but cannot digest methylated CmCGG. The both unmethylated and methylated targets and DNA/GQDs assemblies were treated by HpaII. In the first step, the fluorescence intensity of GQDs quenched due to the presence of methylated target and following the digestion process assembly showed no changes because of digestion inhibiting effect. On the other hand, the unmethylated assembly showed fluorescence increase related to hybridization with unmethylated target and digestion step respectively (figure 7). The current results indicated that DNA cleavage by HpaII resulted to fluorescence enhancement in unmethylated DNA while methylated DNA could not induce changes in fluorescent intensity of GQDs. The obtained results clearly showed the reproducibility and sensitivity of performed experiment using methylation sensitive restriction enzyme.
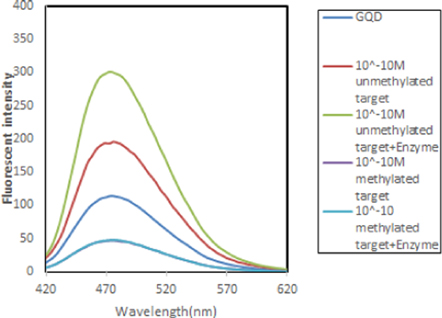
Figure 7. Effects of HpaII restriction enzyme on unmethylated DNA/GQDs and methylated DNA/GQDs.
Download figure:
Standard image High-resolution imageSpecificity of analysis method
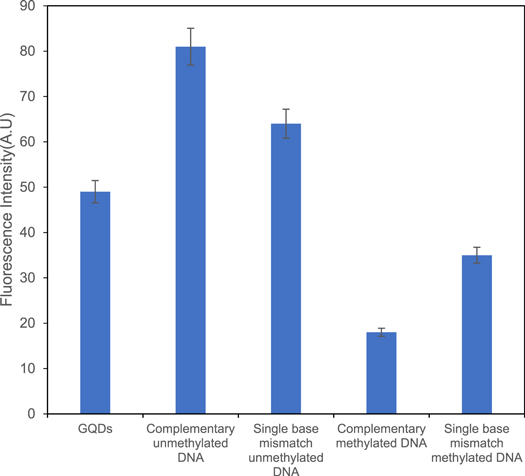
in order to determine the specificity of experiment the mismatch targets of methylated and unmethylated ssDNA were hybridized with the DNA/GQDs assembly. The hybridization was performed at the same condition of previous used protocol. As shown in figure 8 the obtained results showed mismatch hybridization results to quenching effect for unmethylated DNA and enhancing effect for methylated DNA. So it is concluded that partial hybridization could effect on fluorescence intensities of both cases and showed unspecific targets cause significant changes in fluorescence emission. Finally, the obtained results showed high specificity and sensitivity of experiment.
Figure 8. Effects of mismatch ssDNA targets on unmethylated ssDNA/GQDs and methylated ssDNA/GQDs.
Download figure:
Standard image High-resolution image
Conclusion
In summary we studied a new strategy based on GQDs as a DNA intercalating agent and DNA molecule for detection of mechanism of interaction of GQDs with unmethylated and methylated DNA. This method provides us label-free fluorescent assay of unmethylated DNA. Obtained results proved that presence of methylated cytosine in DNA structure could change the structure of DNA while it is intercalated with GQDs. This structure change also altered the fluorescence behavior of GQDs dramatically. The obtained results from the presented simple and cost effective study could help us to distinguish methylated from unmethylated DNA. The obtained results also proved that the DNA/GQDs interaction changed the DNA structure so that structure of methylated DNA showed B-A structure transition.
Remarkable results of this strategy for determination of B-A DNA transition could also provide opportunities to design several experiments that might present new insights into the applications of GQDs.
Acknowledgments
The authors have declared that no conflicting interests exist.