


ABSTRACT
We have carried out 13CO(J = 2–1) observations of the active star-forming region N159 west in the Large Magellanic Cloud with ALMA. We have found that the CO distribution at a sub-parsec scale is highly elongated with a small width. These elongated clouds called "filaments" show straight or curved distributions with a typical width of 0.5–1.0 pc and a length of 5–10 pc. All the known infrared young stellar objects are located toward the filaments. We have found broad CO wings of two molecular outflows toward young high-mass stars in N159W-N and N159W-S, whose dynamical timescale is ∼104 years. This is the first discovery of protostellar outflow in external galaxies. For N159W-S, which is located toward an intersection of two filaments, we set up a hypothesis that the two filaments collided with each other ∼105 years ago and triggered the formation of the high-mass star having ∼37  . The colliding clouds show significant enhancement in linewidth in the intersection, suggesting excitation of turbulence in the shocked interface layer between them, as is consistent with the magnetohydrodynamical numerical simulations. This turbulence increases the mass accretion rate to
 yr−1, which is required to overcome the stellar feedback to form the high-mass star.
Export citation and abstract BibTeX RIS
1. INTRODUCTION
High-mass stars are influential in galactic evolution by dynamically affecting and ionizing the interstellar medium and also by chemically enriching heavy elements via supernova explosions. It is of fundamental importance to understand the physical processes in the evolution of molecular clouds where high-mass stars are forming. There have been numerous works on high-mass star formation in the literature (for reviews, see, e.g., Zinnecker & Yorke 2007; Tan et al. 2014). In spite of these works, we have not yet understood how high-mass star formation takes place. One of the promising candidates where young high-mass stars are forming is very dense and massive cores, such as the infrared dark clouds in the Milky Way (Peretto et al. 2013). Another possible candidate is the compressed layer formed in cloud–cloud collisions. Observations of a few super star clusters and smaller H ii regions in the Milky Way have shown signs of triggered formation of high-mass stars in the collision-compressed layers (e.g., Furukawa et al. 2009; Torii et al. 2011, 2015; Fukui et al. 2014, 2015). Magnetohydrodynamical numerical simulations of two colliding molecular clouds by Inoue & Fukui (2013) have shown that turbulence is excited and the magnetic field is amplified in the collision-shocked layer between the clouds. The turbulence and magnetic field increase the mass accretion rate, favoring high-mass star formation.
The difficulty in studying young high-mass stars lies in the considerably small number of young high-mass stars as compared with low-mass stars in the solar vicinity; this is in part due to the lower frequency of high-mass stars and the heavy sightline contamination in the Galactic disk. ALMA is now creating the new possibility of exploring high-mass star formation in external galaxies with its unprecedented sensitivity and resolution, having the potential to revolutionize our view of high-mass star formation. The Large and Small Magellanic Clouds (LMC), at distances of 50 kpc (Schaefer 2008) and 61 kpc (Szewczyk et al. 2009), are actively forming high-mass stars. The LMC is an ideal laboratory to see the evolution of stars and clouds as a result of the non-obscured face-on view (Subramanian & Subramaniam 2010) of all the giant molecular clouds (GMCs) in a single galaxy (for a review, see Fukui & Kawamura 2010). A 12CO(J = 1–0) survey for GMCs with the NANTEN 4 m telescope (Fukui et al. 1999, 2008; Mizuno et al. 2001; Yamaguchi et al. 2001) provided a sample of nearly 300 GMCs at 40 pc resolution and led to an evolutionary scheme from starless GMCs (Type I) to active star-forming GMCs (Type III) over a timescale of 20 Myr (Fukui et al. 1999; Kawamura et al. 2009). Aiming at revealing the finer-scale details of the molecular gas in the LMC, we have commenced systematic CO observations by using ALMA at sub-parsec resolution.
Among the nearly 300 GMCs over the LMC obtained with NANTEN, N159 is the brightest one with H ii regions. Infrared studies have revealed nearly 20 young high-mass stars in N159 with Spitzer and Herschel (Chen et al. 2010; Wong et al. 2011; Carlson et al. 2012 and references therein; Seale et al. 2014), where the 2 clumps of N159 east and west are active in star formation. Mizuno et al. (2010) showed that the CO J = 4–3/J = 1–0 ratio shows enhancement toward the molecular peak without a well-developed  ii region in N159 west (N159W). This high excitation condition suggests that N159W is possibly on the verge of high-mass star formation, and thus the initial condition of high-mass star formation may still hold. The preceding observations with the Australia Telescope Array, while low in resolution (HPBW ∼ 6''), presented some hint of small-scale clumps and filaments in N159W (Seale et al. 2012). N159W is therefore the most suitable target for the purpose of witnessing the onset of high-mass star formation.
We present the first results of the ALMA observations of N159W in this Letter mainly based on the 13CO(J = 2–1) data.
2. OBSERVATIONS
We carried out ALMA Cycle 1 Band 3 (86–116 GHz) and Band 6 (211–275 GHz) observations toward N159W both with the main array 12 m antennas and the Atacama Compact Array (ACA) 7 m antennas. The observations centered at ( ,
,  ) = (5h39m35
 34, −69°45'33
 2) were carried out between 2013 October and 2014 May. The target molecular lines were 13CO(J = 1–0), C18O(J = 1–0), CS(J = 2–1), 12CO(J = 2–1), 13CO(J = 2–1), and C18O(J = 2–1) with a bandwidth of 58.6 MHz (15.3 kHz × 3840 channels). We used a spectral window for the observations of the continuum emission among the four with a bandwidth of 1875.0 MHz (488.3 kHz × 3840 channels). The radio recombination lines of H30α and H40α were also included in the windows. The projected baseline length of the 12 m array ranges from 16 to 395 m. The ACA covers 9–37 m baselines. The calibration of the complex gains was carried out through observations of seven quasars, phase calibration of four quasars, and flux calibration of five solar system objects. For the flux calibration of the solar system objects, we used the Butler-JPL-Horizons 2012 model (https://science.nrao.edu/facilities/alma/aboutALMA/Technology/ALMA_Memo_Series/alma594/abs594). The data were reduced using the Common Astronomy Software Application package (http://casa.nrao.edu) and visibility imaged. We used the natural weighting for both the Band 3 and Band 6 data, providing synthesized beam sizes of ∼25 × 18 (0.6 × 0.4 pc at 50 kpc) and ∼13 × 08 (0.3 × 0.2 pc), respectively. The rms noises of the molecular lines of Band 3 and Band 6 are ∼40 and ∼20 mJy beam−1, respectively, in emission-free channels. The comparison of the cloud mass derived from the ALMA observation with that of a single-dish observation described in Section 3.1 suggests that the missing flux of the present ALMA observation is not significant.
3. RESULTS
3.1. A Complex Filamentary Structure
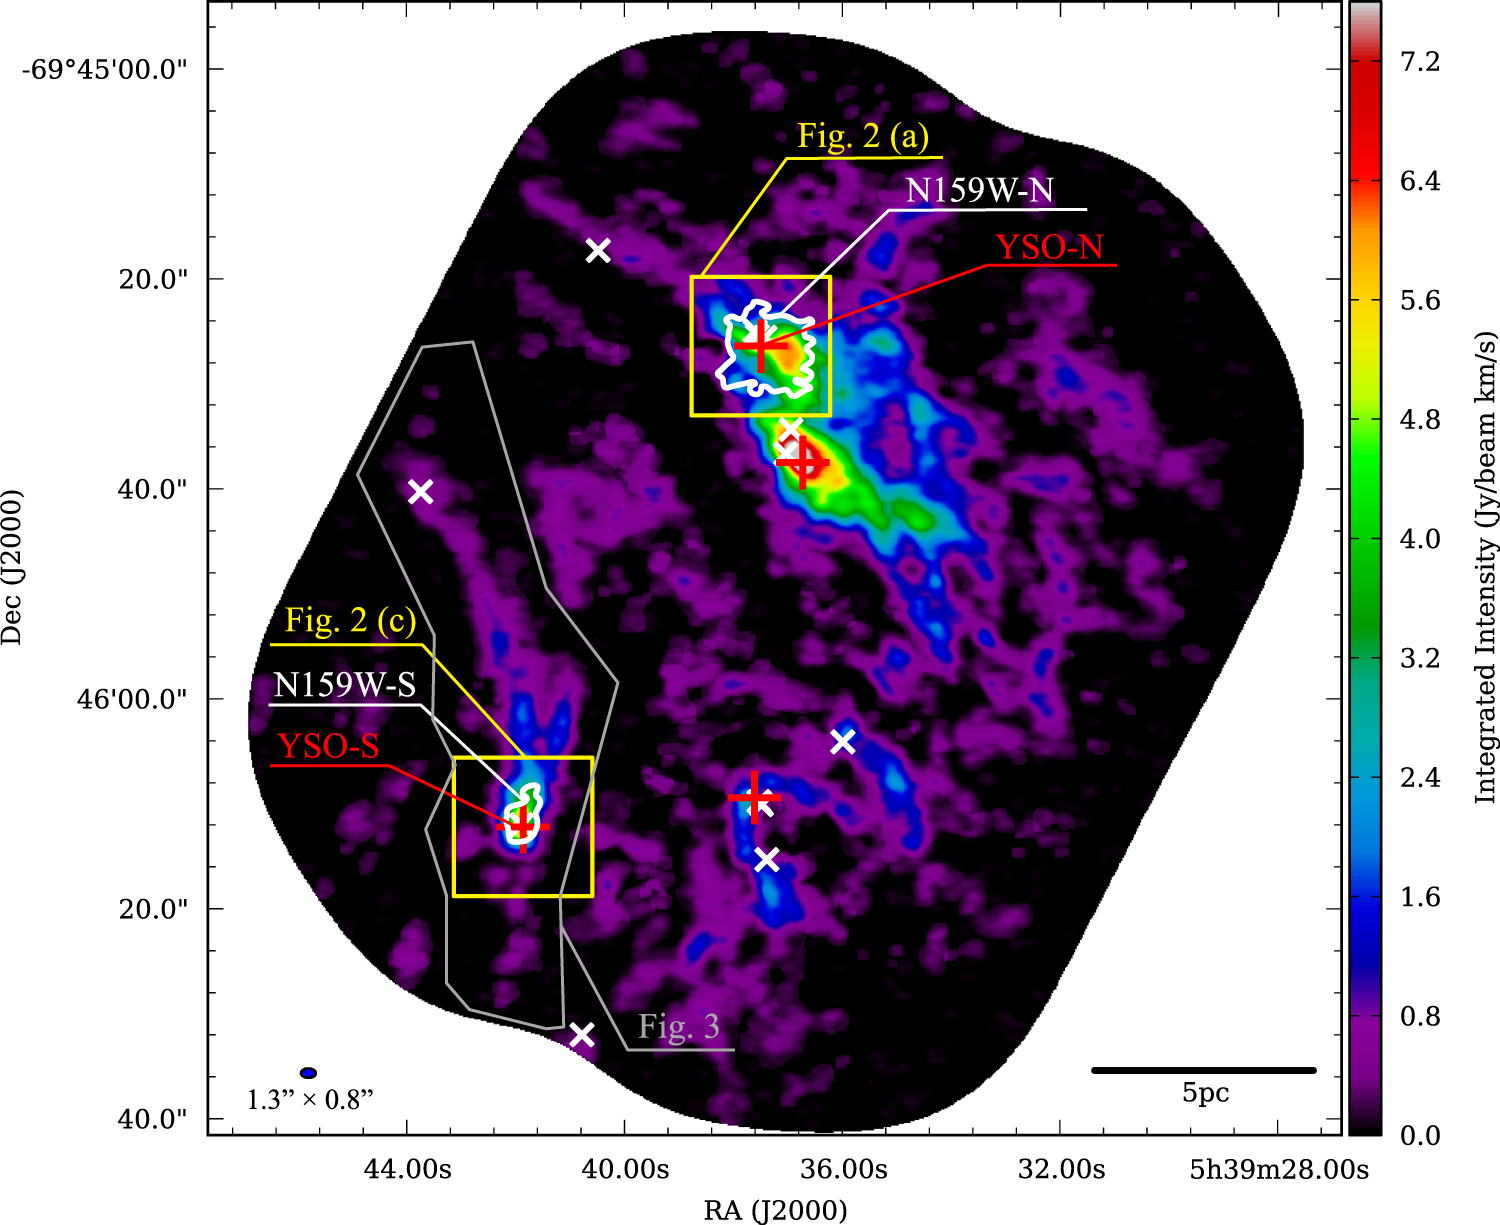
Figure 1 shows the 13CO velocity integrated intensity image of the J = 2–1 transition. The distribution of the 13CO emission is highly filamentary. The filaments, having often straight or curved distribution, have a typical length of 5–10 pc and a width of 0.5–1.0 pc defined as the full width of the emission area at the 3σ level of the intensity integrated over a range of 234–240 km s−1, which may be analogous to the dominance of filaments in the interstellar medium of the solar vicinity (e.g., Molinari et al. 2010; Andrè et al. 2013), possibly suggesting that filaments are ubiquitous in other galaxies as well. More details of the filaments will be published separately. The most active star formation is found in two regions as denoted by N159W-N and N159W-S in Figure 1, both of which are associated with enhanced 13CO emission.

Figure 1. Velocity-integrated intensities of 13CO(J = 2–1) toward N159W with the 12 m array observation are presented. White and red crosses show the YSOs (Chen et al. 2010) and the Band 6 continuum peaks of the ALMA observation, respectively. White contours are plotted at the 5σ level of the Band 6 continuum emission.
Download figure:
Standard image High-resolution imageThe cloud mass is estimated from the 12CO(J = 2–1) intensity by assuming a conversion factor from the 12CO(J = 1–0) intensity to the column density of X(CO) =  cm−2 (Fukui et al. 2008) and the typical 12CO(J = 2–1)/12CO(J = 1–0) ratio toward H ii regions of 0.85 (the ratio in the Orion-KL region of Nishimura et al. 2015). We also assumed the absorption coefficient per unit dust mass at 1.2 mm and the dust-to-gas mass ratio to be 0.77 cm2 g−1 and
  , respectively, to derive the gas mass from the dust emission (Herrera et al. 2013). In total, the filaments have a molecular mass of 2.4 × 10⁵
 in N159W corresponding to 35% of the total mass, which is estimated by the lower-resolution study (Minamidani et al. 2008; Mizuno et al. 2010). We define the N159W-N and N159W-S clumps at the 5σ level of the Band 6 continuum (white contours in Figure 1), and the masses of these clumps are estimated to be
 and
and 
 , respectively, by assuming a dust temperature of 20 K. Their masses derived from the CO emission are
 and
and 
 , respectively, as is consistent with the dust-emission estimate.
3.2. Outflows
We have discovered two molecular outflows that have a velocity span of 10–20 km s−1 in 12CO(J = 2–1). Figure 2 shows the distribution of the outflow wings. One of them corresponds to N159W-N and the other to N159W-S. The N159W-S outflow has redshifted and blueshifted lobes that show offsets of 0.1–0.15 pc from the peak of the continuum emission. The outflow axis is along the east–west direction. The N159W-N outflow has the blueshifted lobe only, which shows an offset of 0.2 pc from the 13CO peak. It is possible that the complicated gas distribution around N159W-N may mask the possible red lobe. The size of the redshifted and blueshifted lobes is less than the beam size 0.2 × 0.3 pc, and the upper limit timescale of the outflow is roughly estimated to be 104 years. This is the first discovery of extragalactic outflows associated with a single protostar. The positions of outflows in N159W-N and N159W-S coincide with young stellar objects (YSOs) identified based on the Spitzer data: 053937.56-694525.4 (hereafter YSO-N; Chen et al. 2010) and 053941.89-694612.0 (hereafter YSO-S; Chen et al. 2010; P2 in Jones et al. 2005), respectively.

Figure 2. Distributions of high-velocity wings from two outflows: (a) and (b) for YSO-N and (c) and (d) for YSO-S. (a) and (c) Image and white contours show the Band 6 continuum emission. Contours are plotted every 0.9 Jy beam−1. Red and blue contours show images of 12CO(J = 2–1) integrated over the velocity ranges shown with red and blue dashed lines in (b) and (d). Contours are plotted every 1.1 Jy beam−1 km s−1. The white cross depicts the Band 6 continuum peak. (b) and (d) The red and blue lines show averaged spectra of the outflow wing over the regions inside the red and blue contours, respectively, in (a) and (c).
Download figure:
Standard image High-resolution image3.3. YSO Characteristics
Two YSOs associated with outflows, YSO-N and YSO-S, have been studied extensively at near- to far-infrared, submillimeter, and radio wavelengths (Carlson et al. 2012 and references therein; Indebetouw et al. 2004; Seale et al. 2014). Using the Robitaille et al. (2006, 2007) YSO model grid and spectral energy distribution (SED) fitter, we model all the available data including the Spitzer and Herschel fluxes (1.2–500 μm), as well as photometry we extracted from Spitzer/IRS spectra (5–37 μm; Seale et al. 2009), and the fit of the SEDs indicates that both YSO-N and YSO-S are Stage 0/I YSOs. The mass and luminosity are estimated to be 31 ± 8  and
and 
 for YSO-N, and 37 ± 2
  and
and 
 for YSO-S. These results are consistent with those from Chen et al. (2010), who also used the Robitaille fitter, but without the Herschel constraints. The dynamical ages of the two outflows are consistent with the age output from the SED fitter (Robitaille et al. 2006), ∼104 years.
According to 3 cm radio continuum measurements, YSO-N is determined to be an O5.5 V star, whereas YSO-S is not detected (Indebetouw et al. 2004), suggesting that YSO-S is in an earlier evolutionary state than YSO-N. This is consistent with a non-detection of the He 2.113 μm and with the weak Brγ in YSO-S (Testor et al. 2006). The Testor et al. (2006) near-IR Very Large Telescope (VLT) data revealed that YSO-S consists of at least two sources, whereas their detailed physical properties and relation with the mid-/far-infrared source are yet unknown.
3.4. Filamentary Collision in N159W-S
In Figure 1, N159W-N shows complicated 13CO distribution, whereas the source N159W-S shows relatively simple 13CO morphology. The 13CO distribution in N159W-N consists of several filaments which are elongated generally in the direction from the northeast to southwest, and N159W-S is located at the tip of a V-shaped distribution of two filaments. We shall focus on N159W-S in the following to describe the filament distribution and the high-mass young star, because the simple morphology allows us to understand the physical process unambiguously.
Figure 3 shows the two filaments toward N159W-S (Figure 3(a), the whole velocity range; Figure 3(b), the redshifted filament; and Figure 3(c), the blueshifted filament, respectively). The two filaments overlap toward N159W-S, where the 13CO intensity and linewidth are significantly enhanced. Figures 3(d)–(h) show position–velocity diagrams taken along the two filaments. We see that the filaments have a small velocity span of 3 km s−1 in the north of N159W-S, which shows a significantly enhanced velocity span of 8 km s−1 at the 15% level of the 13CO peak in Figure 3(g). An HST image at near-infrared indicates that the redshifted filament is extended toward the south beyond N159W-S (L. R. Carlson et al. 2015, in preparation), while no CO emission is detected there in our 12CO or 13CO observations with ALMA. We also find that the blueshifted filament has its extension beyond N159W-S in 13CO. So, although the filaments are apparently terminated toward N159W-S, they are actually more extended, placing N159W-S in the intersection of the two filaments.

Figure 3. Spatial and velocity distributions of two filaments in N159W-S. (a) 13CO(J = 2–1) intensity map integrated over a velocity range 234–240 km s−1. The X offset in R.A. (J2000.0) and Y offset in decl. (J2000.0) are from (4h39m4188, −69°46'122). (b) and (c) The 13CO(J = 2–1) map integrated over a velocity range between the dashed lines of (d) and (e), respectively. Magenta and cyan lines show the regions used for mass estimate in Section 4 for the velocity range, same with that in (a). The arrows depict the lengths and widths of the regions. The black/white contours plotted in (a)–(c) indicate the 5σ level of the Band 6 continuum emission. (d) and (e) 13CO(J = 2–1) position–velocity diagrams along the region between the dashed lines in (b) and (c), respectively, where the central velocity is 237 km s−1. Contours are plotted at every 6σ from 3σ ( Jy beam−1 pc). (f)–(h) Position–velocity diagrams of 13CO(J = 2–1) along the dashed lines in (a).
Download figure:
Standard image High-resolution image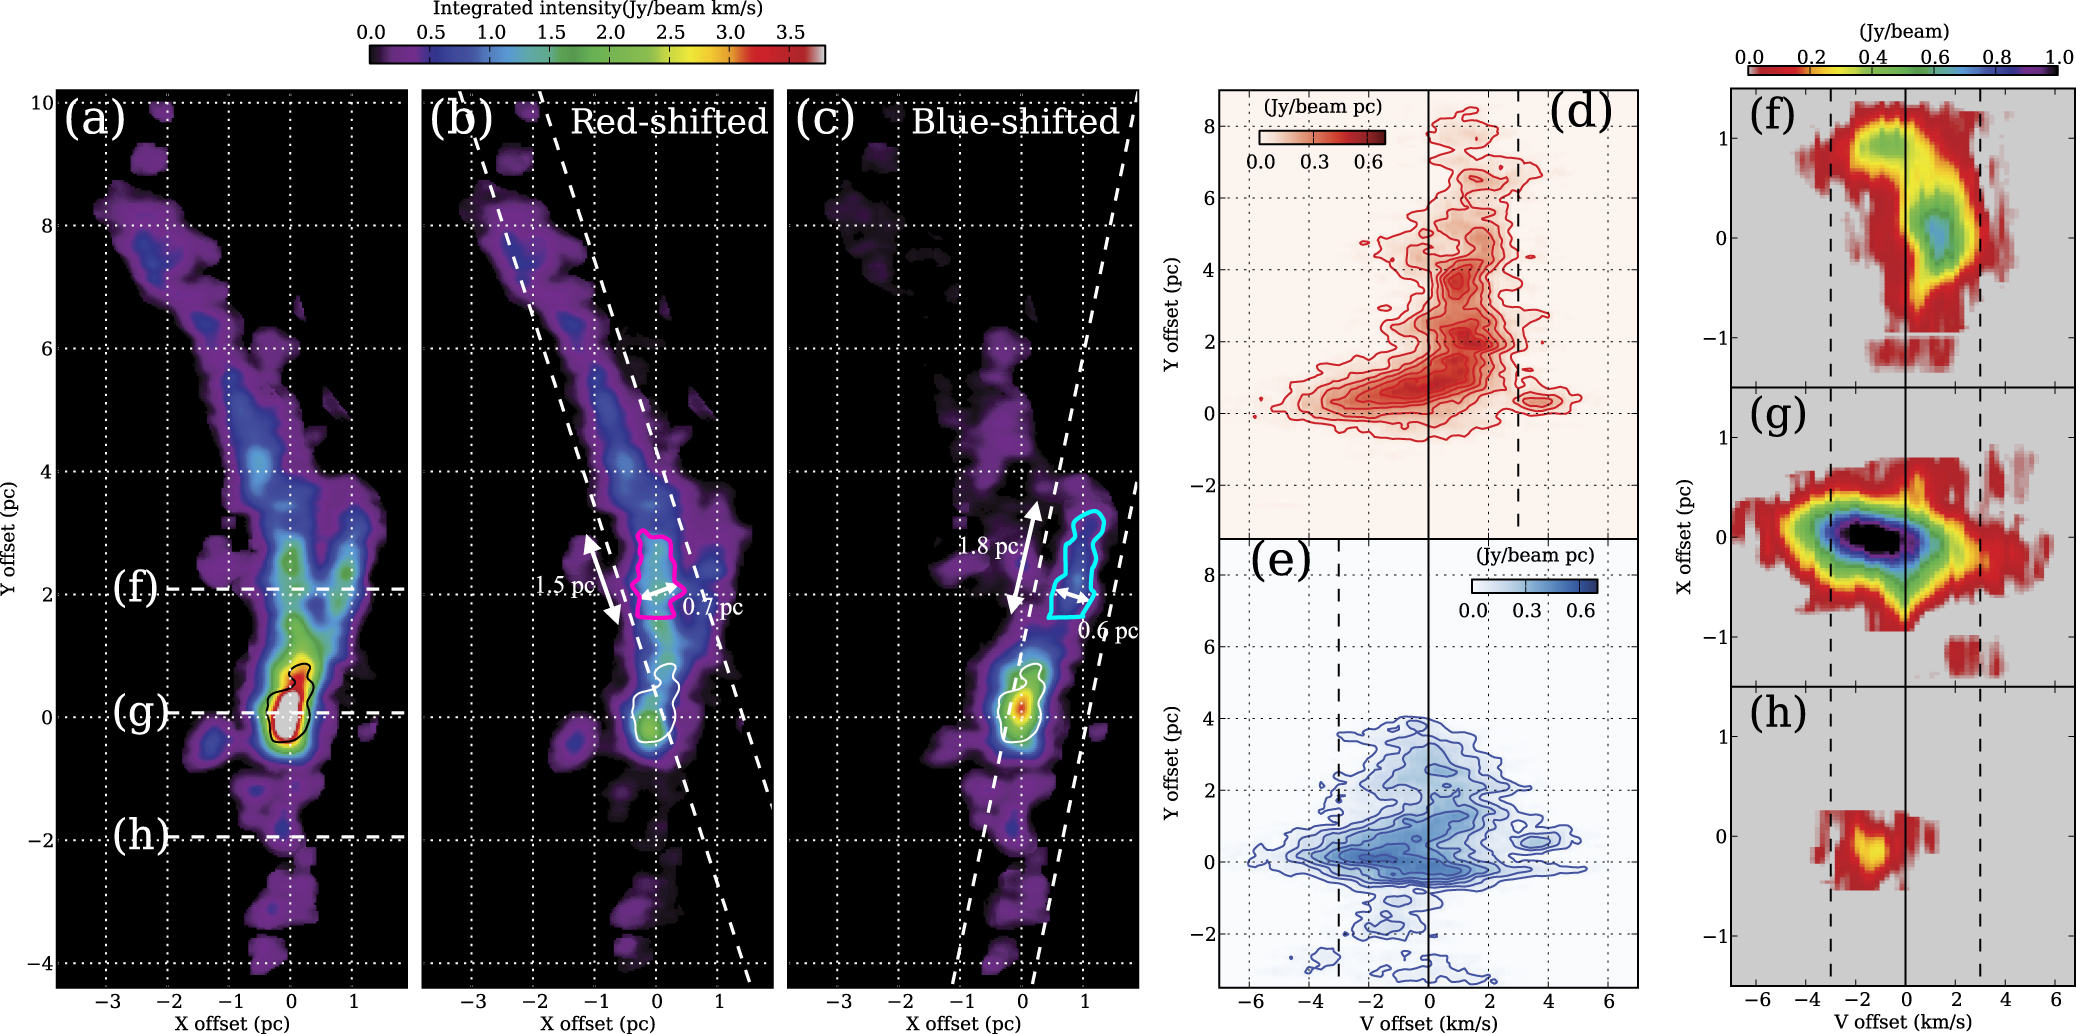
In N159W-S, the longer redshifted filament in the east is highly elongated and mildly curved, having a length of 10 pc, while the other blueshifted filament in the west is straight and elongated by 5 pc. N159W-S clearly demonstrates that a high-mass YSO with bipolar outflow is formed toward the intersection between the two thin filaments, and the velocity dispersion is significantly enhanced in the intersection.
Based on these results, we set up a hypothesis that the formation of N159W-S was triggered by the collision between the two filaments. We first describe a possible scenario for N159W-S and then discuss the observational constraints on the collision and high-mass star formation. The two crossing filaments overlapping toward N159W-S give direct support for the present scenario. The lower limit for the relative velocity in the collision is given by the velocity difference of the two filaments, 2–3 km s−1. The actual collision velocity should be higher than 2–3 km s−1 because of the projection effect. According to the magnetohydrodynamical numerical simulations of two colliding molecular flows by Inoue & Fukui (2013), the collision-shocked layer enhances isotropic turbulence, independent of the direction of the collision, and the velocity span in the shocked layer is similar to the relative collision velocity. The simulations by Inoue & Fukui (2013) for a velocity difference of 20 km s−1 allow us to scale the relative velocity to ∼10 km s−1 with basically the same physical process. We therefore assume the velocity span in N159W-S, 8 km s−1, as the actual collision velocity. This implies the relative motion of the two filaments is nearly vertical, roughly  , to the line of sight.
4. DISCUSSION ON THE HIGH-MASS STAR FORMATION PROCESSES
Since the rest of the filaments show no sign of velocity dispersion enhancement with high-mass star formation, we assume that the non-interacting filaments retain the initial condition prior to the collision. The line-mass, mass per unit length, in the filaments changes from region to region by an order of magnitude. In order to estimate the typical mass of the filaments associated with the N159W-S clump for the following discussion, we pick up two segments of 1.5 and 1.8 pc in length and 0.7 and 0.6 pc in full width at a 35% level of the 13CO peak for the redshifted and blueshifted filaments, respectively, as indicated in Figures 3(b) and (c). Below the 35% level, it is hard to estimate the line-mass of the individual filaments separately due to overlapping. Above this level, the mass sampled becomes underestimated. We estimate the total mass of these two segments to be 
 from 12CO(J = 2–1) for a velocity range of 234–240 km s−1. We then estimate the average line-mass of these two filaments to be
 pc−1. The filaments are not detected in the Band 6 continuum at the 3σ noise level of the molecular mass density
 pc−1, which is higher than the above CO-based line-mass density of the filaments.
This suggests that the collision took place in a timescale of ∼0.5 pc divided by 8 km s−1, i.e., ∼6 × 10⁴ years ago. We assume that the formation of the high-mass star initiated at the same time. By using the stellar mass 37  , the average mass accretion timescale of the star formation is given as 37
  /
/ years ∼6 × 10⁻⁴
  yr−1. This rate is well in accord with the theoretical estimate around 10−3
  yr−1 and satisfies the criterion to form high-mass stars by overcoming the stellar feedback (e.g., Wolfire & Cassinelli 1986). The small outflow timescale 104 years is consistent with this picture involving rapid high-mass star formation.
The present case of N159W-S has shown that the high-mass star having 37  is formed in a turbulent condition created by the collisional shock. The mass of the N159W-S clump is estimated to be
 toward its CO peak. There is no sign of such dense clumps over the rest of the filament according to our ALMA data, either in CS(J = 2–1) data, whose line-mass detection limit is about 150
  pc−1, or in dust-emission data, whose line-mass detection limit is about
 pc−1 by assuming a filament width of 0.6 pc. This offers an interesting possibility that high-mass stars do not necessarily require dense cloud cores as the initial condition. Instead, high-velocity colliding molecular flows are able to efficiently collect mass into a cloud core non-gravitationally. Inoue & Fukui (2013) discuss that the mass flow in the collision can be efficiently converged into a shock-induced core due to the oblique shock effect and that self-gravity is not important in the beginning of the high-mass star formation, while later, in the shock-collected core, self-gravity will play a role in forming the stellar core (see also Vaidya et al. 2013).
In the Milky Way, we see increasing observational evidence for cloud–cloud collisions that trigger high-mass star formation. Four super star clusters, Westerlund2, NGC 3603, RCW 38, and DSB[2003]179, are found to be formed by collisions between two clouds (Furukawa et al. 2009; Ohama et al. 2010; Fukui et al. 2014, 2015). Isolated O stars with H ii region, M20, RCW 120, etc., are also suggested to be triggered by cloud–cloud collisions (Torii et al. 2011, 2015). N159W-S is in the very early stage of star formation as indicated by the non-detection of ionized gas, as well as by the collision scenario and SED models. Therefore, N159W-S is an optimal source to study filamentary collision leading to star formation. It has been shown that the youngest O stars are formed coevally for  years in NGC 3603 and Westerlund1 by careful measurements of stellar ages with HST and VLT (Kudryavtseva et al. 2012). Here, we have an independent estimate of the stellar age by taking advantage of the simple cloud morphology in N159W-S, and the present timescale estimate is consistent with that of Kudryavtseva et al. (2012).
5. CONCLUSIONS
In this Letter, we presented the 13CO (J = 2–1) observations with ALMA of the active star-forming region N159 west in the LMC. We have found the first two extragalactic protostellar molecular outflows toward young high-mass stars, whose dynamical timescale is ∼104 years. One of the two stars, N159W-S, is clearly located toward the intersection of two filamentary clouds. We set up a hypothesis that two filaments collided with each other ∼105 years ago and triggered the formation of the high-mass star. The results demonstrate the unprecedented power of ALMA to resolve extragalactic star formation.
The authors thank the anonymous referee for helpful comments. This paper makes use of the following ALMA data: ADS/JAO.ALMA#2012.1.00554.S. ALMA is a partnership of ESO (representing its member states), NSF (USA) and NINS (Japan), together with NRC (Canada), NSC and ASIAA (Taiwan), and KASI (Republic of Korea), in cooperation with the Republic of Chile. The Joint ALMA Observatory is operated by ESO, AUI/NRAO and NAOJ. This work was supported by JSPS KAKENHI grant numbers 22244014, 22540250, 22740127, 23403001, 24224005, 26247026; by JSPS; and by the Mitsubishi Foundation. M.M. and O.N. are grateful for support from NSF grant 1312902.