


ABSTRACT
We used the UltraViolet-Optical Telescope on board Swift to systematically follow the dynamically new comet C/2013 A1 (Siding Spring) on its approach to the Sun. The comet was observed from a heliocentric distance of 4.5 AU pre-perihelion to its perihelion at 1.4 AU. From our observations, we estimate that the water production rate during closest approach to Mars was 1.5 ± 0.3 × 1028 molecules s−1, that peak gas delivery rates where between 4.5 and 8.8 kg s−1, and that in total between 3.1 and 5.4 × 10⁴ kg cometary gas was delivered to the planet. Seasonal and evolutionary effects on the nucleus govern the pre-perihelion activity of comet Siding Spring. The sudden increase of its water production between 2.46 and 2.06 AU suggests the onset of the sublimation of icy grains in the coma, likely driven by CO2. As the comet got closer to the Sun, the relative contribution of the nucleus' water production increased, while CO2 production rates decreased. The changes in the comet's activity can be explained by a depletion of CO2, but the comet's high mass loss rate suggests they may reflect primordial heterogeneities in the nucleus.
Export citation and abstract BibTeX RIS
1. INTRODUCTION
Comets formed early in the evolution of the solar system while material was accreting to form planets. When proto-planets became large enough, a population of comets was dynamically ejected into the Oort cloud. Comets entering the inner solar system for the first time are called dynamically new comets. These objects retain some of the most primordial material available for observation in the solar system. Through dynamical evolution, the orbits of Oort Cloud comets can evolve to shorter periods. Halley-type comets are found on the extreme end of this orbital evolution (Oort 1950; Levison 1996).
Dynamically new comets have not been significantly heated by the Sun since they were placed into the Oort Cloud. On approach, their brightness might increase rapidly at large heliocentric distance, and then slower near perihelion (Oort & Schmidt 1951; Whipple 1978). The enhanced activity may be attributed to the evaporation of a crust created by interstellar radiation (Whipple 1978; Johnson et al. 1987; Stern 2003). Volatiles such as CO and CO2 may drive off icy grains, which have relatively high albedos, increasing the amount of sunlight reflected by the coma (A'Hearn et al. 1995). Outbound new comets behave more like evolved Oort Cloud comets. It is unknown in how far such behavior is driven by comet evolution (the removal of outer layers) or by primordial heterogeneity reflecting comets' origins within the solar nebula.
Few dynamically new comets have been systematically studied at large heliocentric distance and throughout their orbit (cf. A'Hearn et al. 1984; Biver et al. 1997; Meech et al. 2009) Here, we present the results of our long-term monitoring campaign of comet C/2013 A1 (Siding Spring) using the Swift space telescope facility. The comet was first discovered 7.2 AU from the Sun, and passed Mars at a distance of 141,000 km on 2014 October 19. Calculations of its original reciprocal semimajor axis suggest that Siding Spring is a dynamically new comet (Nakano 2014; Williams 2014)
2. OBSERVATIONS AND DATA ANALYSIS
Swift is a multi-wavelength observatory equipped for rapid follow-up of gamma-ray bursts (Gehrels et al. 2004). Our observations use its Ultraviolet and Optical Telescope (UVOT) that provides a 17 × 17 arcminutes field of view, a plate scale of 1 arcsec/pixel, and a point-spread function of 2 5 FWHM (Mason et al. 2004). Swift/UVOT is equipped with seven broadband filters that cover wavelengths between 1800 and 6000 Å. The detector is a microchannel plate intensified CCD, and each incident photon on its photocathode is amplified million-fold using a three stage multichannel plate.
Swift observed C/2013 A1 (Siding Spring) 10 times between 2013 November and 2014 October (Table 1). Each observation consisted of at least two orbits, and during each orbit several exposures were acquired with the UVW1 and V-band filters. The U-band filter was used only during the two visits in 2014 October. Swift tracked the sky at the sidereal rate and used short, 200 s exposures to minimize smearing due the comet's motion. The comet's apparent motion warrants different sky backgrounds between visits, and background stars are suppressed effectively by stacking individual exposures using a resistant mean algorithm (Figure 1). This algorithm is less effective in the V-band, where fewer individual exposures are available.
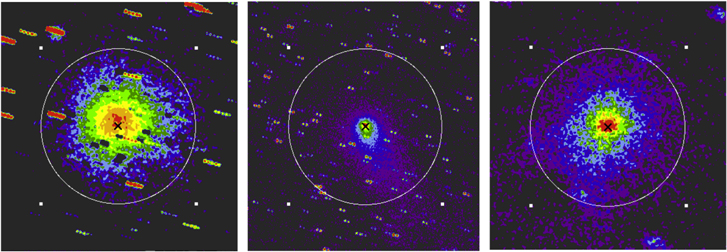
Figure 1. Swift/UVOT observations of C/2013 A1 on 2014 October 13. Each image consists of several median stacked exposures to improve SNR and remove background stars. All images have the same physical scale (430 arcsec, equivalent to 440,000 km at the comet), are oriented in sky-coordinates (north up, east to the left), and have been individually stretched logarithmically for optimal presentation. Left: UVW1–V (OH). Middle: V-band. Right: U–V (CN). Black crosses mark the position of the nucleus. White circles indicate a distance of 141,000 km, the separation between the comet and Mars during closest approach.
Download figure:
Standard image High-resolution imageTable 1. Summary of the Observing Log
| Date | rh | Δ | ρ | Q (H2O) | mV | mUVW1 |
|---|---|---|---|---|---|---|
| (UT) | (AU) | (AU) | (km) | (1027 molec s−1) | ||
| 2013 Feb 11 | 4.54 | 3.98 | 7.22E+04 | <5.5 | 15.5 ± 0.01 | 17.8 ± 0.03 |
| 2013 Dec 28 | 4.01 | 3.63 | 5.26E+04 | <2.8 | 15.4 ± 0.01 | 17.9 ± 0.03 |
| 2014 Feb 17 | 3.49 | 3.78 | 5.48E+04 | <3.2 | 15.2 ± 0.01 | 17.9 ± 0.03 |
| 2014 Mar 16 | 3.23 | 3.79 | 5.49E+04 | <2.9 | 15.1 ± 0.01 | 17.6 ± 0.03 |
| 2014 May 29 | 2.46 | 3.00 | 5.45E+04 | 2.42 ± 0.92 | 14.1 ± 0.01 | 16.1 ± 0.03 |
| 2014 Jul 09 | 2.06 | 2.07 | 1.12E+05 | 11.1 ± 1.0 | 12.0 ± 0.01 | 13.4 ± 0.03 |
| 2014 Aug 19 | 1.69 | 1.04 | 1.13E+05 | 12.1 ± 0.27 | 10.3 ± 0.01 | 11.2 ± 0.03 |
| 2014 Sep 18 | 1.50 | 0.99 | 1.08E+05 | 13.0 ± 0.45 | 10.6 ± 0.01 | 11.1 ± 0.03 |
| 2014 Oct 13 | 1.41 | 1.48 | 8.05E+04 | 12.5 ± 0.62 | 11.7 ± 0.01 | 12.4 ± 0.03 |
| 2014 Oct 23 | 1.40 | 1.70 | 9.25E+04 | 17.2 ± 0.50 | 9.8 ± 0.01 | 11.6 ± 0.03 |
Note. ρ is the radius of the aperture at the distance Δ to the comet used to derive water production rates Q. The errors and upper limits are 3σ stochastic errors, and for the magnitudes systematic errors are given. For the first four observations (4.54–3.23 AU) we assumed a reddening of 5% per 1000 Å, after that 10% per 1000 Å for the continuum removal.
Download table as: ASCIITypeset image
Table 2. Total Comet Gas Column Densities, and Peak Fluxes, and Total Gas Mass at Mars
| Gas | Production Rate | Rel. Abundance | Ncol | Fpeak | Total Mass |
|---|---|---|---|---|---|
| (1027 molec. s−1) | (%) | (1015 m2) | (1011 m−2 s−1) | (kg) | |
| H2O | 15 | 100 | 6.3 | 14.7 | 6885 |
| OH | ⋯ | ⋯ | 10.3 | 15.2 | 10,543 |
| O | ⋯ | ⋯ | 7.3 | 6.2 | 7002 |
| H | ⋯ | ⋯ | 3.5 | 3.2 | 209 |
| CO2 | 1.18 | 0.08 | 1.86 | 3.0 | 4929 |
| TOTAL | 16.2 | ⋯ | 30.6 | 44.5 | 29,569 |
Note. Only photodissociation of H2O is considered for the production of fragment species.
Download table as: ASCIITypeset image
The broadband filters provide a measure of the comets' water and dust production rates (Bodewits et al. 2014). The UVW1 filter (central wavelength 2600 Å, FWHM 700 Å) is well placed to observe the three very strong OH vibrational transitions between 2811 and 3122 Å, and the U filter (central wavelength 3501 Å, FWHM 875 Å) contains the strong CN Δv = 0 band at 3876 Å. Both filters also contain reflected continuum. To remove this, we weigh a solar spectrum with the UVOT filter transmissions to determine how much the continuum contributes to the UVW1 and U flux. Li et al. (2014) measured a reddening of 5% per 1000 Å between 438 Å and 589 Å in 2013 October, increasing to 9% per 1000 Å in 2014 March, within a 5000 km radius aperture. We calculated the ratio between the fluxes measured in the two filters for both reddening slopes, which gives the continuum removal factors. Those are UVW1/V = 0.135–0.130, and U/V = 0.508–0.484 for 5 and 9% per 1000 Å, respectively (for units of flux). We then measured fluxes in circular apertures with radii between 25 and 150 arcsec.
Correcting for the filter transmission at the relevant wavelengths, the measured fluxes can be converted into column densities using heliocentric distance and velocity dependent fluorescent efficiencies (Schleicher & A'Hearn 1988). To derive water production rates, we compare the measured OH content of the coma with an OH distribution calculated using the vectorial model (Festou 1981; Combi et al. 2004) and assuming that the bulk outflow velocity decreases with the heliocentric distance as v = 0.86 r−1/2 km s−1 (Delsemme 1982).
At magnitudes between 15.5 < mV < 10 and 18 < mUVW1 < 11 in the apertures used for this analysis (Table 1), Siding Spring was easily observable by Swift. UVOT is well calibrated, and systematic errors are of order 5% (Poole et al. 2008). Its filters are broadband filters and the continuum removal adds significantly to the uncertainty of our water production rates. The continuum contribution to flux in the UVW1 filter decreased from 88% on rh = 2.46 AU to 21% on rh = 1.5 AU, after which it increased again. The effect of the assumed reddening depends on this continuum contribution; increasing the reddening from 5 to 10% per 1000 Å results in a 40% larger water production rate at rh = 2.46 AU, and a 9% higher production rate at 1.40 AU. The effect is <5% for all other measurements. Similarly, C2 may contribute as much as 20% to the flux in the V-band (Bodewits et al. 2014), which can lead us to underestimate water production rates. The effect on water production rates is less than 10% between rh = 1.7 and 1.41 AU, but may be as large as 20–40% for the observations at rh = 2.05 and 1.40 AU, respectively. However, given the consistency between the rh = 1.40 AU and the better-constrained measurement on rh = 1.41 (<7%), we expect the effect of contamination on these observations to be minor.
3. RESULTS
3.1. Water Production Rates and Active Area
Water production rates are summarized in Figure 2. Between 4.5 and 3 AU, we derived 3σ upper limits of 1027 molecules s−1 from the UVW1 images, consistent with the production rate derived from the first positive detection of OH emission at a heliocentric distance of 2.46 AU. The production rate then increased very rapidly from 2.42 ± 0.9 × 1027 molecules s−1 at 2.46 AU to 1.11 ± 0.1 × 1028 molecules s−1 at 2.1 AU, a five-fold increase, but reached a plateau between 2.0 AU and perihelion (2014 October 25.3 at rh = 1.399 AU).

Figure 2. Water production rates of C/2013 A1 as function of heliocentric distance. Downward arrows indicate 3σ upper limits. Filled, red triangles indicate CO2 production rates from Stevenson et al. (2015) and Kelley et al. (2014). Most error bars are the size of the symbols.
Download figure:
Standard image High-resolution imageTo further investigate the behavior of the comet's water production rate, we derived the required minimum active area corresponding to the measured water production using the sublimation model by (Cowan & A'Hearn 1979), assuming that every surface element has constant solar elevation (as would be the case if the rotational pole were pointed at the Sun or if the nucleus was very slowly rotating) and is therefore in local, instantaneous equilibrium with sunlight. This maximizes the sublimation averaged over the entire surface, and results in a minimum total active area. We further assumed a Bond albedo of 0.02 (see, e.g., Li et al. 2013) and 100% infrared emissivity. The results are shown in Figure 3. The computed active area of Siding Spring is highly variable over time. The steep increase in the water production rate between 2.46 and 2.1 AU requires a four-fold increase in the active area, from 4.4 to 17 km2. The active area then decreased to ∼9 km2 around perihelion. It is also interesting to note that the comet's active area within 2.1 AU from the Sun was larger than those derived from upper limits for the observations of the comet at 3.49 and 3.23 AU (14 and 8.4 km2, respectively). If the activity were driven by sublimation from a constant area on the nucleus, Swift would have detected OH much earlier. This disparity thus suggests that the origin of the comet's water changed between 3 and 2 AU pre-perihelion.
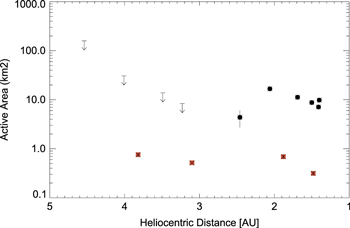
Figure 3. Active area for H2O (black circles) and CO2 (red squares), calculated from measured production rates and assuming a local thermal equilibrium model. Most error bars are the size of the symbols.
Download figure:
Standard image High-resolution image
3.2. Comet Gases Delivered to Mars
Before the close encounter, it was predicted that the upper atmosphere of Mars might be severely perturbed by the mass and energy delivered by neutral or ionized cometary gases (Gronoff et al. 2014; Yelle et al. 2014). Interpolating the values measured on 2014 October 13 and 23, we estimate the water production rate during the comet's close encounter with Mars on October 19 to be 1.5 ± 0.3 × 1028 molecules s−1, where the range represents the difference between the production rates measured on 2014 October 13 and 23. The last infrared observations of the comet occurred a month before encounter, on 2014 September 21, and NEOWISE observations by Stevenson et al. (2015) yield a CO2 production rate of 1.18 ± 0.12 × 1027 molecules s−1. However, the NEOWISE observations cannot directly discriminate between CO2 and CO, as both molecules have an emission band in the 4.6 μm filter. The fluorescence efficiency of the CO2 ν3 band is 11 times stronger than the CO 1  0 band (Crovisier & Encrenaz 1983). Given that the CO/CO2 production rate ratio is typically of order 1, CO2 is most likely responsible for the NEOWISE observed gas emission.
Assuming a constant CO2 production rate of 1.2 × 1027 molecules s−1 we calculated column densities and particle fluxes for the comet gas delivered to Mars using a Haser model (Table 2; see Bodewits et al. 2011 for details). Most of the comet's water has been photodissociated into OH, the dominant water fragment at 141,000 km. At this distance from the nucleus, OH is the dominant molecule, both in number and in mass, followed by H2O and atomic oxygen. Peak gas mass delivery rates to Mars reached 4.5 kg s−1 during closest approach and totaled 3.0 × 10⁴ kg. If CO is instead the molecule responsible for the IR flux, with a production rate of 1.3 × 1027 molecules s−1, it would have been the dominant molecule delivered to Mars. In that scenario, a total mass of 5.4 × 10⁴ kg would have been delivered to Mars, with a peak flux of 8.8 kg s−1, i.e., almost twice as much as in the CO2-scenario. Based on Hubble Space Telescope (HST) observations from early 2014 (Li et al. 2014), dynamical models showed that only dust grains that can reach the Martian system are those ejected with speeds of a few meters per second, have radii of 0.7–3.6 mm, and are ejected at least 1.5 yr (rh > 3 AU) prior to the encounter (Kelley et al. 2014; Tricarico et al. 2014). The activity of the comet during closest approach to Mars does not affect the predicted dust delivery of 100 kg (Kelley et al. 2014). The mass of the gas delivered to Mars thus exceeds the mass of the dust by two orders of magnitude.
4. DISCUSSION
The activity of comet nuclei is complex. They may exhibit varying amounts of activity across their surfaces due to heterogeneities in the nucleus, local topography, due to physical evolution, etc. In this section, we will discuss what processes may have driven the changes in activity of Comet Siding Spring.
After H2O, CO2 and CO are the most abundant ices in comet nuclei and both gases can drive comet activity (A'Hearn et al. 2011; Ootsubo et al. 2012; Feaga et al. 2014). For Siding Spring, CO2 production rates were reported by Stevenson et al. (2015) and Kelley et al. (2014). Between 3.8 and 3.1 AU, they report CO2 production rates of 3.5 × 1026 molecules s−1, which, compared to our upper limit of Q(H2O) < 1027 molecules s−1, suggests a CO2/H2O abundance of at least 35% at those heliocentric distances, consistent with other comets observed at 4–3 AU by Ootsubo et al. (2012). CO2 production rates initially increased as the comet reached a heliocentric distance of 1.9 AU but then decreased as the comet moved further inwards. Comparing this again to the water production rates, the CO2/H2O coma abundance decreased from 13 to 9% between 1.9 and 1.5 AU. This decrease within 2 AU is more pronounced when calculating the active area required for the CO2 production (Figure 3), which appears to be more or less constant outside 1.9 AU. While we recognize the low-number statistics here, the variation of the CO2 area (20%) might be a rotational effect and is consistent with the amplitude of the variation in the water production rates measured on October 13 and 23.
The water production and corresponding active area increases steeply between 2.46 and 2.1 AU pre-perihelion, whereas the active area of CO2 appears to be constant during that period. Swift's non-detection of OH between 3 and 4 AU at levels where the comet should have been detected had the comet had a constant active area on approach, suggests that's an additional source of water was activated between 2.46 and 2.06 AU. Based on the varying orientation of jets projected in sky plane near the nucleus, Li et al. (2014) presented two possible orientations for the rotational pole of the nucleus. In the first scenario, the subsolar point would move quickly from the one hemisphere to the other between 2.0 AU and perihelion, crossing the equator in early 2014 September (rh ∼ 1.55 AU). In their second solution, the subsolar point remains on one hemisphere until rh ∼ 1.5 AU post-perihelion. Both pole solutions predict a very small change in latitude for the subsolar point on the comet's surface (5°–10°) at >2 AU inbound, making it unlikely that this change in activity reflects a heterogeneous distribution of ices. Models suggest that isothermal sublimation rates increase by two orders of magnitude between 3 and 1.6 AU (Cowan & A'Hearn 1979). We therefore attribute the sudden increase in the water production rate between 2.46 and 2.06 AU pre-perihelion to the increased sublimation rate of icy grains. The presence of icy grains is consistent with the spatial and temporal variations of the color in the dust coma within 5000 km from the nucleus as observed by HST at 4.6, 3.8, and 3.3 AU (Li et al. 2014).
Water production rates plateaued between 1.7 and 1.4 AU, and the active areas of both H2O and CO2 decreased. Sublimation rates of the nucleus' active areas likely increased with the increased solar flux, increasing the relative contribution of the nucleus to the water production (this increased efficiency is especially important when assuming that a large fraction of the nucleus was active). In both pole solutions by Li et al. (2014) the latitude of the sub-solar point changed by 50°–60° during this period. In one solution new parts of the surface may have become active; in the other solution, the sub solar point remained in at latitudes that had been heated before. The decrease of the CO2 abundance may thus be due to a paucity of CO2 on the hemisphere illuminated near perihelion, or due to evolutionary processes, such as the retreat of the more volatile CO2 ice.
The behavior of C/2013 A1 (Siding Spring) is strikingly similar to that of comet C/2009 P1 (Garradd) before its perihelion a bright Oort Cloud comet that could be observed throughout most of its apparition. Garradd's activity was highly asymmetric around perihelion (Bodewits et al. 2014; Feaga et al. 2014). Inbound, observations suggested a strong extended source of water (Bockelée-Morvan et al. 2012; Paganini et al. 2012; Combi et al. 2013), that were not removed during the comet's distant outburst but instead were continuously replenished (Combi et al. 2013). By comparing water production rates derived from Swift/UVOT observations with those acquired with instruments using smaller apertures, Bodewits et al. were able to separate the two sources of water. They concluded that between rh = 3.0 AU and perihelion (rh = 1.54 AU), H2O was produced predominantly from ice in the coma (Bodewits et al. 2014). The disappearance of the grains coincided with a strong decrease in the ratio between CO2 and H2O production rates between 3 and 2 AU, from which we tentatively concluded that a disappearing CO2 source drove the icy grains into the coma of comet Garradd (Decock et al. 2013; Bodewits et al. 2014; McKay et al. 2015).
It has been suggested that dynamically new comets are more active than short period comets (Meech et al. 2004). The minimum active area of 4.4 km2, derived from the production rates at 2.46 AU, is likely the closest approximation to the contribution of the nucleus' surface to the total water production rate. If this is indeed representative of the size of the nucleus it implies a minimum radius of 600 m, consistent with current size estimates from MRO/HiRISE (Tamppari et al. 2014). Integrating the water and CO2 production rates between 2014 May 28 and 2014 October 23, we find that the comet lost 1.6 × 1035 H2O molecules and 2 × 1034 CO2 molecules, equivalent to 6 × 10⁹ kg of ice. Assuming a dust-to-gas ratio of 4 as was observed by Rosetta around 67 P/Churyumov–Gerasimenko (Rotundi et al. 2015), the comet lost approximately 3 × 10¹⁰ kg of material on its way to perihelion. If the comet indeed were only 600 m in radius, this would be as much as 10% of its entire mass, or a global layer of 2 m. Such as a large mass loss rate would imply a continuous exposure of fresh material on the comet's approach to perihelion, which would suggest that the observed changes in activity reflected a primordial heterogeneity of the nucleus.
5. SUMMARY
We obtained optical and UV images of comet C/2013 A1 (Siding Spring) using the Swift/UVOT from 4.5 to 1.4 AU pre-perihelion. The comet's water production rate did not follow a simple relation with increasing insolation but changed over time. The comet's activity may be summarized as follows.
- 1.rh > 2.5 AU: CO2 sublimation from a constant area on the nucleus, H2O production too low to detect.
- 2.2.5 < rh < 2.0 AU: increased sublimation rate of icy grains rapidly increases the water production.
- 3.rh < 2.0 AU: rapid change of the subsolar latitude, resulting in insolation of new parts of the surface depending on pole solution. Effective water sublimation from nucleus begins, and CO2 production rate decreases.
The changes in the comet's activity may be explained by seasonal and evolutionary processes, and the comet may have shed as much as 10% of its mass on approach. To disentangle the effect of these processes it is necessary to compare the activity behavior of a large sample of dynamically new comets to more evolved Oort Cloud comets.
We thank the Swift team for use of observing time granted through the Director's Discretionary program and the Guest Investigator program, and for the careful and successful planning of our observations. D.B. and T.L.F. received support through the Swift Guest Investigator program (Swift Cycle 10, program NNH13ZDA001N). This research was supported by a contract to the University of Maryland by the NASA JPL Mars Critical Data Products Program.