


ABSTRACT
We present the first constraint on the Faraday rotation measure (RM) at submillimeter wavelengths for the nucleus of M87. By fitting the polarization position angles (χ) observed with the Submillimeter Array at four independent frequencies around ∼230 GHz and interpreting the change in χ as a result of external Faraday rotation associated with accretion flow, we determine the RM of the M87 core to be between −7.5 × 10⁵ and 3.4 × 10⁵ rad m−2. Assuming a density profile of the accretion flow that follows a power-law distribution and a magnetic field that is ordered, radial, and has equipartition strength, the limit on the RM constrains the mass accretion rate  to be below 9.2 × 10⁻⁴ M☉ yr−1 at a distance of 21 Schwarzschild radii from the central black hole. This value is at least two orders of magnitude smaller than the Bondi accretion rate, suggesting significant suppression of the accretion rate in the inner region of the accretion flow. Consequently, our result disfavors the classical advection-dominated accretion flow and prefers the adiabatic inflow–outflow solution or convection-dominated accretion flow for the hot accretion flow in M87.
Export citation and abstract BibTeX RIS
1. INTRODUCTION
Revealing the mass accretion process onto supermassive black holes (SMBHs) is crucial for understanding the nature of active galactic nuclei (AGNs) because it is believed that the mass accretion fuels an SMBH, supports its nuclear luminosity, and presumably powers its outflow. Given the simplest approximation of an axisymmetric adiabatic accretion flow onto an SMBH, Bondi (1952) derived a black hole (BH) accretion power  , where
  is the Bondi accretion rate which is defined at the sphere of the gravitational influence of the SMBH (i.e., the Bondi radius rB).
The active galaxy M87, one of the well-known low-luminosity AGNs, possesses a huge BH mass M• = (3.2–6.6) × 109 M☉ (Macchetto et al. 1997; Gebhardt et al. 2011; Walsh et al. 2013) with a prominent relativistic jet.4 The estimated jet power is in a range between ∼1042 and 1044 erg s−1 (Li et al. 2009 and references therein) and seems to match fairly well with the overall energetics described by the Bondi accretion5 (PB ∼ 7 × 1045 erg s−1) at rB ≃ 230 pc. However, the central core of M87 is highly underluminous in the X-ray band and its X-ray luminosity is smaller than PB by five orders of magnitude (LX ∼ 7 × 1040 erg s−1; Di Matteo et al. 2003). The low X-ray luminosity implies the existence of radiatively inefficient accretion flows (RIAFs) and/or a substantial decrease of the mass accretion rate  at radii r ≪ rB.
The theory of RIAFs, such as the advection-dominated accretion flow (ADAF; Ichimaru 1977; Narayan & Yi 1995), convection-dominated accretion flow (CDAF; Narayan et al. 2000; Quataert & Gruzinov 2000), and adiabatic inflow–outflow solution (ADIOS; Blandford & Begelman 1999) was developed over the last decades. The resulting mass accretion rates toward an SMBH normalized by the Bondi accretion rate can be scaled as a function of the spherical radius as  with κ = 0 − 1. Considering the viscosity parameter α ⩾ 0.01 (Shakura & Sunyaev 1973), solutions of classical ADAFs suggest a mass accretion rate from rB to rs that is comparable to
  :
:  (GADAF stands for "giant" ADAF; Narayan & Fabian 2011). On the other hand, CDAFs exhibit a substantial decrease of the mass accretion rate toward r ≃ rs as
  (Igumenshchev & Narayan 2002). The ADIOS, which generalizes the ADAF model by including the disk wind, can take intermediate values of κ anywhere between 0 (ADAF) and 1 (CDAF). Recent numerical simulations favor κ ∼ 0.4–0.7 which is consistent with ADIOS (e.g., Pang et al. 2011; Yuan et al. 2012).
There has been a growing consensus during the last decade that millimeter (mm)/submillimeter (submm) polarimetry provides useful diagnostics to infer  of RIAFs at r ≪ rB (Agol 2000; Quataert & Gruzinov 2000). In particular, through the Faraday rotation measure (RM; an integral of the product of the thermal electron density and the magnetic field component along the line of sight) of the linear polarization,
  toward Sgr A* was examined (e.g., Bower et al. 2003; Marrone et al. 2006; Macquart et al. 2006) and an upper limit of
  was found to be ⩽10−7–10−6 M☉ yr−1 at r ≲ 100 rs (rs is the Schwarzschild radius). We note that the submm wavelengths are more advantageous than other radio bands for determining the RM because the bandwidth depolarization is less significant, and the opacities of the accretion flow and the jet are smaller so that one can probe regions closer to the BH. However, efforts to determine the
  of AGNs (including M87) have never been undertaken except for Sgr A*.
For M87, all previous efforts on measuring the RM primarily focused on either the jet or radio lobes at centimeter wavelengths. Owen et al. (1990) found RM values of a few thousand rad m−2 at lobes (interpreted as arising from a foreground Faraday screen) and of a few hundred rad m−2 in the kiloparsec-scale jet. More recently, Algaba et al. (2013) found similar RM values with a hint of gradients across the kiloparsec jet. On upstream parsec scales, Junor et al. (2001) found an average RM of ∼−4400 rad m−2 with regions that show both positive and negative signs. Zavala & Taylor (2002) found similar results and explained the origin of the observed RM with foreground medium not directly associated with the jet. To our knowledge, no mm/submm polarization observations for examining RM toward M87 have been conducted.
In this Letter, we present the first measurement of RM toward the M87 nucleus at submm wavelengths. We also derive the mass accretion rate  onto the BH based on the measured RM and provide a constraint on RIAF models. In Section 2, we introduce our Submillimeter Array (SMA) observation of the RM together with our data reduction. In Section 3, we show our main results. The estimation of
  , the discussion on the preferred RIAF models, and alternative interpretations of RM are presented in Section 4.
2. OBSERVATIONS AND DATA REDUCTION
M87 was observed in the 230 GHz band on 2013 January 23 with the SMA (Ho et al. 2004).6 The observation was conducted with seven antennas in the extended array configuration. The weather condition was excellent during the observation with an atmospheric opacity τ225 ∼ 0.05. The total length of time on M87 was 8 hr. The SMA receivers operate in double sideband mode with each sideband having a width of 4 GHz. Each sideband was further split into a pair of 2 GHz wide intermediate frequency (IF) sub-bands. We centered those IFs at 230.3 and 232.3 GHz in the upper sideband (USB) and at 218.4 and 220.4 GHz in the lower sideband (LSB), respectively. The SMA polarimeter was used to sample all four polarized correlations (Left-Left, Left-Right, Right-Left, and Right-Right) by switching the polarization between the left-hand and right-hand circularly polarized feeds in a period with 16 Walsh function patterns. A detailed discussion of the SMA polarimetry system is given in Marrone (2006) and Marrone & Rao (2008).
We performed initial flagging and calibrations including the flux, bandpass, and gain calibrations in the MIR-IDL package developed for the SMA. We conducted polarization calibration, imaging, and data analysis in the MIRIAD package (Wright & Sault 1993). The flux calibration was done with measurements of Callisto, and we performed bandpass, amplitude, and phase calibration with frequent observations of the quasar 3C279, which is 19 2 away from M87. To perform polarization calibration, we observed 3C279 and 3C84 over a large range of parallactic angles and solved for quasar polarization and leakage terms. The average values of the instrumental polarization (D terms) or "leakage" were approximately 1%–2% in the USB and 4%–5% in the LSB. The leakage terms derived from 3C279 and 3C84 were in excellent agreement with each other. We estimated the accuracy of the leakage terms to be ∼0.5%.
After deriving the D terms, we corrected the gain of M87 data by self-calibration (phase-only) techniques in order to increase the dynamic range, and then applied polarization leakages. We performed imaging and deconvolution with I, Q, U, and V imaged individually for each IF band in each sideband, leading to four sets of I, Q, U, and V images. The final synthesized beams for the continuum images are 1 2 × 08 (corresponding to ∼ (1.7 × 1.0) × 105rs). Finally, we used the task IMPOL in MIRIAD along with the Q and U maps to derive total linearly polarized intensity and distribution of the electric vector position angles (EVPAs). The magnetic field distribution of M87 were obtained by rotating the EVPAs by 90°.
3. THE ROTATION MEASURE OF THE M87 CORE
In Figure 1 we show a sample Stokes images of M87 in the 232.3 GHz band. Figure 2 shows the magnetic field distribution. One can see that the magnetic vector orientations are perpendicular to the jet in knots A and C and parallel in knot B. This is in good agreement with the polarization characteristics derived from observations at centimeter wavelengths and optical band (e.g., Owen et al. 1989; Perlman et al. 1999), indicating the robustness of our polarization observation and calibration. In Table 1, we show the I, Q, and U fluxes, polarization fractions, and the EVPA of the M87 core for each of the four bands in the observation. In the following, we will interpret the change of the polarization position angle (P.A.) χ as a result of external Faraday rotation associated with accretion flow. The reason why we prefer this interpretation will be explained in Section 4.2.
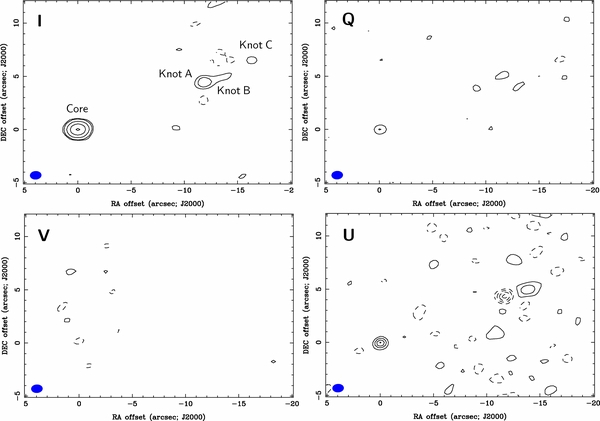
Figure 1. Sample Stokes images of M87 from the IF2 band of the USB data. The synthesized beam (bottom left in each panel) is 12 × 08. Panels clockwise from top left show I, Q, U, and V. For Stokes I, we draw contours at −10, −5, 5, 10, 40, 160, and 480 times the 3 mJy beam−1 rms noise in the image. For Q, U, and V, we draw contours at −12, −9, −6, −3, 3, 6, 9, and 12 times the rms noise in the image, which is 1.3, 1.3, and 2.2 mJy beam−1 for Q, U, and V, respectively.
Download figure:
Standard image High-resolution image
Figure 2. Total intensity of M87 at the 232.3 GHz band in gray scale. The orange segments show the magnetic vector position angles (MVPAs) derived for the same band. The MVPAs were obtained by rotating the EVPAs by 90°. The clumps from left to right in the figure are the nucleus (core), and jet knots A, B, and C, respectively. The synthesized beam is shown in the bottom right of the image.
Download figure:
Standard image High-resolution imageTable 1. 230 GHz Polarization Measurements of M87 Nucleus
| Frequency | ν | I | Q | U | m | χ |
|---|---|---|---|---|---|---|
| Band | (GHz) | (Jy) | (mJy) | (mJy) | (%) | (deg) |
| USB; IF 1 | 230.3 | 1.602 ± 0.003 | 8.1 ± 1.3 | 14.7 ± 1.3 | 1.05 ± 0.08 | 30.7 ± 2.2 |
| USB; IF 2 | 232.3 | 1.594 ± 0.003 | 8.2 ± 1.4 | 16.2 ± 1.3 | 1.14 ± 0.08 | 31.6 ± 2.0 |
| LSB; IF 1 | 220.4 | 1.598 ± 0.003 | 8.4 ± 1.3 | 16.6 ± 1.4 | 1.16 ± 0.08 | 31.4 ± 1.9 |
| LSB; IF 2 | 218.4 | 1.601 ± 0.003 | 9.7 ± 1.2 | 13.6 ± 1.5 | 1.05 ± 0.08 | 27.3 ± 2.0 |
Notes. I, Q, and U fluxes, polarization fraction (m), and polarization position angles (χ) at the four IF bands. Errors in the I, Q, and U fluxes are from image rms only. They do not include the absolute flux calibration uncertainty, which is the same for all bands.
Download table as: ASCIITypeset image
Faraday rotation changes the observed χ as a function of observing wavelength λ according to
where χ0 is the intrinsic polarization angle and RM is the rotation measure. We determine the RM of the M87 core by fitting the polarization P.A. (χ = 0.5 (U/Q)) from four independent frequencies within the SMA band based on the Q and U maps from the observation. The Q and U values for RM are measured by taking the peak fluxes of the Q and U maps, with the image rms uncertainty as the measurement error for Q and U. The uncertainty in χ is calculated from an error propagation of the Q and U uncertainties.
In Figure 3 we show the EVPAs at the four frequencies with 1σ error bars, together with a fit for the RM in the M87 core. The best-fit RM is −(2.1 ± 1.8) × 105 rad m−2. Therefore, we determine the RM to be in the range between −7.5 × 10⁵ and 3.3 × 10⁵ rad m−2 with a 3σ confidence level. Since we are interested in an upper limit of the mass accretion rate, which is derived from the upper-limit (absolute value) of the RM (see Section 4.1), we use 7.5 × 10⁵ rad m−2 for the RM in the following discussion.

Figure 3. RM fit at the center of the M87 core based on the polarization position angles measured at four different frequencies. The best-fit RM is −(2.1 ± 1.8) × 105 rad m−2. The error bars are derived from the 1σ image uncertainty of the Q and U maps.
Download figure:
Standard image High-resolution image4. DISCUSSION
4.1. Constraints on Mass Accretion Rate and Its Accretion Flow Model
To constrain  with the RM, we essentially follow the procedure outlined in Marrone et al. (2006). The primary assumption in this method is that the hot accretion flow in front of a source of synchrotron emission causes Faraday rotation. The model also assumes that the density profile of the accretion flow follows a power-law distribution (n ∝ r−β) and that the magnetic field is well ordered, radial, and of equipartition strength.
In the case of M87, we further assume that the innermost jet (i.e., its base) provides the dominant background polarized emission in the submm band (see Figure 4). Note that while polarized emission could be emitted along the jet all the way from close to the BH to radii beyond rB, the dominant polarized emission at 230 GHz most likely originates from the jet base. This is because the majority of our SMA flux density (1.6 Jy) can be explained by the emission from the jet base at the center of M87. Based on the very long baseline interferometry (VLBI) observation of M87 at 230 GHz, Doeleman et al. (2012) show that the jet base has a flux density of 1 Jy and a size of 5.5rs. By using the core–shift relationship (Hada et al. 2011), Nakamura & Asada (2013) determine the offset of the jet base from the BH at 230 GHz to be 4.3rs (in projected distance). Therefore, these studies imply that the dominant background emission quite likely originates from within a few rs from the BH. Nonetheless, we currently cannot exclude the possibility of polarized emissions from the diffuse part of the jet, and this issue will be addressed with future high-resolution observations.
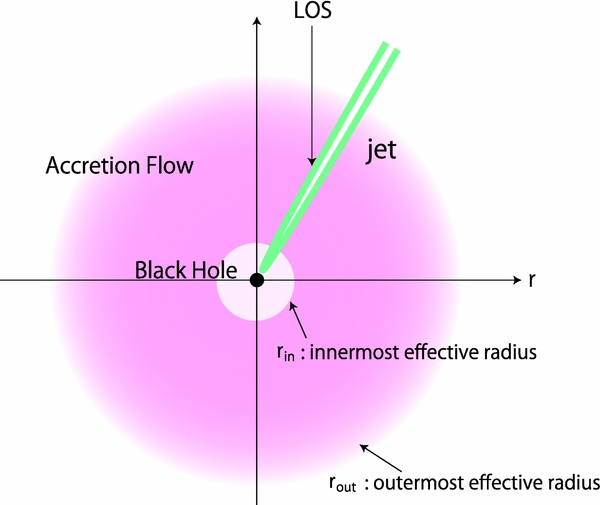
Figure 4. Envisioned accretion flow in M87 for deriving the rotation measure. We assume that the M87 jet offers the background polarized emission for the Faraday rotation, and the dominant contribution comes from the innermost core of the jet. rin and rout are the inner and outer edges of the Faraday screen in the accretion flow where the electrons are sub-relativistic and the magnetic field is coherent.
Download figure:
Standard image High-resolution imageBased on Equation (9) in Marrone et al. (2006), we express  as a function of RM as
where β is a parameter depending on the accretion flow models (β = 1/2–3/2 accounts for all varieties of accretion models). In the above equation, rin and rout are the inner and outer edges of the Faraday screen (in units of rs) where the electrons are sub-relativistic and the magnetic field is coherent. We remark that the electrons within rin make a small or negligible contribution to the RM because they become relativistic (i.e., Te > TRel = 6 × 10⁹ K = mec2/kB) and RM is, thus, suppressed (Quataert & Gruzinov 2000).
In order to derive  with the above equation, it is important to determine rin and rout. We estimate rin based on the observed flux density of M87 from VLBI observations. As we described above, thermal electrons within rin become relativistic and can emit significant synchrotron radiation that dominates the emission from the accretion disk (Yuan et al. 2003). Since it is expected that a hot accretion flow would be optically thick at centimeter wavelengths, the size of the region with relativistic plasma can be constrained by using the observed flux density and brightness temperature. For M87, the observed total flux density of the nucleus is 1 Jy from the VLBI observation at 43 GHz (Abramowski et al. 2012). Since the brightness temperature of the hot electrons within rin must be at least 6 × 10⁹ K, the diameter (i.e., 2 rin) of the emitting region of relativistic plasma can be constrained to be ⩽0.32 mas (= 42rs). Since the observed flux density sets an upper limit on the amount of emission from relativistic electrons, it leads to an upper bound on rin of 21rs. On the other hand, if the innermost jet resides right in front of the emitting region of the relativistic plasma and the emission from the hot electrons is totally absorbed by the optically thick jet, we cannot constrain the size of the region of the relativistic plasma directly from the observed flux. However, we can use the size of the innermost jet to constrain rin. The observed size of the VLBI core at 43 GHz is 17 ± 4rs (Asada & Nakamura 2012). If the emission from the hot electrons is totally absorbed, rin must be smaller than 17 ± 4rs. Therefore, the 21rs upper bound for rin is reasonable even for this case. We fix rout to be at the Bondi radius rB. Here, rB is just a convenient value to choose while rout is not well determined. This is a reasonable choice because
  is insensitive to rout, and
  will only change by a factor of order unity even if rout ≪ rB. With these values, our new measurement of RM sets an upper limit
  of 9.2 × 10⁻⁴ M☉ yr−1 at 21rs for β ⩽ 3/2. This corresponds to 7.4 × 10⁻³
  , which is at least two orders of magnitude smaller than the Bondi accretion rate. This value implies that the mass accretion rate is significantly suppressed while material is accreted and falling in from rB to 21rs.
Determining  provides an effective way to constrain accretion flow models because each model has its own unique
  profile. The ADAF model requires
  to be comparable to
  from rB all the way to r ∼ rs, while the ADIOS and the CDAF models require suppression of
  as (r/rB)κ
 , where r is the radius from the BH with 0 < κ < 1 for ADIOS and κ = 1 for CDAF. Since our new results suggest significant suppression of
  at the radius of 21rs, they disfavor the possibility of a classical ADAF and prefer ADIOS/CDAF. This result is in good agreement with the findings from nearly all numerical simulations (Yuan et al. 2012).
The maximum radiative power that can be extracted from mass accretion is Prad =  ≃ 7 × 1045 η
  erg s−1, where η is the radiative efficiency. With our upper limit of 9.2 × 10⁻⁴ M☉ yr−1 (= 7.4 × 10⁻³
  ), the maximum radiative power is estimated to be 5 × 1042 erg s−1 if η = 0.1. This is about two orders of magnitude larger than the observed X-ray luminosity LX of 7 × 1040 erg s−1, suggesting that the current limit of mass accretion rate is sufficient to explain the observed X-ray luminosity. On the other hand, the X-ray luminosity is low compared to the maximum available nuclear power. If
  is not significantly lower than the upper limit obtained here, this will imply that the radiative efficiency is significantly lower than the canonical value of 0.1. In this case, both mass accretion rate and radiative efficiency are significantly suppressed which is consistent with the expected properties of RIAFs.
4.2. Alternative Interpretations?
Our upper limit on the RM is derived from a set of polarization P.A.s with still significant errors. Because of the large uncertainties, it is difficult to demonstrate that P.A.s follow the λ2 law, which is the basis of our fundamental assumption on the location of the Faraday screen (relative to the background source). As a result, we cannot completely rule out the scenario that internal Faraday rotation (i.e., Faraday screen intermixed with emitting plasma in the jet) plays an important role and the possibility that we are measuring an RM purely originating from cold electrons in the sheath of the jet, especially because the jet in M87 points to the observer nearly along the line of sight (i.e., <20°).
To assess the possibility of a jet-based RM, we adopt the Burn model (Burn 1966) of internal Faraday rotation and depolarization. By using the degree of linear polarization of the M87 core from the current study (1%) and that from the optical measurements (1%–13%; Perlman et al. 2011), we find that the maximum possible observed RM for the jet at 230 GHz is ∼6 × 10⁶ rad m−2, beyond our current upper limit. Therefore, a jet-originated RM could provide an explanation for our observed RM.
Nonetheless, in the context of our simplified one-dimensional model for spherically symmetric RIAFs, we still prefer the scenario that the Faraday rotating plasma (i.e., accreting gas) is external to the emission region because the dominant polarized emission quite likely comes from within a few rs from the BH (see Section 4.1). In this case, since all the non-relativistic electrons reside beyond ∼21rs from the BH, the Faraday screen must be external to the background source.
In essence, in order to constrain  more unambiguously with the method used in this Letter, it is important to establish the λ2 law of P.A. and obtain a more precise RM. This will rely on higher sensitivity observations with a significantly longer lever arm in the frequency space and higher angular resolution in the future.
The SMA is a joint project between the Smithsonian Astrophysical Observatory and the Academia Sinica Institute of Astronomy and Astrophysics. We wish to thank all the staff members at the SMA who made these observations possible.
Footnotes
- 4
We adopt 6.6 × 10⁹ M☉ for the black hole mass in this Letter.
- 5
 yr−1 is adopted here.
 - 6
The Submillimeter Array is a joint project between the Smithsonian Astrophysical Observatory and the Academia Sinica Institute of Astronomy and Astrophysics and is funded by the Smithsonian Institution and the Academia Sinica.
