


ABSTRACT
Two of the many features associated with nonlinear upstream structures are (1) the solar wind (SW) mean flow slows down and deviates substantially and (2) the temperature of the plasma increases in the structure. In this Letter, we show that the SW beam can be present throughout the entire upstream event maintaining a nearly constant beam velocity and temperature. The decrease of the velocity is due to the appearance of new particles moving in the opposite direction that act against the SW beam and reduce the mean velocity as computed via moments. The new population, which occupies a larger velocity space, also contributes to the second moment, increasing the temperature. The new particles include the reflected SW beam at the bow shock and another population of lower energies, accelerated nearby at the shock or at the boundary of the nonlinear structures.
Export citation and abstract BibTeX RIS
1. INTRODUCTION
The upstream region of Earth's bow shock contains dynamic plasma structures characterized by steep gradients, called nonlinear structures: hot flow anomalies (HFAs; Schwartz et al. 1985, 2000), also known as hot diamagnetic cavities (Thomsen et al. 1986), short large-amplitude magnetic structures (SLAMS; Schwartz et al. 1992), foreshock cavities (Sibeck et al. 2002) and density holes (DHs; Parks et al. 2006). These structures have many similar features but each has its own unique feature.
The nonlinear structures last from ∼10 s to several minutes and include depressed magnetic fields, depletion of density to levels below that of the solar wind (SW), scale sizes from 1 to 50 ion Larmor radii, and they are often accompanied by a fluctuating magnetic field. The temperature (T) and pressure (P) in the density-depleted region are higher than that of the SW, hence these structures can produce a compressed edge on the side facing the SW, resembling a shock (Fuselier et al. 1987; Lee et al. 2009). The mean plasma flows can deviate substantially, sometimes as many as 90° from the Sun–Earth line. Magnetic field (B) in these structures can change sign, indicating interplanetary current sheets may be involved (Schwartz et al. 1988; Parks et al. 2006).
An important feature observed with the upstream nonlinear structures is that the SW mean velocity is reduced and Vx (GSE coordinate) sometimes approaches ∼0. Vy and Vz, which are small in the SW, increase indicating the SW has diverted (Schwartz et al. 1988; Parks et al. 2006). Similar slowdown of the SW has been observed in the foreshock region (Cao et al. 2009; Zhang et al. 1995). The mean temperature T computed from the second moment also increases accompanying the decrease of Vx.
To investigate the details of the SW slowdown and the T increase, we have examined an upstream structure that has been identified as an HFA event by Lucek et al. (2004). We have also configured our plasma experiment on Cluster in 2010 and 2011 and obtained three-dimensional (3D) SW data every 4 s (spin period) so that the SW could be followed continuously in the nonlinear structures. This article will show that the SW beam can be present throughout the entire duration of the nonlinear structure, maintaining a steady beam velocity and constant temperature. These findings have clarified the causes of the velocity slowdown and T increases, important for understanding the nonlinear upstream structures.
2. OBSERVATIONS
The CIS experiment has two detector assemblies called HIA and CODIF (Réme et al. 2001). We use ion data from the HIA instrument for this study. HIA consists of 2 × 180° field-of-view sections with two geometrical factors, high (G) and low (g) that differ by a factor ∼20–30. Each section includes eight detectors 22 5 apart in the polar (θ) direction. As the spacecraft spins (4 s period), the g detectors track and measure the SW near the peak of the distribution with an angular resolution of 5625 (ϕ-direction) yielding a high resolution 3D SW distribution. The G detectors obtain 3D distributions over a few eV to ∼40 keV/charge with an angular resolution of 225 in θ-direction and 1125 in ϕ-direction. There are 14 modes of operation that can provide different number of energy steps and angular sectors to optimize measurements of the diverse plasma population surrounding the Earth's magnetosphere. For example, in the magnetospheric mode, only the G detectors are on. In the SW mode, the g detectors measure the SW while the G-detector bypasses the SW because SW fluxes can saturate it. When saturated, some ions are not detected and the density measurement becomes an underestimate.
2002 April 2 Event. Numerous upstream structures were observed on 2002 April 2 as the four Cluster spacecraft exited the bow shock at a distance of ∼13 RE (Lucek et al. 2004). Cluster was operating in burst mode and ion distributions were obtained every spin period by the G detectors.
Figure 1 shows an upstream nonlinear structure at ∼0336–0337 UT identified as an HFA event by Lucek et al. (2004). The intense beam (top panel) at ∼2.45 keV in the SW (after 0338 UT) is due to H+ and the fainter beam (yellow and green) above it at ∼5 keV is He++. The SW density (panel 2) was n ∼1.2 cc−1, mean velocity Vx = −720 km s−1 (panel 3), and total temperature (T) T ∼ 106 °K (panel 4). The upstream region was permeated with sunward going back streaming SW ions reflected from the bow shock (green and yellow particles above the SW energy). The three components of the magnetic (B) field and total intensity are shown on the bottom panel. To complement the B-field and four-spacecraft analysis of the HFA event in Lucek et al. (2004), we present below detailed behavior of the ions for this HFA event.
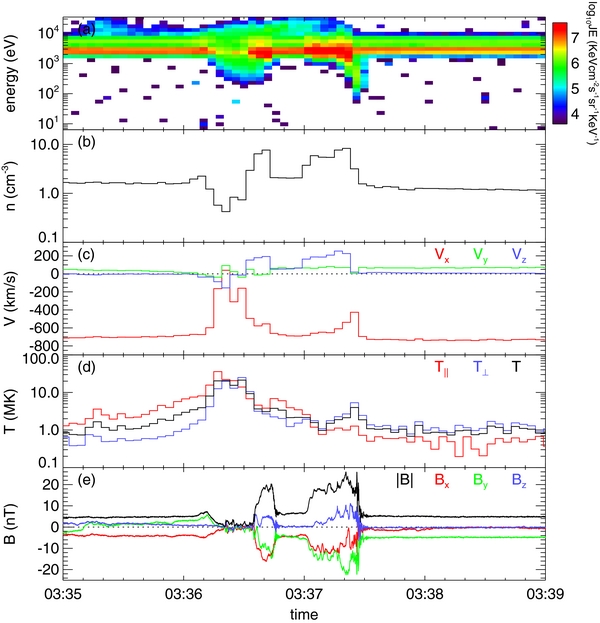
Figure 1. An example of HFA observed on 2002 April 2. Panel 1 ((a)) shows energy flux spectrogram of ions from ∼10 eV to 40 keV/charge, panels 2–4 ((b)–(d)) are the first three velocity moments of the distribution function: density n, mean velocity and components and temperature T. The subindices ∥ and ⊥ denote parallel and perpendicular directions relative to B. The ions are spin averaged (4 s) data from the G detectors of the HIA instrument on Cluster 1. The bottom panel ((e)) shows high time resolution (44 ms) data of the magnetic field and components (Balogh et al. 1997).
Download figure:
Standard image High-resolution imageThis HFA was detected upstream of the bow shock, which was crossed at ∼0339:18 UT (Lucek et al. 2004). There are two large peaks observed in both the density n (second panel) and magnetic field B (bottom panel) at ∼0336:40 UT and 0337:20 UT, another small peak at ∼0336:10 UT, and two density dips centered at 0336:20 UT and 0336:40 UT. The enhanced edge of the density n and B field observed at 0337:33 UT, where n increases from ∼1.4 cc−1 to ∼8.3 cc−1 and B from ∼5 nT to 22 nT, can be interpreted to result from the SW compressing against the HFA structure. This "overshoot" on the upstream side lasted until ∼0337:00 UT after which n decreased to ∼2 cc−1 and the magnetic field to ∼7 nT. The values in this region (0336:40–0337:10 UT) are slightly higher than the SW values, suggesting Cluster 1 (SC1) had not completely returned to SW proper.
The compression observed at ∼0336:40 UT increased the density n to a peak value of ∼7.5 cc−1 and B to ∼18 nT. The density and magnetic field then decreased to below the SW levels attaining a minimum n ∼ 0.4 cc−1 and B ∼ 1.5 nT (0336:25 UT). The density began to recover (∼0336:21 UT) and before SC1 returned to the SW (∼0336:00 UT), a small enhanced edge was encountered on the downstream side with n increasing to 2.5 cc−1 and B to 7 nT.
Coincident with the density depleted region (0336:00–0336:45 UT), Vx slowed down to ∼0 km s−1 and at minimum n, Vx even went slightly positive (one data point, 4 s). We also see that Vz, which was ∼0 in the SW, attained ∼200 km s−1 at the edges and Vy increased from ∼50 km s−1 to ∼75 km s−1. However, following the enhanced edge at 0337:29 UT, Vx did not decrease in the "low-density" region (0336:50–0337:10 UT). At the compressed edge, however, Vx did decrease from 725 km s−1 to ∼500 km s−1.
The temperature in the density depleted region was ∼3 × 10⁷ K (0336:00–0336:45 UT), which is much higher than the SW T ∼ 106 K. A temperature increase was not observed during the density dip region (0336:41–0337:33 UT) although a slight increase was observed at the compressed edge (0337:29 UT). The magnetic field By component switched sign in the density depleted region from positive to negative (0336:30 UT), but not during the interval 0336:50–0337:10 UT. A rotation of B-field is frequently seen in HFAs and DHs.
A feature not recognized previously is that the SW beam was present all of the HFA event as can be seen in the energy flux spectrogram, except for one data point in the density depleted region, ∼0336:21 UT. Another feature is the detection of ions with energies lower than the SW energy. The source of this population is not known and the particles may be accelerated at the shock or at the boundary of the HFA. These particles have different distributions from the back streaming SW population from the bow shock (not shown), which is usually present when upstream DHs and HFAs are observed.
The energy spectrogram suggests that the SW beam intensity decreases inside the density-depleted region. To further understand this feature, we have examined the spin resolution 3D distribution functions inside the density depleted region (0336:10–0336:38 UT). The plots in Figure 2 show two-dimensional (2D) cuts of the 3D distributions in Vx–Vy plane (GSE). The top row shows the distributions inside the density hole as n decreased during the trailing edge, and the bottom during the leading edge. The SW is the bright beam at Vx = −650 km s−1 (0336:10 UT) and it is always present. Note also the speed remained relatively constant.
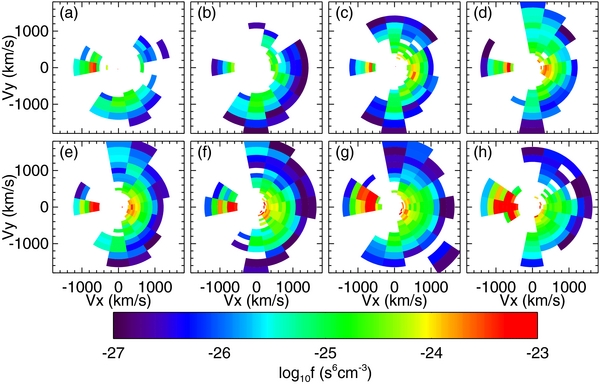
Figure 2. 2D cuts of 3D spin averaged (4 s) velocity space distributions of ions detected during the HFA event shown in Figure 1. The velocity scales are ±1800 km s−1 for both Vx and Vy (GSE). The start time of the four plots, from left to right, are 0336:10 UT, 0336:14 UT, 0336:18 UT, 0336:22 UT (top row), 0336:26 UT, 0336:30 UT, 0336:34 UT, 0336:38 UT (bottom row).
Download figure:
Standard image High-resolution imageThese plots show the SW beam intensity decreases steadily toward the minimum of the density depletion for this HFA event. At the same time, other particles that include the back streaming population are evolving and increasing, covering larger and larger region of the velocity space, while the width of the SW beam remained nearly the same, indicating T of the SW beam was not changing much. The increase of T in the density depleted region computed from the second moment thus comes not from the SW but the other population including the back streaming population that occupies a large velocity space.
Information from where the particles are coming can be further examined from the differential energy spectra of the ions obtained by the eight detectors that look from −90° to +90° in the θ-direction. The four plots in Figure 3 correspond to the same time interval of the velocity distributions of the top row of Figure 2 (the behavior of the bottom row is more complicated because of compression effects not shown). Each detector is 225 apart in the θ-direction and the data are averaged over all azimuth angles, ϕ-direction. The detectors that measure the SW beam are generally on the ecliptic plane (θ4 and θ5) looking toward the Sun.
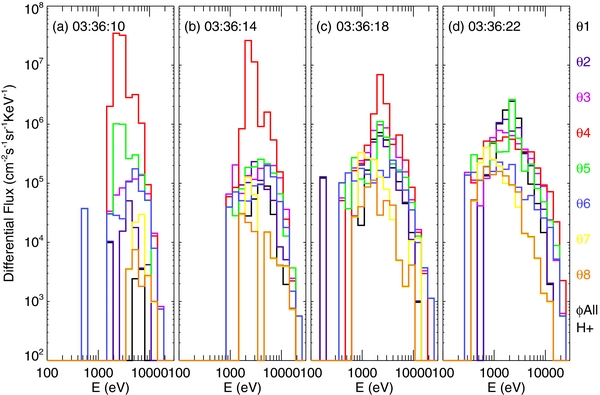
Figure 3. Differential energy spectra from eight detectors in the polar direction covering polar angles +90 to −90° at 225 apart. The unit of Y-axis is number flux (cm2-s-ster-keV)−1 and the X-axis is energy in eV. The times are start times.
Download figure:
Standard image High-resolution imageFluxes of the SW peak (red and green) steadily became lower inside the HFA corroborating the 2D velocity space plots. At the same time, we see that fluxes from other directions are increasing. In particular, note the substantial increase of particle flux away from the ecliptic plane. For example, we see fluxes of θ1 (black, θ = +90°) creeping up in intensity opposite of the SW beam. At 0336:22 UT, the fluxes in the θ1 detector have become nearly equal to the SW flux (θ5). These particles all contribute to the velocity and temperature moments. The mean velocity and Vx were reduced because the SW beam was counteracted by the particles traveling in the opposite direction. The temperature increased because of the back streaming particles, which occupied a large velocity space.
To further verify that the new particles are arriving from opposite of the SW direction, Figure 4 shows fluxes of ions as a function of θ and ϕ. As SC1 spins, the high voltage of each detector sweeps at a rate of 125 ms, and in one spin obtained distributions in 32 energy steps and 16 ϕ directions (for the mode operating at this time). The top plot of Figure 4 shows the SW at ϕ = ±180°, which is the direction of the detector pointing toward the Sun. The next plot shows the appearance of fluxes at ϕ = 0° which is opposite of the SW direction. The subsequent two plots show buildup of the fluxes at the same time as the SW intensity diminished.
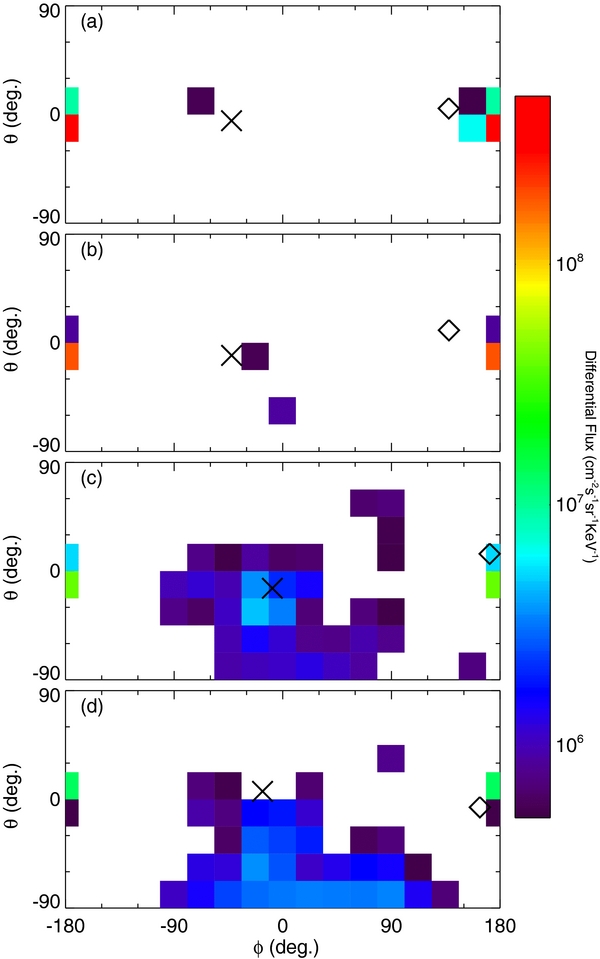
Figure 4. θ–ϕ plots of the four plots that correspond to the top row in Figure 3 for θ and ϕ panels that contain the SW beam. The direction of the magnetic field is marked by diamonds (out) and crosses (into). There are 8 bins on the Y-axis and 16 on the X-axis.
Download figure:
Standard image High-resolution image2010 May 27 Event. The HIA experiment on SC1 was put in special mode to sample the SW every spin period by the g-detector. The G-detector during this mode bypassed the SW and the detector operated only when looking in the anti-sunward direction measuring the back streaming particles.
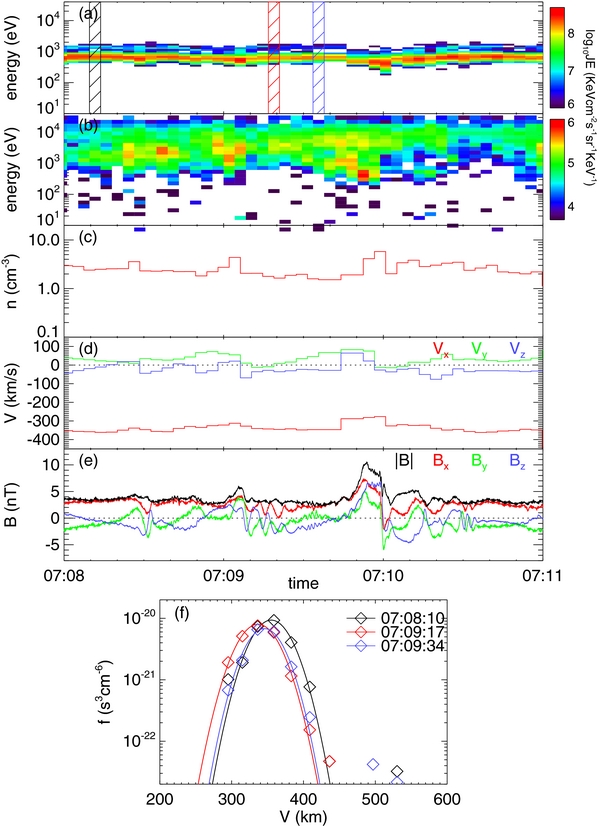
An upstream structure was observed between 0709 and 0710 UT (Figure 5) as can be seen in the two steepened edges in the magnetic field (Figure 5(e)). The peak B value of the leading edge was ∼11 nT and the trailing edge ∼5.5 nT. The steepened edges are generally larger closer to the bow shock and the smallness of these edges could be reflecting that this observation was made when SC1 was ∼21.3 RE from Earth. Note that By switched sign in the structure behaving similarly to observations made closer to the bow shock. The enhanced edges in density are also small but clearly observable with the peak value of ∼9.5 cc−1 for the leading edge and ∼4.1 cc−1 for the trailing edge (Figure 5(b)).
Figure 5. The top two panels ((a) and (b)) show energy flux spectrograms from the g and G detectors. The next two panels ((c) and (d)) show the density and velocity from the g-detector. The bottom panel shows the magnetic field and components, Bx (red), By (green), Bz (blue) and the magnitude (black). The upstream structure is seen between 0709 and 0710 UT with steepened edges. The inset below shows examples of one-dimensional (1D) distributions of the SW (0708:10 UT) and in the nonlinear structure (0709:20 and 0709:40 UT). The diamonds are measurements and the solid lines are Maxwellian fits to the data.
Download figure:
Standard image High-resolution image
The energy flux spectrogram from the g-detectors (Figure 5(a)) shows the SW beam was present throughout the entire time of this event. The mean velocity was ∼355 km s−1 that slowed down to ∼285 km s−1 at the leading edge and to ∼300 km s−1 at the trailing edge.
The inset at the bottom (Figure 5(f)) shows three examples of the SW distributions from the g-detectors, one taken outside, and two inside the event. The temperature of the SW at 0708:10 UT (black) is ∼5.7 eV. The temperature inside the structure is 6.1 eV at 0709:17 UT (red), 5.3 eV at 0709:34 UT (blue). These values show the SW temperature was nearly constant (estimated uncertainty of T, about ±0.6–0.8 eV).
3. SUMMARY AND CONCLUSION
This Letter has demonstrated that the apparent decrease of the SW mean velocity Vx observed in association with density depleted regions of upstream structures is not due to slowing down of the SW. Our results show the SW beam is always present and the beam velocity remains fairly constant. When the upstream structure is observed, other particles act against the SW beam and the overall effect is to reduce the mean velocity 〈v〉. Depending on the flux of the sunward and anti-sunward going particles, Vx can vanish or even become positive. A similar slowdown has been observed in simulations of SLAMS events (Dubouloz and Scholer 1993). The contribution of the sunward going particles also increases the velocity space volume the particles occupy and the second moment including these particles overestimates the temperature.
The intensity of SW beam on 2002 April 2 was observed to decrease inside the density depleted region. What causes this intensity decrease has not been determined but it could result from a portion of the SW beam being reflected or scattered at the steepened edges, creating a new particle population traveling toward the Sun. The new population can have energies less than the nominal SW energy, and different from the back streaming population from the bow shock whose energy appears above the SW energy. The behavior described here is characteristic of many upstream structures. However, departures are seen in more complex cases. For example, for the event that occurred ∼0340–0346 UT on 2002 April 2 (Lucek et al. 2004), the very intense back streaming population dominated the plasma population and the SW beam was not detected for much of the interval.
Preliminary analysis of electron data indicates presence of field-aligned beams and intense currents (2 × 10⁻⁶ Amp m−2) at both of the steepened edges on 2002 April 2 (not shown). Moreover, large amplitude electrostatic and electromagnetic waves permeate the density-depleted regions of HFAs (Lin et al. 2008). The source of these waves may be the counter streaming beams of the incoming SW and the back streaming ions at the overshoots but the precise mechanism remains unknown.
The relationships of HFAs, DHs, and SLAMS are not known. Future studies will consider how HFAs and other nonlinear structures, DHs and SLAMS, may be related. We have also started computer simulation to attempt to reproduce the nonlinear structures using our observational results as input.
The research was supported in part by a NASA grant to the University of California, Berkeley NNX11AD49G-2/14 and at Kyung Hee University by WCU program (Grant No. R31-10016) through NRF funded by MEST of Korea.