


ABSTRACT
We report the Herschel detections of hydrogen fluoride (HF) and para-water (p-H2O) in gas intercepting the sight lines to two well-studied molecular clouds in the vicinity of the Sgr A complex: G−0.02−0.07 (the "+50 km s−1 cloud") and G−0.13−0.08 (the "+20 km s−1 cloud"). Toward both sight lines, HF and water absorption components are detected over a wide range of velocities covering ∼250 km s−1. For all velocity components with VLSR > −85 km s−1, we find that the HF and water abundances are consistent with those measured toward other sight lines probing the Galactic disk gas. The velocity components with VLSR ⩽ −85 km s−1, which are known to trace gas residing within ∼200 pc of the Galactic center, however, exhibit water vapor abundances with respect to HF at least a factor three higher than those found in the Galactic disk gas. Comparison with CH data indicates that our observations are consistent with a picture where HF and a fraction of the H2O absorption arise in diffuse molecular clouds showing Galactic disk-like abundances while the bulk of the water absorption arises in warmer (T ⩾ 400 K) diffuse molecular gas for VLSR ⩽ −85 km s−1. This diffuse Interstellar Medium (ISM) phase has also been recently revealed through observations of CO, HF, H+3, and H3O+ absorption toward other sight lines probing the Galactic center inner region.
Export citation and abstract BibTeX RIS
1. INTRODUCTION
The detection of atomic (e.g., Genzel et al. 1990; Esteban et al. 2005; Lang et al. 2010) and molecular species within ∼200 pc around the Galactic center has revealed the coexistence of cold dense molecular clouds (e.g., Guesten et al. 1981), warm dense molecular clouds (e.g., Rodriguez-Fernandez et al. 2006), or cold diffuse clouds (e.g., Lang et al. 2010). Their distribution within the three major structures known to exist in this inner region—the circumnuclear disk (CND), the central molecular zone (CMZ), and the extended molecular ring (EMR)—remains subject to extensive studies and significant debate to date (e.g., Wright et al. 2001; Dwarakanath et al. 2004). H3+ detections toward discrete sight lines probing the CMZ (e.g., Oka et al. 2005, 2011) also revealed the presence of a warm diffuse phase unique to the Galactic center's inner region. Our H2O and HF observations combined with the results of Monje et al. (2011) toward Sgr B2 establish that this newly detected warm and very dilute phase seems pervasive around the Galactic center.
As part of the Guaranteed Time Key Program PRISMAS ("PRobing the Interstellar Medium with Absorption line Studies"; PI: M. Gerin), we observed two well-studied molecular clouds in the Sgr A complex: G−0.02−0.07 (the "+50 km s−1 cloud") and G−0.13−0.08 (the "+20 km s−1 cloud") with the Heterodyne Instrument for the Far-Infrared (HIFI) on Herschel (see Pilbratt et al. 2010). Toward both sight lines we see strong absorption from hydrogen fluoride (HF) and para-water (p-H2O), consisting of a series of gas components residing in the foreground of the Galactic center or gas components originating in the inner 200 pc region of Sgr A. This Letter focuses on the unusual conditions in the gas components arising within 200 pc of the Galactic center (e.g., Lang et al. 2010; Dwarakanath et al. 2004). The gas components arising in this foreground Galactic disk material will be discussed in a subsequent paper presenting HF and water detections toward the remaining PRISMAS targets W28, G34.1, and DR21(OH) (P. Sonnentrucker et al. 2013, in preparation). Section 2 describes the Herschel observations along with our data reduction procedures. Section 3 discusses our HF and p-H2O results. Finally, Section 4 offers an interpretation for the increased water vapor abundance within the CMZ relative to the Galactic disk using CH observations obtained with Herschel toward our sight lines.
2. OBSERVATIONS AND DATA ANALYSIS
We observed the ground-state rotational line of HF (νrest = 1232.476 GHz) in the upper sideband of HIFI band 5a receiver and the ground-state line of p-H2O (νrest = 1113.343 GHz) in the lower sideband of HIFI band 5a receiver using multiple Local Oscillator (LO) settings in order to securely identify the HF and p-H2O absorption lines toward G−0.02−0.07 and G−0.13−0.08. The proximity of the HF and p-H2O lines in frequency and their detection within the same receiver band ensure that the absorption lines are observed with a very similar beam size and that the data are calibrated in a similar fashion. We used the Dual Beam Switch (DBS) mode which, combined with the Wide Band Spectrometer (WBS), allows for a spectral resolution of about 1.1 MHz (0.3 km s−1 at the HF frequency). The DBS mode uses a reference OFF-beam position located 3' on either side of the source position along an east–west axis. Because the Galactic center is a very complex and crowded region, we checked for contamination in the OFF-beam position using Herschel observations performed by the HEXGAL project (R. Güsten & M. Requena-Torres 2012, private communication). There is no contamination at the OFF-beam position for HF; only minor contamination occurs for p-H2O in the velocity range [−40, +10] km s−1.
We processed the data to Level 2 with the standard HIFI pipeline in the Herschel Interactive Processing Environment (HIPE) version 7.3.0 (Ott 2010), thereby producing fully calibrated spectra for both polarization modes at each LO setting. We analyzed the Level 2 data in a fashion identical to that described in Sonnentrucker et al. (2010). Table 1 lists, for both sight lines, the target name, the coordinates of the center of the telescope beam, the total on-source exposure times, the double sideband continuum antenna temperatures, the observation dates, and the observation IDs for the multiple LO settings we obtained for HF and p-H2O.
Table 1. Summary of Observations
| Target | R.A.a | Decl.a | Texp(HF) | TA(cont)[HF] | Texp(H2O) | TA(cont)[H2O] | Obs. Dateb |
|---|---|---|---|---|---|---|---|
| (J2000.1) | (J2000.1) | (s) | (K) | (s) | (K) | ||
| G−0.02−0.07 | 17h45m50 200 200 |
−28d59m5300 |
3693 | 0.92 ± 0.05 | 2139 | 0.85 ± 0.05 | 2010 Oct 6 |
| G−0.13−0.08 | 17h45m37400 |
−29d05m4000 |
746 | 1.38 ± 0.10 | 428 | 1.47 ± 0.10 | 2011 Sep 14 |
Notes. aCoordinates of the center of the telescope beam. bThe Observation IDs for G−0.02−0.07 are 1342205882, 1342205883, 1342205884 (HF) and 1342205885, 1342205886, 1342205887 (p-H2O). The Observation IDs for G−0.13−0.08 are: 1342228613, 1342228614 (HF) and 1342228615, 1342228616 (p-H2O).
Download table as: ASCIITypeset image
HIFI employs double sideband receivers. Thus, for a sideband gain ratio equal to unity, the saturated absorption of radiation at a given frequency will reduce the measured antenna temperature (TA) to one-half the apparent continuum antenna temperature TA(cont). Our observations, however, indicate that the reduction in the measured antenna temperature for complete absorption of radiation at given frequencies is greater than one-half the continuum temperature by 5% for G−0.02−0.07 and by about 8% for G−0.13−0.08. We took these correction factors—which arise from a sideband gain ratio slightly different from unity—into account when normalizing the flux with respect to the continuum flux in a single sideband.
3. RESULTS
The left panels of Figure 1 display the normalized single-sideband line intensities versus VLSR for HF (black solid line) and p-H2O (green solid line) toward G−0.02−0.07 (top) and G−0.13−0.08 (bottom). The right panels of Figure 1 compare the optical depth profiles of HF (black) and p-H2O (green) derived from our spectra in the LSR velocity range we focus on in this study ([−200, −40] km s−1) for G−0.02−0.07 (top) and G−0.13−0.08 (bottom). The velocity distribution of both molecules follows the general gas kinematics derived from previous line studies toward the Galactic center. In particular, the components with −60 ⩽VLSR ⩽ +10 km s−1 arise predominantly in foreground clouds located in the 3 kpc Galactic Arm (e.g., Lang et al. 2010; Rodriguez-Fernandez et al. 2006). The gas components with −130 ⩽VLSR ⩽ −70 km s−1 arise in a CND with a projected radius of ∼17 pc surrounding Sgr A (e.g., Liszt et al. 1985; Oka et al. 2011) while the components with −200 ⩽VLSR ⩽ −70 km s−1 arise predominantly in the CMZ, a molecular region within 200 pc of Sgr A also engulfing the CND (e.g., Liszt et al. 1983; Sawada et al. 2004).
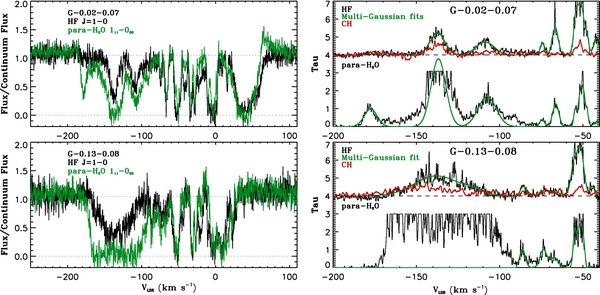
Figure 1. Left: Herschel/HIFI normalized spectra of HF (black solid line) and p-H2O (green solid line) toward G−0.02−0.07 (the "+50 km s−1 cloud," upper panel) and G−0.13−0.08 (the "+20 km s−1' cloud," lower panel) in the vicinity of Sgr A in the Galactic center. The dotted lines represent the continuum temperature, TA(cont) (K), normalized to unity and the zero flux level. Right: smoothed optical depth profiles of the HF and p-H2O absorption lines for G−0.02−0.07 (upper panel) and G−0.13−0.08 (lower panel). Their corresponding best multi-Gaussian fit models are overlaid in green in each panel. The CH optical depth profiles are shown in red for comparison. For clarity, the HF and CH profiles were shifted upward by 4 units relative to p-H2O. For both sight lines, the HF, CH, and H2O velocity distributions are very similar. However, for VLSR ⩽ −85 km s−1, the p-H2O optical depth profiles are generally larger than the HF optical depth profiles toward both sight lines.
Download figure:
Standard image High-resolution image
We see striking similarity in the velocity and optical depth distributions of HF and p-H2O for the components with −60 km s−1 ⩽ VLSR ⩽ −40 km s−1. Such similarities are observed now routinely toward other Galactic sight lines (W31C, Neufeld et al. 2010; W49N and W51, Sonnentrucker et al. 2010) and indicate that these particular gas components have abundances consistent with those in the Galactic disk whether they are mainly tracing gas in the foreground of the Galactic center or whether they also trace gas local to the Galactic center. While the velocity distributions of HF and p-H2O are also similar for VLSR ⩽ −85 km s−1, the optical depth profiles for p-H2O are, however, significantly deeper than the HF optical depth profiles toward both sight lines.
To derive the HF and total H2O column densities, we first used a set of multiple Gaussian components to fit the HF and p-H2O optical depth profiles over the LSR velocity range [−200, +15] km s−1 for the components that showed optically thin or moderately thick HF absorption. To be conservative, we set a lower limit to the optical depth of τ = 3; our observations are not sensitive to larger optical depths (see Figure 1, right panels). A χ2 minimization showed that 16 components best fitted the HF optical depth profiles toward both sight lines for the velocity range selected here. Increasing the number of HF components in the fit did not significantly improve the χ2 values. Given the overall velocity distribution similarities between HF and p-H2O, we used the sight line cloud decomposition obtained from the HF fitting (FWHM and velocity integration range) as initial parameters to fit the p-H2O optical depth distribution. Since the water absorption is significantly deeper than the HF absorption for VLSR ⩽ −85 km s−1, we fixed the FWHM of the p-H2O components to be those of HF and adopted the HF velocity integration ranges for the p-H2O gas components (see Table 2) toward G−0.02−0.07 and G−0.13−0.08.
Table 2. Column Densities and Abundances
| VLSR | N(HF) | N(p-H2O) | N(CH) | N(H2O)tota | N(HF) | N(H2O)tota |
|---|---|---|---|---|---|---|
| N(HF) | N(CH) | N(CH) | ||||
| (km s−1) | (1013 cm−2) | (1013 cm−2) | (1013 cm−2) | (10−2) | ||
| Results for G−0.02−0.07 | ||||||
| (−190, −170) | ⩽0.5 (3σ) | 2.1 ± 0.5 | 5.6 ± 1.4 | ⩾17 (3σ) | ⩽15 (3σ) | 1.5 ± 0.7 |
| (−150, −130) | 3.5 ± 0.7 | ⩾14 | 24 ± 6 | ⩾16 | 14 ± 5 | ⩾2.3 |
| (−120, −90) | 2.7 ± 0.6 | 5.0 ± 1.0 | 8.9 ± 2.6 | 7.5 ± 3.0 | 30 ± 10 | 2.3 ± 1.6 |
| (−80, −70) | 0.58 ± 0.17 | 0.36 ± 0.11 | 2.8 ± 0.7 | 2.6 ± 1.5 | 21 ± 9 | 0.5 ± 0.5 |
| (−55, −45) | 5.2 ± 1.6 | 3.1 ± 1.0 | 15 ± 5 | 2.4 ± 1.5 | 33 ± 16 | 0.8 ± 0.6 |
| Results for G−0.13−0.08 | ||||||
| (−180, −107) | 9.9 ± 1.7 | ⩾37 | 79 ± 16 | ⩾15 | 13 ± 5 | ⩾1.9 |
| (−90, −80) | 0.54 ± 0.15 | 0.97 ± 0.17 | 3.8 ± 0.9 | 7.3 ± 3.3 | 14 ± 7 | 1.0 ± 0.9 |
| (−80, −60) | 0.78 ± 0.12 | 0.82 ± 0.17 | 5.7 ± 1.3 | 4.2 ± 1.5 | 14 ± 7 | 0.6 ± 0.4 |
| (−55, −40) | 5.4 ± 1.1 | 3.8 ± 0.8 | 14 ± 4 | 2.9 ± 1.2 | 38 ± 17 | 0.8 ± 0.6 |
| Galactic Disk Mean | 1.5 ± 0.4b | 40 ± 10 c | 0.6 ± 0.3 | |||
Notes. aN(H2O)tot is the total column density of water assuming the Galactic disk ortho/para ratio of 3 (see Flagey et al. 2013). bDerived using absorptions detected toward W31C, W49N, and W51 (Sonnentrucker et al. 2010; Neufeld et al. 2010). cGalactic mean value derived from velocity components detected toward W49N and W51 (Sonnentrucker et al. 2010; Gerin et al. 2010).
Download table as: ASCIITypeset image
The best fit models to HF and p-H2O are overlaid as green lines on the optical depth profiles for both sight lines in Figure 1 (right panels). We derived the HF and p-H2O column densities for each velocity range listed in Table 2 following the method described in Neufeld et al. (2010). We assumed that the absorbing gas fully covers the continuum source and that each molecule is primarily in its ground state.
Table 2 lists, for each LSR velocity range considered here, N(HF), N(p-H2O), N(CH), N(H2O)tot/N(HF) assuming the Galactic disk ortho/para ratio of 3 for H2O (Flagey et al. 2013), N(HF)/N(CH), a proxy for the HF gas-phase abundance relative to hydrogen in diffuse clouds, and N(H2O)tot/N(CH). The errors are 2σ unless otherwise noted. The last row reports the mean Galactic disk values for N(H2O)tot/N(HF), for N(HF)/N(CH), and for N(H2O)tot/N(CH).
4. DISCUSSION
Our analysis shows that for −60 ⩽VLSR ⩽ −45 km s−1 the N(H2O)tot/N(HF) ratios are consistent with the mean Galactic disk diffuse ISM value of 1.5 ± 0.4 within 2σ. In contrast, the CMZ gas (VLSR ⩽ −85 km s−1) exhibits N(H2O)tot/N(HF) ratios at least a factor of five larger than in the mean Galactic disk.
Herschel observations have established that HF can be used to trace molecular hydrogen in diffuse molecular clouds (e.g., Neufeld et al. 2010; Sonnentrucker et al. 2010) where its depletion onto dust grains is at m ost a factor of two with respect to solar abundances (Snow et al. 2007; Neufeld & Wolfire, 2009; Guzmán et al. 2012) whereas HF depletes significantly in dense clouds (Neufeld et al. 2005; Phillips et al. 2010). Therefore, the higher-than-average N(H2O)tot/N(HF) ratio at LSR velocities probing the CMZ could be indicative of the presence of dense molecular clouds where the HF depletion is larger compared to H2O. The presence of dense (nH = 104 cm−3), cold (T = 30 K), and warm (T ⩾ 400 K) molecular clouds in the Galactic center is well established (e.g., Wilson et al. 1982; Rodriguez-Fernandez et al. 2006) and has been extensively studied since then.
Alternatively, the HF abundance in the CMZ-associated gas could be consistent with the average Galactic disk diffuse gas abundance. The higher-than-average N(H2O)tot/N(HF) would then indicate an enhanced H2O abundance by at least a factor of five in the CMZ. The H2O production could be enhanced compared to HF by endothermic reactions and reactions with energy barriers known to become efficient once T ⩾ 400 K (e.g., Bergin et al. 1998; Neufeld et al. 2002). A warm diffuse molecular phase has been recently detected in the CMZ through observations of H3O+ by Herschel (see D. Lis et al. 2013, in preparation) and observations of transitions out of the (J, K) = (1, 1), (2, 2), and (3, 3) states of H3+; the population ratios of the latter states are predicted to be very sensitive to the gas temperature and density (see Oka & Epp 2004) and were best reproduced toward the Galactic center with gas temperatures in the range 200–300 K and gas densities in the range nH = 50–200 cm−3 (e.g., Goto et al. 2008, 2011; Oka et al. 2005).
To investigate whether HF is severely depleted or whether H2O is enhanced in diffuse clouds traced by HF, we compared the HF column density distribution with that of another well-known tracer of diffuse clouds, CH. Previous observations have shown that in the diffuse cloud regime N(CH) ⩽∼few × 1014 cm−2, CH traces H2 linearly and CH does not exhibit significant depletion (e.g., Sheffer et al. 2008) contrary to the dense cloud regime (e.g., Mattila 1986). The ground-state doublet of the CH radical (νrest = 532 GHz and 536 GHz) was also observed toward our sight lines with HIFI as part of the PRISMAS program. These data show a one-to-one correspondence between the CH and HF velocity distributions for the velocity range discussed here (see red optical depth profile in the right panels of Figure 1). We thus fitted the CH optical depth profiles using the strategy applied to p-H2O, after deconvolution of the CH hyperfine structure from the sight line velocity structures and derived the column densities following Gerin et al. (2010; see for details).
The CH column densities in the gas components associated with the CMZ fall in the regime where CH traces the presence of diffuse molecular clouds for both sight lines. N(HF)/N(CH) is thus expected to be equal to the measured Galactic disk mean value for the latter components. However, we find that N(HF)/N(CH) is lower than the mean Galactic disk value by a factor ∼2 within our 2σ uncertainties. This difference can either reflect a decrease in N(HF) by factor of two resulting from mild HF depletion in these diffuse clouds, or it can reflect an increase in N(CH) by the same factor. CH enhancements have been measured in the Galactic diffuse ISM (Federman 1982 and references therein) and are thought to result from formation involving CH+ through warm gas-phase chemistry (e.g., Sheffer et al. 2008; Godard et al. 2009; Falgarone et al. 2010).
While our data do not allow us to lift the HF–CH degeneracy, our measurements certainly rule out the possibility that HF is severely depleted and traces the presence of dense clouds. Subsequently, we further conclude that the higher-than-average N(H2O)tot/N(HF) in the CMZ-associated gas results from an enhanced water abundance by at least a factor of three (if HF is mildly depleted) or at least a factor of five (if CH is enhanced) with respect to the Galactic disk. Flagey et al. (2013) recently measured an H2O Galactic disk abundance of 5 ×10⁻⁸ based on a study of foreground gas components observed toward all seven PRISMAS sources. They also established that the H2O ortho/para ratio is equal to 3 within errors in the Galactic disk. For the cloud components absorbing in the range [−55 to −40] km s−1 toward G−0.02−0.07 and G−0.13−0.08 we find H2O abundances similar to the Flagey et al. (2013) measurements, again indicating that these gas components mostly exhibit Galactic disk abundances whether they originate predominantly in the Galactic center region or in its foreground. For the velocity components consistent with CMZ-associated gas and showing enhanced water abundances, a lower limit to the water abundance is in the range (15–33) ×10−8.
The enhanced H2O (and potentially the CH) abundances could result from production in warm (shock or X-ray) heated diffuse molecular gas (e.g., Martín-Pintado et al. 2000) where endothermic reactions and reactions with energy barriers then become efficient (see Bergin et al. 1998 for OH and H2O; see Elitzur & Watson 1978 and Falgarone et al. 2010 for CH+ and CH). It could also be a consequence of the known increases in elemental abundances measured toward the Galactic center compared to the Galactic disk. Various studies have concluded that the Galactic center O/H ratio is typically higher by a factor of two compared to the disk gas (e.g., Cunha et al. 2007) and that the C/H ratio is higher by at least a factor of three compared to the disk (e.g., Esteban et al. 2005 and references therein). While the increase in the C elemental abundance toward the Galactic center could certainly reproduce the CH enhancement potentially measured here, the increased O elemental abundance does not fully account for the water enhancement we derived.
Godard et al. (2012) recently reported large abundance enhancements compared to the Galactic disk for CH+ and SH+ using HIFI observations over the entire negative velocity range probed by p-H2O toward G−0.02−0.07. CH+ and SH+ are known to trace energetic processes (whether shocks or turbulent dissipation) in the diffuse ISM as their formation routes are highly endothermic, thereby prohibiting their efficient formation under diffuse-cloud physical conditions. Hence, the Godard et al. (2012) results lead us to suggest that energetic processes are the most likely origin of the abundance enhancement for both water and CH toward G−0.13−0.08 and G−0.02−0.07. One possible origin of the shocks is the strong velocity perturbations induced by the Galactic bar (see Ferrière 2012). Our observations therefore seem to support a picture in which both Galactic-disk-like diffuse molecular clouds traced by HF and warm (T ⩾ 400 K) heated diffuse molecular clouds revealed by the enhanced water and CH abundances are present within the inner 200 pc region from the Galactic center, a picture previously proposed both via atomic and molecular absorption and emission line studies (e.g., Goto et al. 2008).
While HF and p-H2O arise from well-separated clouds toward G−0.02−0.07, their distribution is continuous toward G−0.13−0.08 suggesting that the gas phases traced by both molecules occupy a large filling factor over a velocity range covering the CMZ. This picture is further supported by the detection of HF (Monje et al. 2011) and p-H2O (Lis et al. 2010) in diffuse clouds toward the Sgr B2 complex. Monje et al. found that the HF abundance was consistent with our Galactic mean value. They also noted that N(H2O)tot/N(HF) = 13.8 toward Sgr B2 when using the Lis et al. (2010) p-H2O results in CMZ-associated gas. Hence, the Sgr B2 H2O enhancement noted by Monje et al. is identical, within uncertainties, to the enhancement we report here for the Sgr A sight lines. The projected distance between the Sgr A and Sgr B2 cloud complexes is about 100 pc assuming a distance to the Galactic center of 8.5 kpc. Hence, our results combined with the Monje et al. (2011) and Lis et al. (2010) results add weight to our suggestion that the diffuse medium traced by HF and p-H2O is pervasive toward the Galactic center. It would be interesting to obtain follow-up observations of additional shock, X-ray heating, and cosmic ray tracers over the velocity range observed here to further study the origin of the warm diffuse molecular gas in the vicinity of the Galactic center.
We wish to thank R. Güsten and M. Requena-Torres for extracting and sharing Herschel/HEXGAL data allowing us to determine that the OFF-beam position in our HIFI observations of p-H2O and HF does not suffer from contamination due to the presence of extended emission/absorption around the Galactic center. We wish to thank our referee whose comments improved our work significantly. HIFI has been designed and built by a consortium of institutes and university departments from across Europe, Canada, and the United States under the leadership of SRON Netherlands Institute for Space Research, Groningen, The Netherlands, and with major contributions from Germany, France, and USA. Consortium members are: Canada: CSA, U. Waterloo; France: CESR, LAB, LERMA, IRAM; Germany: KOSMA, MPIfR, MPS; Ireland, NUI Maynooth; Italy: ASI, IFSI-INAF, Osservatorio Astrofisico di Arcetri-INAF; Netherlands: SRON, TUD; Poland: CAMK, CBK; Spain: Observatorio Astronómico Nacional (IGN), Centro de Astrobiología (CSIC/INTA); Sweden: Chalmers University of Technology-MC2, RSS & GARD, Onsala Space Observatory, Swedish National Space Board, Stockholm University-Stockholm Observatory; Switzerland: ETH Zurich, FHNW; USA: Caltech, JPL, NHSC. M.S. acknowledges support from grant N 203 393334 from Polish MNiSW. Support for this work was provided to M. De Luca and M. Gerin by the Centre National de Recherche Spatiale (CNES) and by the SCHISM project (grant ANR-09-BLAN-0231-01). J.R.G. is supported by a Ramón y Cajal research contract and thanks the Spanish MINECO for funding support through grants AYA2009-07304 and CSD2009-00038. Support for this work was provided by NASA through an award issued by JPL/Caltech.
Facility: Herschel - European Space Agency's Herschel space observatory