


ABSTRACT
We report on the first detection of the noble gases krypton (Z = 36) and xenon (54) in a white dwarf. About 20 Kr vi– vii and Xe vi– vii lines were discovered in the ultraviolet spectrum of the hot DO-type white dwarf RE 0503−289. The observations, performed with the Far Ultraviolet Spectroscopic Explorer, also reveal highly ionized photospheric lines from other trans-iron group elements, namely Ga (31), Ge (32), As (33), Se (34), Mo (42), Sn (50), Te (52), and I (53), from which gallium and molybdenum are new discoveries in white dwarfs, too. For Kr and Xe, we performed an NLTE analysis and derived mass fractions of log Kr = −4.3 ± 0.5 and log Xe = −4.2 ± 0.6, corresponding to an enrichment by factors of 450 and 3800, respectively, relative to the Sun. The origin of the large overabundances is unclear. We discuss the roles of neutron-capture nucleosynthesis in the precursor star and radiation-driven diffusion. It is possible that diffusion is insignificant and that the observed metal abundances constrain the evolutionary history of the star. Its hydrogen deficiency may be the consequence of a late helium-shell flash or a binary white dwarf merger.
Export citation and abstract BibTeX RIS
1. INTRODUCTION
The spectroscopic detection of krypton and xenon in the universe is difficult because of their low cosmic abundance. In particular, they are not detectable in the Sun. The solar abundance values (log[N(Kr)/N(H)] =−8.72 ± 0.08, log[N(Xe)/N(H)] =−9.65 ± 0.02; corresponding to mass fractions log Kr = −6.96 and log Xe = −7.78; Lodders 2003) are based on meteoritic and solar wind isotope abundances as well as theoretical considerations of neutron-capture element systematics.
The krypton abundance in the interstellar medium (ISM) was determined by the analysis of Kr i λ1236 Å line measurements. The derived value is 50% of the solar abundance (Cartledge et al. 2008) and this offset is not understood. The xenon abundance in the ISM is unknown.
Krypton and xenon were detected in planetary nebulae (PNe). The first analysis (Péquignot & Baluteau 1994) of forbidden optical lines of Kr iii– v and Xe iii– iv arrived at about 20 times solar abundances. That is interpreted as a consequence of s-process nucleosynthesis and dredge up in the PN progenitor stars.
The proof of krypton and xenon in stellar atmospheres was only successful in chemically peculiar stars. Kr ii and Xe ii lines were discovered long ago (Bidelman 1962). Extreme overabundances, particularly for Xe (up to 5 dex), were found in Hg–Mn stars (Dworetsky et al. 2008), being the consequence of radiative-driven diffusion.
Lines of highly ionized trans-iron group elements were discovered in hot subdwarfs (Teff =22, 000–40, 000 K) and white dwarfs (WDs, Teff = 49, 000–58, 000 K) by UV spectroscopy. Ga, Ge, Sn, and Pb were identified in sdB and sdOB stars with enrichments up to 3 dex (O'Toole 2004; O'Toole & Heber 2007). Vennes et al. (2005) found Ge in three H-atmosphere WDs (spectral type DA). The average abundance is nearly solar. Chayer et al. (2005) detected Ge, As, Se, Sn, Te, and I in two He-atmosphere WDs (spectral type DO) namely HZ 21 (Teff = 53,000 K; Dreizler & Werner 1996) and HD 149499B (Teff = 49,000 K; Napiwotzki et al. 1995). The abundances range between 3 and 1000 times solar. It is unclear, to what extent this enrichment is the result of nucleosynthesis during the asymptotic giant branch (AGB) phase and/or the consequence of diffusion processes.
RE 0503−289 is a hot DO-type WD (Teff = 70,000 K; Dreizler & Werner 1996). Spectra taken by the Far Ultraviolet Spectroscopic Explorer (FUSE) are extraordinarily rich in unidentified absorption lines that are not observed in any other WD. Considering the trans-iron group detections in the cooler subdwarfs and WDs, we may expect that many of the unidentified lines in RE 0503−289 also stem from these species, possibly being in higher ionization stages. Here we report on the discovery of Kr, Xe, and other trans-iron group elements and perform Kr and Xe abundance analyses.
2. OBSERVATIONS AND LINE IDENTIFICATIONS
We have combined FUSE spectra from three separate observations (M1123601, M1124201, P2041601), using procedures similar to those described in Werner et al. (2004), but with CalFUSE v3.2.3. The reductions of the two M112 observations were limited to time periods when the star was in the slit, and to orbital night; the net exposure time varied from 15 ks to 16 ks, depending on instrument channel. For comparison with models, the spectrum was shifted to the photospheric rest frame. We are interested here neither in the light metals that we detected in the FUSE spectrum of RE 0503−289 (C, N, O, Si, P, S) nor in Fe and Ni in Hubble Space Telescope observations investigated by Dreizler (1999) and Barstow et al. (2000). We focus on trans-iron group elements.
2.1. Krypton and Xenon
Krypton (Z = 36). Within the FUSE wavelength band, 15 lines of Kr vi are listed in the NIST3 database. Eleven of them are detectable in RE 0503−289 (Table 1, Figure 1). Three are too weak (λλ919.9, 956.6, 1011.1 Å) and another one (λ918.1 Å) is masked by a strong interstellar H i line.

Figure 1. Top: Kr vi lines and a single Kr vii line (lower right profile) in RE 0503−289. Overplotted are computed profiles. Bottom: Xe vi and two Xe vii lines (two lowest profiles). The model atmosphere parameters are Teff = 70,000 K, log g = 7.5, log Kr = log Xe = −4.2 (mass fractions).
Download figure:
Standard image High-resolution imageTable 1. Utilized Spectral Lines of Kr and Xe
| Ion | λ | log gf | Ei | Ek | Configurations | Terms | gi | gk | Identification |
|---|---|---|---|---|---|---|---|---|---|
| (Å) | (cm−1) | (cm−1) | in RE 0503−289 | ||||||
| Kr vi | 919.93 | −1.966 | 170084 | 278787 | 4s4p2 − 4p3 | 2S − 4So | 2 | 4 | − (too weak) |
| 927.34 | −2.420 | 0 | 107836 | 4s24p − 4s4p2 | 2Po − 4P | 2 | 2 | + | |
| 931.39 | −2.005 | 8110 | 115479 | 4s24p − 4s4p2 | 2Po − 4P | 4 | 6 | + | |
| 944.05 | −0.959 | 170084 | 276011 | 4s4p2 − 4p3 | 2S − 2Do | 2 | 4 | + | |
| 956.61 | −0.974 | 222122 | 326657 | 4s24d − 4s25p | 2D − 2Po | 4 | 4 | − (too weak) | |
| 965.09 | −0.019 | 223040 | 326657 | 4s24d − 4s25p | 2D − 2Po | 6 | 4 | + | |
| 970.09 | −2.731 | 8110 | 111193 | 4s24p − 4s4p2 | 2Po − 4P | 4 | 4 | + | |
| 980.41 | −0.278 | 222122 | 324120 | 4s24d − 4s25p | 2D − 2Po | 4 | 2 | + | |
| 1002.75 | −2.746 | 8110 | 107836 | 4s24p − 4s4p2 | 2Po − 4P | 4 | 2 | + | |
| 1011.14 | −1.826 | 275380 | 374279 | 4s25s − 4s4p4d | 2S − 2Po | 2 | 4 | − (too weak) | |
| 1015.77 | −1.580 | 180339 | 278787 | 4s4p2 − 4p3 | 2P − 4So | 2 | 4 | + | |
| 1045.23 | −0.823 | 180339 | 276011 | 4s4p2 − 4p3 | 2P − 2Do | 2 | 4 | + (blend with O iv) | |
| 1052.95 | −1.561 | 183817 | 278787 | 4s4p2 − 4p3 | 2P − 4So | 4 | 6 | + | |
| 1061.07 | −0.409 | 183817 | 278062 | 4s4p2 − 4p3 | 2P − 2Do | 4 | 4 | + | |
| Kr vii | 918.44 | −0.134 | 170835 | 279715 | 4s4p − 4p2 | 1Po − 1D | 3 | 5 | + |
| Xe vi | 928.37 | −2.066 | 124870 | 232585 | 5s5p2 − 5p3 | 2D − 4So | 4 | 4 | + |
| 967.55 | −1.197 | 129230 | 232585 | 5s5p2 − 5p3 | 2D − 4So | 6 | 4 | + | |
| 996.23 | *−3.946 | 0 | 100378 | 5s25p − 5s5p2 | 2Po − 4P | 2 | 4 | − (too weak) | |
| 1080.08 | *−2.420 | 0 | 92586 | 5s25p − 5s5p2 | 2Po − 4P | 2 | 2 | + | |
| 1091.63 | *−2.005 | 15599 | 107205 | 5s25p − 5s5p2 | 2Po − 4P | 4 | 6 | + | |
| 1101.95 | −2.424 | 141837 | 232585 | 5s5p2 − 5p3 | 2P − 4So | 2 | 4 | + (blend with ?) | |
| 1136.41 | +0.060 | 182308 | 270306 | 5s25d − 5s26p | 2D − 2Po | 6 | 4 | + | |
| 1179.54 | *−2.731 | 15599 | 100378 | 5s25p − 5s5p2 | 2Po − 4P | 4 | 4 | + | |
| 1181.46 | −0.210 | 180250 | 264891 | 5s25d − 5s26p | 2D − 2Po | 4 | 2 | + | |
| Xe vii | 995.51 | −1.496 | 0 | 100451 | 5s2 − 5s5p | 1S − 3Po | 1 | 3 | + |
| 1077.12 | −0.555 | 143259 | 236100 | 5s5p − 5p2 | 1Po − 1D | 3 | 5 | + |
Notes. The last column denotes the (non-) identification in RE 0503−289. * indicates Xe vi gf values that were adopted from the respective Kr vi lines.
Download table as: ASCIITypeset image
There is no clear evidence for Kr v lines. According to NIST, the two lines with highest relative intensity are located at λλ965.09, 1002.74 Å, and they fall almost exactly onto Kr vi lines at λλ965.093, 1002.746 Å. One may wonder whether this is a chance coincidence or a misidentification in the laboratory spectra. At any rate, a possible contribution of the Kr v to the Kr vi lines is probably small. The Kr vii line with the highest NIST intensity, λ918.44 Å, is detected (Figure 1). Grotrian diagrams of Kr vi and Xe vi are shown in Figure 2.

Figure 2. Grotrian diagrams of Kr vi and Xe vi model ions. Dark and light gray graphs: radiative transitions with known and unknown f values, respectively. Red graphs with wavelengths: spectral lines in the FUSE wavelength range (f values known).
Download figure:
Standard image High-resolution imageXenon (54). Several of the Xe vi lines listed in NIST are identified (Table 1, Figure 1). The two Xe vii lines with the highest relative intensity (NIST) are prominent: the resonance line λ995.51 Å and λ1077.12 Å.
2.2. Other Trans-iron Group Elements
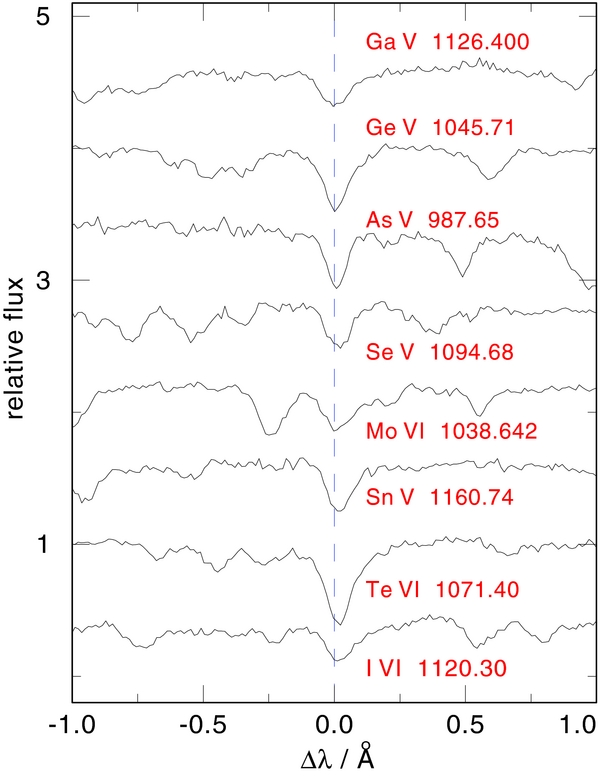
A quantitative analysis aiming at the abundance determination of the trans-iron group elements whose discovery is reported in this section requires laborious model atom construction and is beyond the scope of this Letter. Also, exhaustive line identifications must be deferred until spectrum synthesis calculations are performed. A few examples of the identified lines are shown in Figure 3.
Figure 3. Examples of lines from a further eight trans-iron group elements identified in RE 0503−289.
Download figure:
Standard image High-resolution image
Gallium (31). More than a dozen of the Ga v lines from Kelly's (1987) line list4 are detected. This element was not detected before in a WD.
Germanium (32). It is remarkable that all but one of the 23 Ge v lines listed in NIST are present, plus five additional ones listed by Kelly (1987). Ge in that high ionization stage was never previously observed.
Arsenic (33). All four of the As v lines discovered by Chayer et al. (2005; see references for wavelength data therein) in HD 149499B are also present in RE 0503−289: λλ987.65, 1029.48, 1051.6, 1056.7 Å. We do not confirm the tentative identification of As iv λ999.3 Å in RE 0503−289 by Boyce et al. (2008).
Selenium (34). Se v λλ1094.68, 1151.0 Å are detected as well as Se iv λλ959.59, 996.71 Å (Chayer et al. 2005 wavelengths). Four lines of Se vi with wavelengths from Joshi & van Kleef (1978) are seen, too: λλ1056.98, 1064.62 (blend with P iv), 1080.69, 1153.48 Å.
Molybdenum (42). NIST lists 10 Mo vi lines in the FUSE range. We detect the four lines with the highest relative intensity: λλ995.811, 1038.642, 1047.184, 1182.143 Å. Three of these have the largest gf values. This element was not detected before in a WD.
Tin (50). Sn v λλ1089.35, 1132.79, 1160.74 Å (NIST) are detected, as well as Sn iv λλ1019.72 (blend with Ga v λ1019.71), and 1044.49 Å (Chayer et al. 2005).
Tellurium (52). The Te vi λλ951.02, 1071.40 Å lines (wavelengths from Morton 2000) are rather prominent.
Iodine (53). We identify I vi λ1120.301 Å (wavelength from Morton 2000).
3. KRYPTON AND XENON ABUNDANCE ANALYSIS
We computed NLTE model atmospheres (in hydrostatic and radiative equilibrium) with our TMAP code (Werner et al. 2003). They are composed of He, C, N, O, Kr, and Xe, the latter two with various abundances. According to Dreizler (1999), we set to C = −1.7, N = −4.3, O = −2.7 (logarithm of mass fractions). Teff = 70,000 K and log g = 7.5 were adopted from Dreizler & Werner (1996). The model atoms used for this analysis were developed in the framework of the German Astrophysical Virtual Observatory5 project and are provided within the Tübingen Model-Atom Database (TMAD6).
The Kr vi model ion was constructed using NIST level energies that were compiled from Pagan et al. (1995) and references therein. Oscillator strengths f were taken from Pagan et al. (1996). Their list, however, is not complete which poses a serious problem for the NLTE calculations. f values are unknown for 895 of the 1035 included line transitions. They were set to 10−4 within in a spin system and to 10−6 otherwise. It was found, however, that the resulting UV line profiles do not change when we completely omit them. In order to estimate the possible error of this procedure, we performed a test calculation in which the electron collisional rates were increased to very large values, such that LTE populations for all levels are enforced. As a result, the effect on the analyzed Kr lines is rather weak and the corresponding uncertainty in the abundance determination is well within the error estimated below. f values for the lines in the FUSE range are listed in Table 1. For Kr vii λ918.44 Å, we adopted the value of Victor & Taylor (1983).
Photoionization rates were computed with hydrogen-like cross-sections. Electron collisional excitation and ionization rates were evaluated with usual approximation formulae following van Regemorter (1962) and Seaton (1962), respectively. For a proper ionization-balance computation, additional small models for neighboring ionization stages were constructed in order to complete the Kr model atom. In total, Kr iii– viii are represented by 1, 38, 25, 46, 14, 1 NLTE level(s), respectively.
The Xe vi model ion was constructed in a similar way, with level energies from Biémont et al. (2005). f values were mainly taken from that source, too, and from Reyna Almandos et al. (2001). In total, f values are unknown for 389 of the 887 included line transitions. NIST lists 16 lines in the FUSE range. For the line fit, we omit three weak ones that are blended by other strong lines, and another three because their NIST upper levels cannot be identified unambiguously with levels in Biémont et al. (2005). The remaining 11 lines used for our analysis are listed in Table 1. Their f values, if not available from Biémont et al. (2005), are taken from Reyna Almandos et al. (2001) or adopted from the respective Kr vi transitions. The f values for the two observed Xe vii lines are from Kernahan et al. (1980) and Biémont et al. (2007). In total, our Xe iii– viii model ions are represented by 1, 44, 29, 82, 36, 1 NLTE level(s), respectively. As for Kr, we performed an LTE calculation and found a similar effect on the spectral lines.
The best line fits are achieved with log Kr =−4.3 ± 0.5 and log Xe =−4.2 ± 0.6 (mass fractions), i.e., 2.7 and 3.6 dex oversolar, respectively. It is obvious from Figure 1 that the quality of the line fits is rather diverse, some lines are reproduced too strong, others are too weak. Our error estimates are dominated by the corresponding uncertainties for the abundance determinations. In particular, the computed Xe vii lines come out too strong compared to the Xe vi lines. This could not be improved by reducing the temperature to Teff = 65,000 K.
4. SUMMARY AND CONCLUSIONS
We identified 10 trans-iron group elements in the hot DO RE 0503−289. Among them, Kr, Xe, Ga, and Mo were never previously detected in WDs. For Kr and Xe, we found extreme overabundances. Anticipating the results of future analyses, it is clear from the spectral appearance that the other trans-iron group species are strongly overabundant too. Taken together with the two cool DO WDs for which Chayer et al. (2005) have reported similar results, the Teff range in which this phenomenon occurs is now found to be 49,000–70,000 K. Chayer et al. (2005) discussed that these overabundances might be ascribed to diffusion processes and to s-process nucleosynthesis in the AGB phase of the previous evolution. They also pointed out that this phenomenon is obviously restricted to DO WDs. This can be understood when considering that their immediate progenitors, the PG1159 stars, also show signs of n-capture nucleosynthesis in the light-metal abundance patterns (Werner & Herwig 2006). PG1159 stars expose their heavy-element enriched He envelopes which could serve as a reservoir from which high trans-iron element abundances can build up in the atmosphere by diffusion in the subsequent DO stage of evolution.
Chayer et al. (2005) found differences in the metal abundance patterns of their two cool DOs that are difficult to understand. Considering the similar values of Teff and log g, diffusion should result in similar abundances unless differences in the pre-WD evolution had occurred.
Indeed there is evidence that at least two evolutionary channels produce DO WDs. The majority is going through the H-deficient PG1159 phase with high amounts of C and O in their He-dominated atmospheres, caused by a late He-shell flash. There is a small number of so-called O(He) stars and related objects with similar atmospheric parameters but almost pure He-atmospheres (Rauch et al. 1998; Wassermann et al. 2010; Reindl 2012). We speculated that they originate from the RCrB stars, which themselves are possibly the product of a double WD merger (Saio & Jeffery 2002). According to Unglaub & Bues (2000), RE 0503−289 is still evolving toward the wind limit that must be crossed before diffusion overcomes radiation-driven mass loss. If this is true, then the surface abundances of RE 0503−289 are the outcome of a merger process with subsequent He-shell burning and n-capture nucleosynthesis. In this sense, RE 0503−289 might become an important validation check for yet-to-be-established evolution models. The observed abundance pattern could uncover details in the mixing and burning processes after the merger event. From AGB star models we know that trans-iron elements can be enriched in the H–He-intershell region by ≈2–3 dex (Karakas et al. 2007; R. Gallino 2005, private communication).
On the other hand, Unglaub & Bues (2000) consider the possibility that RE 0503−289 is the descendant of a PG1159 star that is a transition object passing through the wind limit, because the observed C abundance (≈1%) is too small for a PG1159 star but too high to be explained by radiative diffusion. Any modeling attempt to explain the observed abundances of light and heavy metals would then have to account for both processes—mass loss and diffusion—in a manner that hitherto was only performed by Unglaub & Bues (2000). In principle, radiative levitation can cause oversolar abundances as has been shown for metals as heavy as iron by Chayer et al. (1995).
We thank Emile Biémont and Pascal Quinet for providing Xe vi atomic data in electronic form. T.R. is supported by DLR grant 05 OR 0806 and E.R. by DFG grant WE1312/41-1.
Facility: FUSE - Far Ultraviolet Spectroscopic Explorer satellite
Footnotes
- 3
- 4
- 5
- 6