
Abstract
Alzheimer's disease (AD) is a neurodegenerative disease, characterized by the presence of extracellular deposits (plaques) of amyloid-beta peptide and intracellular aggregates of phosphorylated tau. In general, these hallmarks are studied by techniques requiring chemical pre-treatment and indirect labeling. Imaging techniques that require no labeling and could be performed on tissue in its native form could contribute to a better understanding of the disease. In this article a combination of label-free and non-invasive techniques is presented to study the biomolecular composition of AD human brain tissue. We build on previous research that already revealed the autofluorescence property of plaque, and the presence of carotenoids in cored plaques. Here, we present further results on cored plaques: showing blue and green autofluorescence emission coming from the same plaque location. Raman microscopy was used to confirm the presence of carotenoids in the plaque areas, with clear peaks around 1150 and 1514 cm−1. Carotenoid reference spectra were recorded in hexane solution, but also adsorbed on aggregated Aβ42 peptides; the latter agreed better with the Raman spectra observed in plaques. From the six single carotenoids measured, lycopene matched closest with the peak positions observed in the cored plaques. Lastly, stimulated Raman scattering (SRS) microscopy measurements were performed, targeting the shift of the beta-sheet Amide I peak observed in plaques. Employing SRS in the C–H stretch region we also looked for the presence of a lipid halo around plaque, as reported in the literature for transgenic AD mice, but such a halo was not observed in these human AD brain samples.
Export citation and abstract BibTeX RIS

Original content from this work may be used under the terms of the Creative Commons Attribution 4.0 license. Any further distribution of this work must maintain attribution to the author(s) and the title of the work, journal citation and DOI.
1. Introduction
In Alzheimer's disease (AD), neurons in the brain are being damaged or destroyed, resulting in a decrease in cognitive functioning [1]. AD makes up 60%–70% of all cases of dementia, making it the most common cause of dementia [2]. Furthermore, predictions are that the prevalence will continue to increase worldwide [3, 4]; in 2050 it is estimated that 1 in 85 persons will be suffering from AD [3]. An important characteristic of patients with AD is the presence of the proteins amyloid-beta and tau in the brain [5, 6], of which the former is found extracellular and the latter is found intracellular [6]. Amyloid-beta is processed from the amyloid precursor protein (APP). Cleavage of APP by two enzymes, beta-secretase and gamma-secretase, results in an amyloid-beta fragment which is secreted by the cell in the extracellular space. There it accumulates and forms the amyloid plaque [6]. The peptides adopt a β-sheet conformation, which makes them poorly soluble and neurotoxic [7]. In addition, amyloid plaques induce an immune response generating inflammatory molecules and cytokines [8] that contribute to the process of neurodegeneration [1]. As the disease progresses, more plaques occur and spread across the brain, starting in the neocortex [9]. In our recently published article [10], we showed analyses of snap-frozen human AD brain tissue with multiple label-free and non-invasive techniques. These techniques included autofluorescence microscopy, Raman microscopy and stimulated Raman scattering (SRS) microscopy. Among the different phenotypes of plaques, which can be characterized as cored or fibrillar, both showed green fluorescence when using blue excitation. Subsequently, Raman microscopy measurements were performed on those plaque locations, using a 532 nm excitation laser. Different spectra were found for AD cases and the healthy control cases, with the main difference that the spectra of cored plaque areas of AD cases showed additional Raman peaks at wavenumbers characteristic of carotenoids. Reference spectra of two carotenoid compounds, beta-carotene and lutein in hexane solution, showed Raman bands quite close to (but not matching exactly) the spectra observed in plaques. These carotenoids may have played a role as antioxidants fighting inflammation, but that needs to be further investigated. Furthermore, shifts in the wavenumber of the Amide I peak were found, indicating a different protein conformation. To confirm this change in vibrational frequency, this protein peak shift was studied with SRS too. In summary, autofluorescence, Raman, and SRS microscopy, when applied to the same tissue section, can be combined to differentiate between human AD tissue and healthy tissue by measuring their biomolecular composition directly in its native, unlabeled state. Furthermore, they could potentially be used in-vivo, for example, by imaging the retina in a search for biomarkers. This could lead to a method capable of diagnosing at an early stage of the disease.
In this article, we confirm the previously obtained results and extend the study with new results by performing a range of additional measurements:
- This includes identifying which carotenoid(s) can be present in plaque by measuring Raman spectra of six single carotenoids in different micro-environments (dissolved in hexane vs. adsorbed on Aβ42 aggregates) and additionally determining whether the carotenoids could be responsible for the green fluorescence observed.
- Furthermore, in contrast to the blue excitation used in the mentioned study, a different study conducted by Thal et al [11] used UV light instead of blue light for excitation, leading to blue light being emitted by the plaque. However, in none of the studies both excitation wavelengths have been used, and therefore a comparison between the observed green and blue fluorescence was not possible. We therefore investigate, by using both UV and blue excitation, whether the blue and green fluorescence occur at the same location or whether there are differences in the fluorescence areas, indicating the presence of two fluorescent compounds at different locations in the plaque.
- Subsequently, at the plaque location, Raman spectra are recorded with specific attention to the peak position of the Amide I protein band. Also, SRS measurements are performed to examine the β-sheet peak in more detail.
- Furthermore, recent publications from various research groups have shown that a lipid ring or halo is formed around an amyloid-beta deposit in transgenic mice [12–14]. The lipid halo was detected either with spontaneous Raman or SRS. Therefore, beside SRS measurements performed in the fingerprint region, the study is extended by performing measurements in the C–H stretch region to investigate whether a lipid halo is also present around a plaque in human AD brain tissue.
2. Materials and methods
2.1. Brain tissue and preparation
The post-mortem human AD brain tissue was provided by the Netherlands Brain Bank (NBB, Netherlands Institute for Neuroscience, Amsterdam). The research was conducted in accordance with the principles embodied in the Declaration of Helsinki. The brain donor program of the NBB was approved by the local medical ethics committee of the Vrije Universiteit Medical Center (Ref#2009/148). The collected brain tissue was from donors with written informed consent for brain autopsy and the use for clinical information and research purposes. As described previously [10], the neuropathological diagnosis was based on histochemical staining, while AD diagnosis was based on Braak stages [15], Thal phases [9] and the CERAD criteria [16].
The snap-frozen brain samples were cut in 20 µm sections and mounted on CaF2 microscope slides without the use of a cover slip. In this report, we focus on dense cored plaques as they show the clearest differences with the surrounding tissue in terms of Amide I shift and carotenoid levels. The cored plaques usually have a size of 10–20 µm. In total, we measured six different cored plaques from three different donors. However, here we only show two examples, for brevity called 'case I' and 'case II'. Information about these two cases can be found in table 1. Additional information and spectra from the other four plaques can be found in the supplementary information (available online at stacks.iop.org/JOpt/24/054005/mmedia).
2.2. Chemicals, amyloid-beta and carotenoids
Aβ42 (amyloid β-protein (1-42)) was purchased from Bachem (Basel, Switzerland); a 1% suspension was prepared by mixing 1 mg with 100 µl isopropanol. Six carotenoid standards, beta-carotene, lutein, lycopene, astaxanthin, zeaxanthin and beta-cryptoxanthin were purchased from Sigma Aldrich. By dissolving <1 mg in several ml of n-hexane with help of a sonication bath, stock solutions were obtained, and UV–vis and fluorescence emission spectra were recorded (not shown). Raman spectra of the same hexane solutions were then recorded under (pre) resonance conditions using 532 nm excitation in a quartz cuvette.
In order to better mimic the micro-environment of a plaque, the same carotenoid standards were measured after adsorption on aggregated Aβ42 in the following way: 1 µl of the peptide suspension was spotted on a stainless-steel polished substrate and allowed to dry in air. Then the carotenoid stock solutions in hexane were diluted (100 µl + 100 µl) with isopropanol and concentrated by preferential evaporation of the hexane in a gentle stream of nitrogen, adding more isopropanol, until finally reaching the same concentration in a 100 µl volume in pure isopropanol. Then 1 µl of that carotenoid solution in isopropanol was added to a dried peptide spot and allowed to dry in air before recording (pre) resonance Raman spectra using 532 nm excitation.
2.3. Fluorescence microscopy
For the (auto-)fluorescence images of the freshly cut tissue, a Leica DM2500 microscope with an external mercury metal halide bulb (EL 6000) and the filter cubes A band-pass filter (BP) 340–380 nm, low-pass filter (LP) 425 nm) and I3 (BP 450–490 nm, LP 515 nm) were used. Images were acquired via the Leica DFC450 color camera using 20× (NA 0.55) and 40× (NA 0.8) Leica FLUOTAR objectives and the LAS X software. The corresponding brightfield images were acquired using the same microscope but using the white light source and no filters.
The images of the thioflavin-S stained tissue sections were acquired using the same microscope but solely with filter I3. Positively stained plaques appear as bright yellow areas within the tissue.
2.4. Raman spectroscopy
Spontaneous Raman (SpR) measurements were recorded with a Renishaw inVia spectrometer, using an excitation wavelength of 532 nm. The spectral resolution of the instrument when using the 1800 l mm−1 grating is better than 1 cm−1 (or 0.04 nm). The attached microscope was equipped with a 50× objective (Leica HC PL FLUOTAR, 0.8 NA). The excitation power was kept constant at 3 mW at the sample plane, with a focal spot diameter of around 1 µm. Across the plaques, mapping of 51 × 51 µm and 81 × 81 µm for case I and II, respectively, was performed using a step size of 1 µm, acquiring spectra in the fingerprint region (900–1900 cm−1). In tissue, each spectrum was acquired with 1 s exposure time and three accumulations. Measurements on the single carotenoids in hexane were performed by focusing the laser through the window of a quartz cuvette. For each carotenoid, a spectrum (740–2383 cm−1) was recorded using 1 s exposure time and ten accumulations, with an excitation power of 30 mW at the sample plane.
Spectra of the carotenoids adsorbed on amyloid β-peptides (Aβ42) were measured on polished stainless-steel slides. Since some carotenoids proved to be very sensitive to photodegradation when measured this way, the dried spots were raster scanned in mapping mode and the spectra were obtained after averaging over at least 100 locations. Typical measurement conditions: 1.5 mW at the sample plane, 1 s exposure times two accumulations.
2.5. SRS microscopy
Images via SRS were recorded with an in-house built picosecond near-infrared (NIR) SRS system as described before [17, 18]. In short, we used a combination of a Stokes beam of 1064 nm, 80 MHz repetition rate and a pump beam tuned from 901 to 907 nm (covering the Amide I band) with for case I 30 and 60 mW at the sample plane, respectively, or from 800 to 820 nm (C–H stretch), with for case I 15 and 60 mW at the sample plane, respectively. For case II, powers of 25 mW and 50 mW at the sample plane, respectively, were used. In the NIR range the spectral resolution of the setup is determined by the 0.1 nm bandwidth of the lasers, which corresponds to 2 cm−1. The tissue was scanned with a water immersion 32× objective (0.85 NA) and a constant pixel dwell time of 177.32 µs with constant lock-in amplifier settings. The obtained images are an average of two (C–H stretch region) or either two or four (Amide I band) repetitive measurements, for case II and I, respectively.
2.6. Thioflavin-S staining
After the SpR and SRS measurements were completed, the tissue was stained with thioflavin-S to confirm plaque presence and location. The actual staining procedure is described in detail in [10]. Thioflavin-S is a commonly used stain/dye that binds to amyloid [13, 19–21], which is the beta-pleated conformation of stacked amyloid-beta and can be found in most plaque phenotypes.
2.7. Data processing
The acquired spectral data were processed using an in-house written chemometric Matlab GUI, allowing for pre-processing and various subsequent data analysis routines [22]. The raw data were processed by smoothing (using the locally weighted nonlinear least squares regression function 'rlowess' and a window size of 7), baseline removal (using arPLS [23]), and vector normalization and subsequently clustered using vertex component analysis (VCA) [24]. The presented spectral figures were eventually composed in OriginPro 2020b (OriginLab, USA). The carotenoid mapping data from the peptide spots were averaged and then processed.
3. Results
Following our recently developed procedure, amyloid plaques were located by using the auto-fluorescence properties of amyloid accumulations as location indicator [10]. In brief: the freshly cut and mounted tissue section was examined under the fluorescence microscope using filter cubes A and I3. Dense cored plaques could be located due to their bright emission in the blue and green, respectively. The plaque positions were marked by making scratches close to the plaque using the tip of a needle. Subsequently, the tissue was placed under the SpR and SRS microscopy setups, where the plaque areas could easily be located using the brightfield view.
3.1. Spectroscopic results on tissue
In figure 1, results of the fluorescence imaging of two cored plaques are presented. Both plaques appear as dense spots, showing blue (>425 nm) and green (>515 nm) auto-fluorescence, depending on whether the sample is illuminated with UV (340–380 nm) or blue light (450–490 nm), respectively. It should be mentioned that the green emission light was better visible under the microscope by eye than it is in the pictures. The presence of a plaque at the location of blue or green emission is confirmed by the pictures on the right, obtained after staining the tissue sections with thioflavin-S. This fluorescent compound binds to amyloid, resulting in the plaques appearing as yellow areas in the fluorescence images.
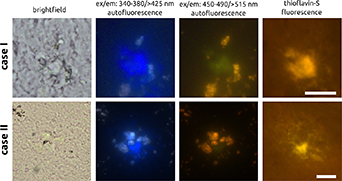
Figure 1. Images of two cored plaques. From left to right: brightfield, auto-fluorescence for UV and blue excitation, and thioflavin-S fluorescence images, all the same plaque area. In the UV and blue excited auto-fluorescence images, plaques appear in blue and green, respectively. The white and yellow spots in the auto-fluorescence images depict lipofuscin. The plaques are confirmed afterwards by thioflavin-S staining (right column, yellow areas). Case I size: 51 × 51 µm, case II size: 81 × 81 µm. Scale bars: 20 µm.
Download figure:
Standard image High-resolution imageAfter localizing and imaging the plaques using auto-fluorescence, the same plaque locations were measured with SpR. For case I, results of those measurements are depicted in figure 2. The top graph (figure 2(b)) depicts Raman spectra for four components, with the graph representing the plaque consisting of three peaks at wavenumbers characteristic of carotenoids, namely around 1003, 1151, and 1514 cm−1. Very similar Raman spectral images were obtained from four other plaque areas. The results are shown in the supplementary information.
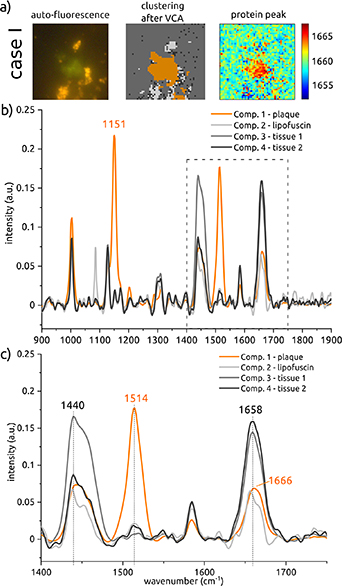
Figure 2. Spontaneous Raman scattering results for case I after VCA clustering. (a) Images of the plaque location with a size of 51 × 51 µm are shown. In addition to the visualization of the plaque in the fluorescence image, the plaque is also visible in the cluster image after VCA. Furthermore, a visualization of the protein peak has been depicted. At the plaque location, this protein peak is shifted towards the higher wavenumbers. In (b) the full fingerprint spectrum after VCA clustering is depicted, showing carotenoid peaks at 1151 and 1514 cm−1 in the plaque spectrum. In the zoomed-in (1400–1750 cm−1) graph (c), shifts in the lipid and protein peak wavenumbers of the plaque curve (around 1440 and 1658 cm−1) are visible. The colors of the curves in the graphs correspond to the colors in the cluster image after VCA.
Download figure:
Standard image High-resolution imageThe first carotenoid peak overlaps with that of other tissue components at this same wavenumber, due to the presence of phenylalanine. The Raman signal of the amino acid phenylalanine is relatively strong and sharp, and therefore it is often prominent when scanning tissue components that contain protein [25]. However, the peaks at wavenumbers 1151 and 1514 cm−1 are unique to the spectrum of plaque and match the major Raman peaks of carotenoids, see further below. The colors of the spectra correspond to the colors in the cluster image (figure 2(a), center), showing the location from where the plaque spectrum was obtained in orange. Comparison with the auto-fluorescence image on the left of figure 2(a) shows that this location is indeed the plaque location.
A second difference between the spectrum of the plaque and the other spectra can be found in the peaks around wavenumbers 1440 and 1658 cm−1. The bottom graph (figure 2(c)) zooms in on this region. The peaks at lipid (1440 cm−1) and protein (1658 cm−1) wavenumbers are slightly shifted towards the higher wavenumbers in the spectrum of the plaque, compared to the other spectra from the tissue. The shift in protein wavenumber (Amide I) has been visualized in the top right picture (figure 2(a), right). Here, we took the already processed hyperspectral Raman map data and confined the wavenumber range to the Amide I band (1650–1670 cm−1). Subsequently, we obtained the peak position of each hyperspectral pixel and computed the peak map. Afterwards, we smoothed the image with a 2D Gaussian filter. At the plaque location, higher wavenumbers are more common than at other locations in the sample.
The same results are found after processing the SpR data for case II. In the top graph (figure 3(b)), the two characteristic carotenoid peaks are present at wavenumbers 1150 and 1514 cm–1. In contrast to the wavenumber shifts observed in case I, for case II the wavenumber shift at the lipid wavenumber is less pronounced. The protein shift, however, is clearly present in the bottom graph (figure 3(c)). The shift towards higher wavenumbers is visible in the spectrum of the plaque, as well as at the plaque location in the visualization of this protein peak (figure 3(a), right).

Figure 3. Spontaneous Raman scattering results for case II after VCA clustering. (a) Images of the plaque location with a size of 81 × 81 µm are shown. In addition to the visualization of the plaque in the fluorescence image, the plaque is also visible in the cluster image after VCA. Furthermore, a visualization of the protein peak has been depicted. At the plaque location, this protein peak is shifted towards the higher wavenumbers. In graph (b), the full fingerprint spectrum after VCA clustering has been depicted, showing carotenoid peaks at 1150 and 1514 cm−1 in the plaque spectrum. In the zoomed-in (1400–1750 cm−1) graph (c), a broadening of the lipid curve and a shift in the protein peak wavenumber of the plaque curve (around 1439 and 1658 cm−1) are visible. The colors of the curves in the graphs correspond to the colors in the cluster image after VCA.
Download figure:
Standard image High-resolution imageIn both cases the expected protein peak shift (Amide I) can be observed, transitioning from an α-helix to β-sheet structure, when the plaque spectrum is compared to the surrounding tissue [26–28]. In the Raman spectra the Amide I band (1640–1680 cm−1) was rather strong and showed clear wavenumber shifts for different tissue regions. Such shifts were much less obvious for the weaker Raman peaks in the Amide II (1480–1575 cm−1) or Amide III (1200–1300 cm−1) ranges and therefore we concentrated on the Amide I band.
The protein peak shifts observed in both cases have been examined in more detail with SRS microscopy. Measurements have been performed around the plaque locations in the range from 1633 to 1681 cm−1 in 3 cm−1 steps (by tuning the optical parametric oscillator (OPO) output wavelength, with smaller step sizes around the 1660 cm−1 region). The results, presented for case I in figure 4(a) and for case II in figure 5(a), clearly show a shift of the protein peak at the plaque location towards 1666 cm−1, compared to the lower peak wavenumber of 1657 cm−1 observed at the other locations. In addition to the graph, figures 4 (for case I) and 5 (for case II) show images taken at wavenumbers corresponding to this protein peak shift (1666 cm−1), lipids (2850 cm−1), protein/lipids (2930 cm−1), and unsaturated lipids (3019 cm−1) [12–14, 29]. The thioflavin-S staining images confirm that measurements have been performed at and around the plaque locations. Looking at the same plaque locations in the images taken at 1666 cm−1, the plaque has a higher intensity than the tissue surrounding it, which corresponds to the observation from the graph.
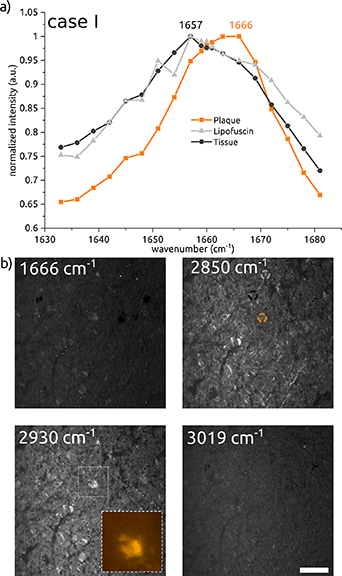
Figure 4. SRS spectra and images of case I. (a) SRS scan across the protein peak from 1633 to 1681 cm−1, indicating a peak shift at the plaque location. (b) SRS image results for four different wavenumbers. Inset shows thioflavin-S staining to confirm plaque presence. Scale bar: 50 µm.
Download figure:
Standard image High-resolution image
Figure 5. SRS spectra and images of case II (a) SRS scan across the protein peak from 1633 to 1681 cm−1, indicating a peak shift at the plaque location. (b) SRS image results for four different wavenumbers. Inset shows thioflavin-S staining to confirm plaque presence. Scale bar: 50 µm.
Download figure:
Standard image High-resolution imageHowever, the signal in the Amide I region is low compared to that in the C–H stretch region. In practice, the visualization of plaque could therefore be more convincing in the C–H region.
Furthermore, since in several studies a lipid halo has been observed around the plaques in brain samples of transgenic mice [12–14], additional measurements have been performed on case I and case II to examine the possible presence of such a lipid halo in human AD brain tissue. Lipids show a strong characteristic Raman peak in the C–H stretch region at 2850 cm−1 due to the abundant CH2 groups. This is illustrated for case II in figure 6, with in figure 6(a) the normalized intensities of the averaged spectra obtained at four different locations in the tissue. Within this C–H stretch region, the spectrum of the plaque (orange) shows a low intensity compared to the other graphs at the lipid wavenumber (2850 cm−1) and has its peak value at 2935 cm−1. Figure 6(b) shows for each spectrum where the data was extracted from.

Figure 6. (a) Normalized C–H stretch 2800–3100 cm−1 in 5 cm−1 steps for case II. The image (b) highlights the points where the spectral data were extracted from. Scale bar: 50 µm.
Download figure:
Standard image High-resolution imageWhen looking at the images in figures 4(b) and 5(b) taken at 2850 cm−1, no lipid halo is visible around the plaques. Also, around the plaque area from case I (using SRS at six wavenumbers, results not shown) we did not observe such a halo. These results in human brain tissue contradict the findings of the above-mentioned publications on transgenic mice [12–14].
3.2. Analysis of carotenoids and Aβ42
In order to find out which carotenoid(s) may be present in human AD brain tissue; SpR measurements have been performed on six pure carotenoids, of which five are reported to be common in human brain tissue [30].
This has first been done by measuring spectra of the carotenoids dissolved in hexane, and later by measuring spectra of the same carotenoids adsorbed on amyloid-β peptides, to mimic more closely the conditions found in plaques.
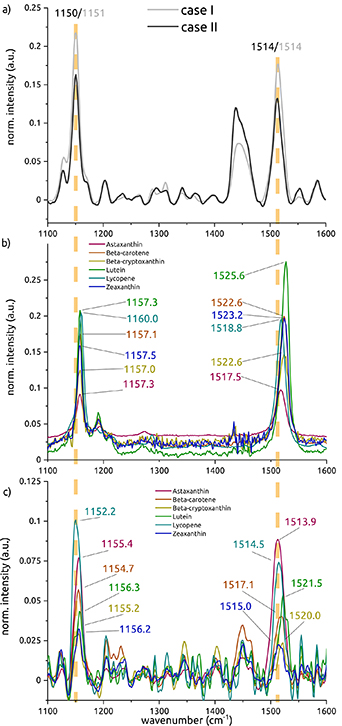
In figure 7(a), the plaque spectra of cases I and II are shown for comparison with the spectra recorded of the pure carotenoids in hexane, which are presented in figure 7(b). The spectra recorded after the carotenoids were mixed with Aβ42 are shown in figure 7(c).
Figure 7. (a) Averaged carotenoid spectra found in both AD plaques from both cases. (Orange spectrum shown in figures 2 and 3). (b) Vector normalized spectra of pure carotenoid compounds dissolved in hexane, in good agreement with the data of [31]. (c) Vector normalized spectra of carotenoids mixed with Aβ42. Peak analysis of the 6 carotenoids was done using a Gaussian fit (not shown).
Download figure:
Standard image High-resolution image
The corresponding peaks fitted with a Gaussian are indicated in table 2. For comparison, table 2 gives an overview of the wavenumber peaks found for the single carotenoids in both hexane and amyloid-β environment, and of the wavenumbers found in the two cases. Comparing the values of the pure carotenoids in hexane with the values found in human AD brain tissue shows that, although values differ between the pure carotenoids (especially peak 2 around 1520 cm−1), all values are higher than the values found in the two human cases. Simulating a chemical environment better matching the biological conditions, peak values were found to decrease to the values shown in the second and fourth column of the table by the amounts indicated in brackets. The shifts towards lower wavenumbers result in values much closer to the values found in tissue. Among the single carotenoid spectra obtained in an amyloid-β environment, lycopene approaches the values in tissue most closely.
Table 2. Overview of the peak wavenumbers (C–C and C=C modes) of the pure carotenoids, dissolved in hexane and after mixing with Aβ42, based on figure 7.
| Pure carotenoid peak 1 (cm−1) | Carotenoid mixed with Aβ42; peak 1 (cm−1) | Pure carotenoid peak 2 (cm−1) | Carotenoid mixed with Aβ42; peak 2 (cm−1) | |
|---|---|---|---|---|
| Astaxanthin | 1157.3 | 1155.4 (−1.9) | 1517.5 | 1513.9 (−3.6) |
| Beta-carotene | 1157.1 | 1154.7 (−2.4) | 1522.6 | 1517.1 (−5.5) |
| Beta-cryptoxanthin | 1157.0 | 1155.2 (−1.8) | 1522.6 | 1520.0 (−2.6) |
| Lutein | 1157.3 | 1156.3 (−1) | 1525.6 | 1521.5 (−4.1) |
| Lycopene | 1160.0 | 1152.2 (−7.8) | 1518.8 | 1514.5 (−4.3) |
| Zeaxanthin | 1157.5 | 1156.2 (−1.3) | 1523.2 | 1515.0 (−8.2) |
| in tissue (cm−1) | in tissue (cm−1) | |||
| Case I | x | 1151 | x | 1514 |
| Case II | x | 1150 | x | 1514 |
All peaks were obtained by a Gaussian fit and compared (grey rows) with the peak wavenumbers found in cored plaques in tissue of case I (figures 2(b) and (c)) and case II (figures 3(b) and (c)), see orange spectral lines. Peaks around 1003 cm−1 are not discussed due to the strong overlap with phenylalanine.
4. Discussion
The applied label-free imaging techniques show promising results for the characterization and determination of the biomolecular composition of the examined human AD brain tissue. With the help of our developed technique, we were able to further add to our previous reported results on the autofluorescence properties of cored plaques [10]. Here, we present new auto-fluorescence images of plaques using two different excitation wavelengths measuring two different emission outcomes. The observation of two different fluorescence emissions at the same plaque location suggests that at least two different molecules are present [11]. Unfortunately, we could not identify their origin, although the weak green emission could be due to carotenoids; weak fluorescence spectra with broad bands around 540 nm (not shown) were recorded in our lab for all six carotenoids in n-hexane solution. Literature also suggests that amyloid fibrils might be one of the underlying causes [32]. A more thorough study with various excitation and emission filters, or the use of a confocal fluorescence microscope with spectral detection would help to differentiate and separate the location of the emission in a more precise way. In addition, micro-extraction followed by liquid chromatography (LC) with fluorescence and mass spectrometry (MS) detection will be required to investigate the molecular nature of the fluorescence in plaques in more detail.
After areas of interest were identified via the autofluorescence images, we mapped areas of plaque locations using SpR and SRS microscopy and in particular studied the Amide I peak position in the SpR spectra in more detail. With both instruments we were able to confirm the expected β-sheet shift [33, 34] at the protein peak location. When measuring at the exact plaque locations the Amide I peak shifts towards longer wavenumbers (∼1666 cm−1), indicating a β-sheet conformation. The Amide I band in the surrounding tissue peaks around 1657 cm−1, maintaining its predominantly α-helix structure. Misfolding of a protein can be caused by different factors, such as 'mistakes in biogenesis, disease-causing mutations, and physiological stressors' [28]. By changing its secondary structure from α-helix to β-sheet the protein becomes insoluble and neurotoxic [7]. The shift in wavenumber corresponding to this change in conformation is in accordance with literature [26, 27], and can clearly be seen in the orange spectral curves of the SpR results (figures 2(c) and 3(c)), and in the SRS results (figures 4(a) and 5(a)). In addition, the computed images in figures 2(a) and 3(a) depict the peak shift in a novel way at the locations where amyloid deposits are present. The dense cored plaques show a strong β-sheet shift signal compared to other, more disperse and diffuse plaques [10]. These results provide further proof that vibrational spectroscopy is capable of label-free characterization of the biomolecular composition of areas of interest.
Besides the clear indication of the described protein peak shift, the presence of carotenoids at the plaque location was observed using SpR. Clear spectral peaks associated with carotenoids around 1150 and 1514 cm−1 [31, 35] are measured and their spectrum can easily be distinguished from spectra obtained from surrounding brain tissue. Carotenoids cannot be synthesized by humans and must be obtained from diet [36]. Carotenoids are known for their anti-inflammatory and antioxidant effects [37, 38] and potentially fight oxidative damage [38–41]. Their presence, directly at the plaque location confirms our previous results, suggesting an ongoing inflammatory process associated with AD [42, 43]. This could explain the elevated level of carotenoids found at the plaque location.
Since we could confirm our previous findings in additional cored amyloid plaques, it would contribute to the further understanding of the disease progression to know which of them are present at the plaque location. However, there are more than 600 known carotenoids [44, 45]. We recorded reference SpR spectra of six common carotenoids, of which five had been found in human brain extract samples (but not specifically in plaque) [30]. The two prominent carotenoid peaks, around 1156 and 1521 cm−1, were not matching exactly the carotenoid peaks found in human plaques. However, the lab-environment did not fit the environment found in AD brain tissue since the carotenoids were dissolved in hexane. To mimic the micro-environment of plaques more closely, we also measured these carotenoids after adsorption on aggregated Aβ42 protein. The results, presented in figure 7, show a peak shift towards the lower wavenumbers for carotenoids measured in the simulated plaque environment. This suggests that the carotenoid peak positions depend on their micro-environment. These new peak maxima are in much better agreement with the carotenoid peaks found in human amyloid-beta plaques (compare the spectral peaks in figures 7(a) and (c)). Based on the Raman spectra measured after adsorption on Aβ42 aggregates, lycopene appears to match the spectra obtained from plaque areas most closely (see table 2). This carotenoid has previously been mentioned as possibly important in the prevention of cognitive misfunctioning [46, 47] although no significant correlation was observed. Of the carotenoids measured in this study, lycopene is among the least soluble carotenoids in water due to the absence of a hydroxyl group. This property matches the hydrophobic nature of the amyloid plaque and could thus explain co-aggregation. However, although the results suggest lycopene might be present in plaque, we can only conclude so with tentativeness. In addition, if lycopene turns out to be present, it is uncertain whether lycopene is the only carotenoid or the major carotenoid present in plaque. Our finding would therefore require confirmation with an independent chemically specific technique such as LC-MS. To the best of our knowledge, similar experimental results have not been reported before.
In the current study, the spectrum of carotenoids could only be measured with the 532 nm excitation source in the SpR system. Our current SRS system is not capable of imaging the presence of carotenoids. The reason is the absorbance band of the carotenoids which peaks around 450 and 478 nm [10, 48]. The excitation source of the SpR system is near to those peaks and offers therefore (pre) resonance enhancement which increases the overall signal detection and selectivity over other tissue components. Our current SRS system, however, operates in the NIR region which is further away from the carotenoids absorbance peak and therefore does not offer any resonance enhancement. In our previous publications, we were not able to measure any carotenoid associated peaks at plaque locations using a 785 nm excitation source [10, 49] with our SpR system.
A SpR or VIS-SRS system with a 450–500 nm excitation source better matching the absorption band of carotenoids would most likely provide more pronounced results and better signal-to-noise ratio (SNR) [50, 51]. Eventually, that would allow faster image acquisition and reduced power options, further reducing potential photo-damaging effects. It would also allow to investigate different plaque phenotypes which are less dense and therefore potentially lack a strong carotenoid signal, if any at all. Currently, the load of pathology in AD brain is assessed with (immuno-) histology and different staging methods according to Braak, CERAD and Thal [52]. Assessment and staging of pathology without labeling would offer an advantage for diagnostics. Furthermore, the carotenoid analysis could provide additional information on the pathological structures used for pathological staging and therefore provide more insight in the disease process. Since carotenoids fight inflammation, further research will help to understand if carotenoids only appear when amyloid(-β) is already accumulated or if they are already present when the first amyloid fibrils are occurring.
Recent publications report on the presence of a distinct lipid halo around amyloid deposits in Alzheimer mouse models. Since there is no similar analysis reported yet on human AD brain tissue, we employed SRS in the C–H stretch region. During this study, we focused on dense cored plaques since they appear in a similar manner as plaques in the transgenic mice. There, the amyloid accumulation is very dense, and the plaque size is rather compact and usually below 20 µm. Using the wavenumbers suggested in the literature for lipids [12–14], we imaged human AD plaques. As shown in the SRS images of figures 4 and 5, we could not observe a pronounced lipid ring around the dense cored plaques of our cases. Apart from the 'raw' wavenumber images presented here, we also applied a simple linear decomposition algorithm to increase differentiation [18]. The resulting images were higher in contrast but still did not show any lipid-associated ring or halo around the plaque. We hypothesize that the reported lipid ring/halo in AD mice might be a side effect of artificially introduced amyloid and can therefore only be found in transgenic mice. The ring might emerge due to the lack of protein in the near surrounding tissue area since it is rapidly aggregated in the artificially induced protein accumulation. That could lead to an increased relative occurrence of lipid in the surrounding ring. The absence of a lipid ring in our data is an important reminder that cell type differences in animal models compared to human tissue can be extensive and could lead to different results [53]. However, a direct comparison study between transgenic AD mice and human tissue, using the same SRS device, would help to clarify these potentially contradictory results.
SpR has the advantage of recording a full spectrum per pixel but at the cost of extended acquisition time. If one wants to investigate only specific wavenumbers, as e.g. in our case the distinct carotenoid peaks or the beta-sheet shift, SRS outperforms SpR by at least two-three orders of magnitude in mapping speed, and apart from shortening the overall measurement time this can also be used for imaging a larger tissue area.
5. Conclusion
In this study, we performed fluorescence and Raman microscopy on unlabeled amyloid plaques in human AD brain tissue. The fluorescence images obtained from two cored plaques show the autofluorescence property of plaque, with the plaque emitting blue and green fluorescence when excited in the UV (340–380 nm) and blue (450–490 nm), respectively. Comparison of the location and shape of the fluorescent spots indicate that the two components responsible for the fluorescence observed are largely co-located. SpR measurements across the same location within the tissue sections reveal the presence of carotenoids in amyloid-beta cored plaques, by showing clear peaks at 1150/1151 and 1514 cm−1.
Furthermore, the plaque spectra show shifts in the wavenumbers of the lipid and protein (Amide I) peaks, compared to the spectra from the surrounding tissue. Further investigation on the protein shift with SRS microscopy indicates a peak value of 1666 cm−1 in plaque, compared to a peak value of 1657 cm−1 in the rest of the tissue. This shift in wavenumber can be explained by the change in protein structure, namely from an α-helix or random conformation into a β-sheet structure, when amyloid-beta peptides accumulate into plaque. Additional SRS measurements have been performed in the C–H stretch region. However, the presented results, obtained from human AD tissue, do not show a pronounced presence of lipids around the plaques. This suggests that the presence of a lipid ring as reported for transgenic mice, might be a side-effect of the transgenic mouse model. Lastly, SpR measurements on six carotenoids have been performed under pre-resonance conditions, both with the carotenoids dissolved in hexane, as well as with the carotenoids in a mixture with amyloid-beta peptides. The results show that the micro-environment of the carotenoids influences the vibrational frequencies, leading to different peak wavenumbers. We note that the measurements performed on the protein aggregates give peak wavenumbers more similar to the values found in the human AD brain sections. Of the six carotenoids measured, lycopene comes closest to the values found in the two presented human plaque cases. However, the carotenoids' exact molecular identification would require confirmation with an independent, chemically specific technique such as LC-MS.
Acknowledgments
The authors would like to thank R W Schmidt for providing the chemometric software GUI. We would also like to thank Tjado H J Morrema for technical assistance.
This research is supported by the Dutch Technology Foundation STW (Grant Number 13935, I-READ), which is part of the Netherlands Organization of Scientific Research (NWO), and which is partly funded by the Ministry of Economic Affairs.
Data availability statement
The data that support the findings of this study are available upon reasonable request from the authors.