

Abstract
A polarization control method using crystal birefringence is suggested to manipulate polychromatic light. This scheme can be used with narrower bandwidth to produce various spectral effects, such as a notch filter, a flat top, and triangle-type, nipple-type, and central-frequency-dominant distributions. A modulated spectrum with greater bandwidth can be used as an optical frequency ruler, and phenomena called complementary spectra are also proposed, where the two spectral distributions, produced by rotating the polarizer, complement each other in the sense that the peaks and valleys in one spectrum are the reverse in the other. These results benefit the controlling of the spectral shape and the measurement of an unknown optical frequency.
Export citation and abstract BibTeX RIS
1. Introduction
In the past, a light source spectrum was believed to be maintained in free space propagation. However, spectral changes do take place during propagation unless the degree of spectral coherence of the source satisfies the scaling law, called the Wolf effect [1]. The scaling law is not easily satisfied and consequently spectral changes occur [2]. Other mechanisms causing spectral changes or manipulating the spectra have attracted much interest. Many methods have been developed, including aperture variations [3], spectral correlation [4], and material interaction or scatting [5–8], with many interesting results found, such as those from spectral switches [9, 10], spatial coherence spectroscopy [11], lattice spectroscopy [12], data transmission [13], Talbot spectra [14, 15], etc. Other spectral shaping approaches have been proposed [16, 17], used mainly in short-pulse laser applications. For example, the infrared laser pulse can generate polychromatic light in noncentrosymmetric crystals with nonlinear effects. The spatial shape of the beam and its energy can influence multicolor frequency conversion and shape its spectrum [16]. Zhu et al [17] used the birefringence of quartz crystal with sophisticated structure and orientations to obtain the required spectral transmittance curve along the TM polarization to prevent the gain narrowing effect at the incident spectrum peak wavelength.
In this work another birefringence scheme with simple crystal structure using two extra polarizers is proposed. This method is suitable for unpolarized natural light to shape its spectrum in a different way. As will be shown, various spectral effects and phenomena can be obtained for different polychromatic light bandwidths. We will show that the spectrum of polychromatic light can be shaped dramatically by just turning the polarizer, which benefits the polychromatic light manipulation. The optical frequency ruler and complementary spectral effects are also proposed, which may find potential applications in optical spectral metrology.
2. Theoretical analysis
The schematic setup is illustrated in figure 1, where polarization control is employed. It is assumed that an antireflection coating is applied to each element in the setup; thus only the transmission light is considered. Let us consider an incident polychromatic light of which the spectral density S0(ν) is assumed to have a normalized Gaussian distribution, with central frequency ν0 and bandwidth Γ of

By passing x-direction Polarizer 1, as indicated by the red arrow on it, the light becomes linearly polarized along the x-axis for each frequency component, as plotted between Polarizer 1 and the crystal. A calcite crystal is used, which is a negative uniaxial crystal with ne < no. With the fast axis set at an angle of 45° to the x-axis, it introduces a phase difference to the out-coming light between the fast and slow axes. The phase difference Δφ for each frequency (or wavelength) depends on the refraction index difference and the thickness d of the crystal, which can be written as

where c is the speed of light and λ the wavelength in free space, with the relation c = λν. The refractive indices of both the fast ne(ν) and slow axes no(ν) are functions of the optical frequency (or wavelength), as follows [18]:
Thus, different frequency components will experience different amounts of phase difference, from equations (2) and (3), which result in various polarization states after passing through the crystal. If Δφ(ν) is 0, π/4, π/2, 3π/4, π, etc, the polarization state should be x-polarized, elliptically polarized, circularly polarized, elliptically polarized, y-polarized, etc, respectively, as shown schematically under the spectrum emergent from the crystal in the figure. The eight polarization states correspond to the eight phase differences  illustrated below. Note that in the figure only a limited range of Δφ and its corresponding polarization states are shown (with Δφ varying from 0 to 2π). The real Δφ range depends on the light bandwidth and the crystal thickness. Δφ at the center frequency is specifically set at π (a half-wave plate), which will be explained in the next section. Polarizer 2 is set at an adjustable angle θ to the x-axis, as shown in the figure. Due to the polarization selection by Polarizer 2, different frequency components have different transmittances, which are useful for providing modulation or manipulation on the original spectrum. According to the optical transfer matrix [19], the Jones matrices of the retarder
  and the polarizer
  are used:


where  is the fast-axis angle to the x-axis and
  is the polarization angle to the x-axis. With the Jones matrices and the prescribed configuration, such as the corresponding Jones matrix shown in figure 1, the spectral density of emergent light from Polarizer 2 can be obtained as
M(ν, θ) is the modulation function on the original spectrum. Considering the polychrome and dispersion elements, different frequency components will show different properties after passing through this system. By choosing suitable parameters, the emergent light spectrum can be tunable over a wide range, as explained below.

Figure 1. Polarizer 1 is oriented in the x direction. The fast axis of the crystal of calcite is set at an angle of 45° to the x-axis, and its thickness is equal to d in the z direction. Polarizer 2 is oriented at an angle of θ to the x-axis, which is tunable.
Download figure:
Standard image High-resolution image3. Results and discussion
Here we discuss some examples to illustrate how this scheme is used, including spectrum shaping, the optical frequency ruler, and complementary spectra.
3.1. Spectrum shaping
Considering that the crystal is used as a half-wave plate at the central frequency, the induced phase difference between the fast and slow axes at the central frequency is equal to (N + 1/2) × 2π, where N is a positive integer. We choose λ0 = 600 nm (ν0 = 5* 1014 Hz), Γ = 0.05ν0, and N = 8 as an example to show the spectrum shaping system in figure 1. This kind of crystal corresponds to a multiple-order wave plate, in which d, from equation (2), is equal to (8 + 1/2) λ0/(ne(λ0) −no(λ0)) ≈ 30 μm. Figure 2 shows the emergent spectra for different θ of Polarizer 2. By setting θ = 0, two major peaks exist, distributed symmetrically around the central frequency in figure 2(a). The spectral density of the central frequency component is 0 and it can be used as a notch filter at λ0. With increasing θ, the central frequency spectral density component increases and the two peaks drop gradually, as in figures 2(b) and (c), until they reach the same level and a flat top occurs (see figure 2(d)), while θ = 30π/128. However, when θ = 32π/128, the spectral intensity tends to be a lower Gaussian-type distribution (see figure 2(e)). With a little increase in θ to 35π/128 (figure 2(f)) and to 40π/128 (figure 2(g)), a nearly triangle-type distribution is formed and then it changes into a nipple type. With continuous increase in θ, the central frequency component grows continuously, together with two frequency components on each side (figure 2(h)), until finally the central frequency dominates (figure 2(i)) at θ = 64π/128. The spectral intensity distribution evolution is a consecutive process while tuning θ from 0 to 64π/128. Although this kind of modulation is not comprehensive, the emergent spectrum can still be manipulated over a very wide range from figures 2(a)–(i), including a notch filter, a flat top, and triangle-type, nipple-type, and central-frequency-dominant distributions. While θ changes from 64π/128 to π, the induced spectral intensity distribution evolution is an inverse process. Note that only when  is a multiple of π can the polarization states be linearly polarized. To fully control the transmittance with a linear polarizer at the center frequency, as in figure 2, the condition
  should be maintained; i.e., the crystal should be used as a half- or full-wave retarder at the center frequency. If the half-wave plate is changed to a full-wave plate, i.e., d = 8λ0/(ne(λ0) −no(λ0)) ≈ 28 μm, similar spectral density control can also be obtained, but for different values of θ.
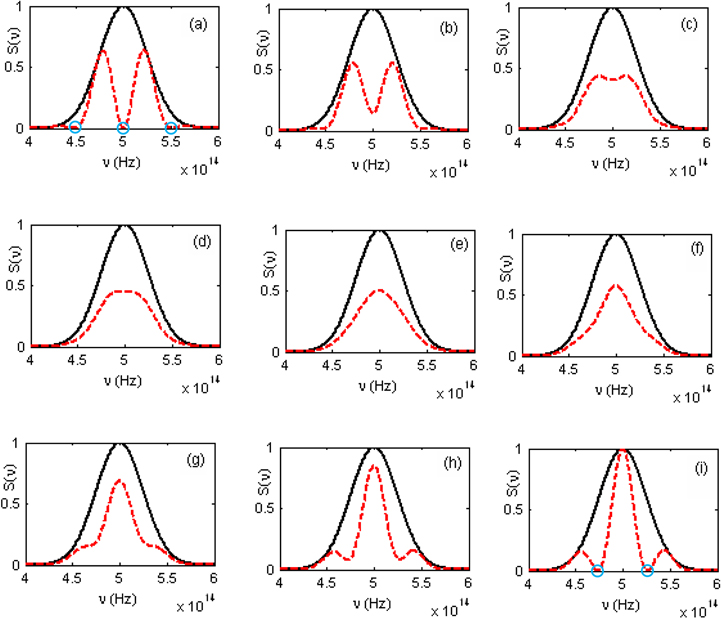
Figure 2. The emergent spectra from the crystal. The values of θ for polarizer 2: (a) 0; (b) 16π/128; (c) 28π/128; (d) 30π/128; (e) 32π/128; (f) 35π/128; (g) 40π/128; (h) 48π/128; (i) 64π/128. The black solid line indicates the original spectra; the red dotted line indicates the emergent spectra. The blue circles on the abscissa of figures (a) and (i) indicate the totally vanishing frequency components.
Download figure:
Standard image High-resolution image3.2. Optical frequency ruler and complementary spectra
After examining the spectrum shaping for narrow polychromatic light, let us find some other possible applications for broader spectra. The authors suggest an effect called the optical frequency ruler [20], which utilizes the interference spectrum to give the constructive (color line) and destructive (dark line) frequency components for broadband light. Since the exact locations of the dark line are known, they can be used as the ticks of a ruler to refer to or estimate an unknown frequency (or wavelength). The interference spectrum usually contains many spikes in the frequency domain and in a previous work it is produced by a double-slit with moving fluid. By varying the fluid speed, the tick period in the ruler can be adjusted, producing a dynamical frequency ruler. Similar phenomena can be achieved using the Fabry–Perot etalon or the optical comb technique [21], which needs a resonator and where the line-width is usually fixed by the finesse and the Q-factor of the cavity [22].
Let us now turn our attention to the present scheme (figure 1) for a broader spectrum with Γ = 0.1ν0 and the same ν0 = 5* 1014 Hz. First set the angle θ of the Polarizer 2 to zero (along x-axis). The emergent spectrum (red line) is shown in figure 3(a), and again we find that many spikes (about four) exist. If more spikes are needed, we can either use a thicker crystal or increase the light bandwidth, as seen from equation (2). The positions of the peaks (marked with red triangles on the abscissa in the figure) and dark lines (marked with blue circles on the abscissa in the figure), from equation (5), satisfy
It seems that this polarization scheme also gives many regular vanishing frequencies (dark lines) with exact known positions and can also be used as an optical frequency ruler, without resorting to the more complicated methods mentioned above, such as the interference spectrum or the Fabry–Perot etalon. Another interesting property of this scheme is illustrated by setting the angle θ to π/2; the emergent spectrum is shown in figure 3(b). The figure shows that the peaks and troughs (dark lines) in figure 3(a) turn into troughs (dark lines) and peaks in figure 3(b), respectively, as indicated by the two vertical arrows. The emergent spectrum undergoes a complete reverse transition and the spectra seem to complement each other. This phenomenon is proposed for the first time and we name the resulting spectra complementary spectra, as suggested in the title. According to equation (5), the positions of peaks and dark lines satisfy

Figure 3. The emergent complementary spectra (Γ = 0.1ν0). The values of θ for polarizer 2 are (a) θ = 0 and (b) θ = π/2. The black solid line indicates the original spectra; the red dotted line indicates the emergent spectra. The blue circles on the abscissa of the figure indicate the totally vanishing frequency components (dark lines) and the red triangles indicate the peak frequencies.
Download figure:
Standard image High-resolution imageThus from equations (6) and (7) it is easy to see why the peaks in figure 3(a) are now troughs in figure 3(b), and vice versa. When light with a spectrum similar to that in figure 3 transmits through a dispersive element (like a prism or grating), the out-coming spectrum exhibits some regular dark lines, as shown in figure 4. Since the dark lines can be used as frequency ruler ticks to refer to an unknown frequency, complementary spectra facilitate identification of the unknown frequency, as explained below. Figure 4 schematically depicts a pair of complementary spectra (A) and (B), whose spectral colors (in the middle) and intensity distributions (at the top and bottom) are plotted separately for clarity. Note that the peaks and dark lines in (A) are in the positions of the dark lines and peaks in (B). As pointed out previously, the dark lines can be used as ticks, and we vertically extend the dark lines in intensity distribution into the spectrum, which are the ticks of the spectrum. Now if strong green light is emitted with unknown but specified wavelength (or frequency), as indicated in the figure, it will be located between the third and fourth ticks from the left in spectrum (A). To better locate the position of this light, the complementary spectrum (B) can be obtained by rotating the polarizer, and its third tick from the left is much closer to the green line, which facilitates identification of the location of the light frequency.

Figure 4. A schematic plot for complementary spectra (A) and (B). The intensity distributions (at the top and the bottom) and the spectral colors are shown separately for clarity. The ticks in the spectra are the vertical extensions from the black lines in the corresponding intensity distributions in (A) and (B). The green line is the light to be located.
Download figure:
Standard image High-resolution image
Note that the polarization states caused by the calcite's birefringence in figure 1 are elliptically (or circularly) polarized, except for Δφ conditions being a multiple of π, where they are horizontally or vertically linearly polarized. Consequently the dark lines can only be obtained with a linear Polarizer 2 pointing along the x- (θ = 0) or y-axis (θ = π/2), as seen in equations (6) and (7). Other linear Polarizer 2 orientations cannot completely block the frequency components with elliptical (or circular) polarization. This statement is consistent with the result in figure 2, where only figure 2(a) (θ = 0) and figure 2(i) (θ = π/2) show the frequency components totally vanishing, as indicated by the blue circles.
At this point some comparisons can be made between our scheme and Zhu's work [17]. In order to obtain the specific TM transmission curve (see figure 6 in [17]), the crystal is prepared at precise thickness with the surface normal and the optic axis oriented and adjusted at specific angles. Our work is mainly intended for unpolarized polychromatic light, and thus two polarizers are used in addition to the birefringent crystal, with the optic axis set at an angle of 45° to the x-axis and the surface normal along z. Consequently the outgoing light is modified as equation (5) and has the same polarization as Polarizer 2 (see figure 1). While only the TM component of the outgoing light can be sustained with a resonant cavity for laser amplification, the TM transmission function has the form of the equation above figure (5) in Zhu's work, which is different from that of our modifier in equation (5). Thus, Zhu's work is more suitable for sophisticated spectral TM transmittance curve tuning for a short-pulse laser. Our scheme is favorable for shaping unpolarized light spectra and the emergent light has the same polarization as that of the second polarizer. It is more suitable for producing spectral dark lines (the blue circles in figure 3) for an optical frequency ruler or complementary spectra.
4. Conclusions
We proposed an easy and direct, but delicate, polarization control method for performing spectral modulation. A special and useful example was illustrated using a calcite crystal as a half-wave plate at the central frequency component. The emergent spectrum from the system can be manipulated over a wide range. Although this method is not comprehensive, it can still perform effective control of spectral distributions, such as a notch filter, a flat top, and triangle-type, nipple-type, and central-frequency-dominant distributions. It was also found that, for greater incident light bandwidth, many regular dark lines are induced that can be used as an optical frequency ruler. This scheme produces frequency ticks much more easily than previous methods, such as the interference spectrum or Fabry–Perot technique. With the proposed configuration, dark lines can be switched, by turning Polarizer 2, to 'bright lines' and vice versa—which are named complementary spectra for the first time. These results provide many advantages for spectral control and may find other applications in spectral manipulation or measurement fields.
Acknowledgments
This study was supported by National Chung Hsing University (Taiwan), Ministry of Science and Technology of ROC, under Contract No. MOST 104-2221-E-005-069-MY3 and by the Promotion Program for Young and Middle-aged Teachers in Science and Technology Research of Huaqiao University (Grant ZQN-PY306).