

Abstract
We report on the spectral dependence of the SERS amplification in randomly distributed gold nanoparticle arrays grown by electron beam evaporation, covered with a thin shell of SiO2. Experiments carried out with six different laser lines highlight a remarkable red-shift between the optimal excitation wavelength (785 nm) and the localized plasmon resonance peak (560 nm) measured by extinction spectra. The different enhancement undergone by the vibrational peaks of the probe molecule is studied as a function of the excitation energy. The origin of such a shift is discussed in terms of the scattering efficiency of the gold nanoparticles.
Export citation and abstract BibTeX RIS
Introduction
Surface enhanced Raman spectroscopy (SERS) [1, 2] has emerged as a tool for highly sensitive detection of biomolecules and chemicals with sensitivity down to the single molecule level [3, 4]. SERS principally exploits the giant electromagnetic field enhancement generated by the localized surface plasmon resonance (LSPR) excited in noble metal nanoparticles (NPs) [5, 6]. Indeed, when an incident electromagnetic field at wavelength λL matches the localized plasmonic oscillation mode of the metal nanostructures (resonant at λLSPR), the coupling effect leads to a large enhancement of the electromagnetic field in its proximity. The field reaches very high values in particular regions, called 'hot spots.' In isolated NPs, the hot spots are located at their edges, tips, or sides, depending on the LSPR excited [7, 8]. The hot spots are enhanced at the gap when NPs are near-field coupled [9]. The field enhancement at the gap with respect to the field at the tips depends on the interstitial distances [10]. In addition, upon coupling, the dipolar resonance energy shifts toward the red part of the spectrum, whereas a new peak appears at high energies related, this time, to the quadrupolar resonance [11]. According to the E4 electromagnetic model [12], in SERS the signal enhancement has a twofold origin [13, 14]. Together with the incident field, the Raman-scattered field (at wavelength λR) is also enhanced whenever the Raman photon energies are close to the plasmon resonance (λR ≈ λLSPR). The final SERS intensity  can be expressed as

where Γexc (λL) and Γrad (λR) are, respectively, the enhancement factors of the excitation and the re-radiated Raman fields and  is the incident field intensity [13, 15]. In a first approximation, the 'resonance' conditions are encoded by the extinction spectrum
  i.e., it is assumed that
  for both the excitation and the re-radiation effect [12, 16]. The SERS enhancement factor is therefore calculated as

As a rule of thumb, the EF is expected to be maximum when both the excitation and the SERS photon wavelength fall within the LSPR profile of the NPs, matching the condition λL < λLSPR < λR (Wokaun's rule) [12]. The validity of this rule is, however, still controversial and the question 'given a SERS substrate with known LSPR, which is the excitation wavelength providing optimal SERS?' remains without a definitive answer. Experiments on Ag [17] and Au [18] nanostructures showed that, for excitation in the visible range, maximum SERS enhancement occurs when the incident and Raman radiation wavelengths satisfy Wokaun's rule. Working on Au nanocylinders, however, Guillot et al [19] showed that this trend is verified exciting at 633 nm, but not confirmed for an excitation wavelength tuned at 785 nm; in this latter case, the best SERS intensity was found for a corresponding LSPR maximum outside the excitation Raman wavelength, i.e., when λLSPR < λL < λR. Strong SERS with near-infrared (NIR) excitation is also reported on randomly distributed silver NPs by Abalde-Cela et al [20], despite the large mismatch between the LSPR position (400–600 nm) and the excitation wavelength (785 and 830 nm). Similar results are found by Weber et al [21] on gold core–shell structures. These experimental discrepancies are tentatively explained in terms of a red-shift between the LSPR peak, typically measured by far-field extinction spectroscopy, and the spectral maximum of the near-field enhancement, which is more shifted towards the near-infrared [22, 23]. Such a red-shift has been theoretically predicted [22, 24, 25] and associated with damping of the plasmon oscillation [26]. The shift depends on the size of the particles [27], with larger particles displaying a more marked shift. Experimental verification requires, however, near-field microscopy/spectroscopy [28, 29] and to date it is only limited to the IR part of the spectrum [30]. For random NPs arrays, an alternative explanation has been provided, attributing the shift to the presence of sparse but very efficient randomly distributed hot spots that, due to their very small number, cannot be detected in the extinction measurements since the associated LSPR intensities are too low [20, 31]. Both explanations have controversial aspects and, still, there is not a complete and simple model in agreement with the experimental data that can be used for a quantitative prediction of the shift.
Motivated by the ease of fabrication, good enhancement, and robustness of SERS substrates made of randomly distributed gold NPs grown by electron beam evaporation and covered with a thin silicon oxide shell, we carried out a set of experiments with different excitation wavelengths, aimed at studying the spectral dependence of the SERS enhancement and optimizing the performances of such samples. We find maximum SERS for near-infrared excitation (785 nm), whereas extinction is peaked in the visible (620 nm) and negligible at 785 nm. We observe, moreover, that the relative enhancement of the different Raman modes of the probe molecules (Methylene Blue, MB) is excitation dependent: higher energy vibrations (1620 cm−1) are more enhanced with respect to low energy ones (450 cm−1) exciting at 515 nm, whereas the opposite is observed in the NIR. Surprisingly, the spectral dependence of the amplification is found in agreement with the scattering properties of the NPs.
Materials and methods
Gold NPs and reference substrates
Randomly distributed gold NPs are prepared by electron beam evaporation (EBE) on a SiO2 substrate. A 2 nm thin layer of gold, corresponding to a gold amount of 1 · 1016 atoms/cm2, is evaporated at room temperature using high purity (99.99%) gold pellets as a source on the substrate heated at 480 °C. This technique permits a perfect control of the thickness of the gold film deposited on the substrate by using a quartz microbalance, confirmed by Rutherford backscattering (RBS) analysis. Gold atoms arrive on the heated substrate, diffuse over the substrate and immediately start a ripening process that leads to cluster formation. In order to promote the adhesion of the gold NPs to the substrate, the clusters were covered by a thin silicon oxide layer (2–3 nm) produced by RF magnetron sputtering. Structural characterization of the Au NPs was performed by Gemini Field Emission scanning electron microscopy (SEM) Carl Zeiss SUPRA 25. Notably, the presence of SiO2 fosters the robust sticking of gold to glass without the need to deposit chromium or titanium layers, known to damp the LSPR of the NPs [32]. A thick flat gold film (surface roughness 1.1 nmRMS) grown by evaporation is used as a reference for the evaluation of the SERS enhancement.
Probe molecule
MB is used as probe molecule. MB has Raman active vibrations in the 400–1650 cm−1 region with the most intense peaks at 450 cm−1 and 1620 cm−1 [33]. MB features a strong electronic absorption in the red part of the spectrum (monomers and dimers strongly absorb light at 670 and 620 nm, respectively) leading to a resonant Raman enhancement of ca. two orders of magnitude with respect to excitation in the NIR (see [7, 9] for more details). MB is absorbed on the gold NPs and the flat gold film by immersion into the aqueous solution of dye for 1 h. The MB solution is prepared mixing deionized water with the powder (Aldrich) at the concentration of 10−4 M. The samples are then rinsed in water and dried in a vertical position under continuous airflow to avoid the formation of macroscopic aggregates (typical coffee ring effect) of MB. This method guarantees that one or few layers of MB dye adhere onto the surfaces [see 7, 15, 34 and references therein]. The silica layer prevents the detachment of the NPs from the glass substrate during immersion, a phenomenon observed otherwise.
Extinction, scattering and SERS experimental setups
Measurements are carried out with a HR800 Horiba Jobin Yvon micro-spectrometer combined with an optical microscope (Olympus BX51). For the extinction measurements (figure 1(a)), we exploit the white light xenon lamp embedded in the microscope of the HR800 spectrometer. A 10X objective (NA = 0.25) is used to collect the light transmitted through the sample and the spectrometer is used to acquire the optical signal. The LSPR profile is obtained from the ratio between the light transmitted in absence (I0) or in presence of NPs (INPs) according to the formula E(λ) = −log10(INPs/I0). In order to investigate the scattering contribution, we use a setup depicted in figure 1(b). White light is launched through an optical fiber and a collimator with an incident angle of 45° with respect to the sample plane. The scattered light is then collected through a 10X objective (NA = 0.25, working distance 1 cm, collection angle 2α = 30°) normal to the sample plane in order to avoid collection of the reflected light, and analyzed by the spectrometer. The scattering profile is obtained normalizing the scattering signal to the spectral profile of the light source. Multi-wavelength SERS measurements are carried out at 515, 532, 633, 660, 691, and 785 nm in a backscattering configuration (figure 1(c)). Measurements are done focusing a laser beam on a submicron spot with a 100X microscope objective (NA = 0.90). All the spectra were acquired with integration times from 10 to 120 s and powers from 4 to 400 μW, while the accumulation number and the slit aperture were kept fixed at 1 and 100 μm, respectively.
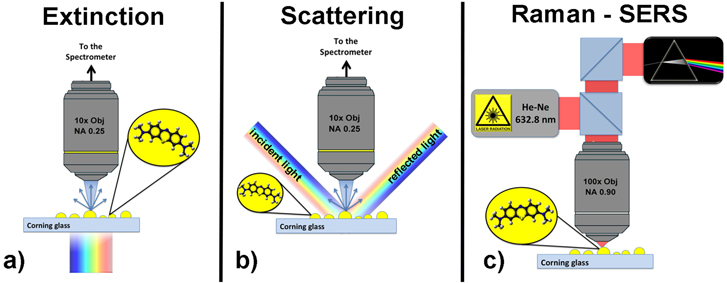
Figure 1. Schematic representation of the experimental setups used for the (a) extinction, (b) scattering, and (c) Raman–SERS measurements.
Download figure:
Standard image High-resolution imageNumerical simulations
Numerical calculations have been carried out using the discrete dipole approximation (DDA) [34, 35] to solve numerically Maxwell's equations. DDA is based on discretizing the target shape into a set of polarizable and interacting elements, and solving the induced system of unknowns. Here we consider a set of coated spheres randomly distributed with gold core (dimension ranging between 8 and 24 nm) and a shell of 2 nm of SiO2. The substrate is taken into account by using an effective medium approximation with effective refractive index [36]. Then, an additional shell is added to each sphere to take into account the absorption of the probe molecule. To bench the DDA and choose the size of used dipoles, we compare the results for a unique coated sphere with the Mie theory [37].
Results and discussion
Morphology and extinction properties
SEM of the gold NPs sample (figure 2(a)) shows spherical- and ellipsoidal-like particles with average diameter d ∼ 18 nm and a dispersion ( of 11 nm around d (figure 2(b)). Sparse larger NPs (d ∼ 50 nm) are also present. The gap sizes range from few nm up to few tens nm. We cannot exclude, due to the limited resolution of the SEM, that in some points the NPs could be in contact.
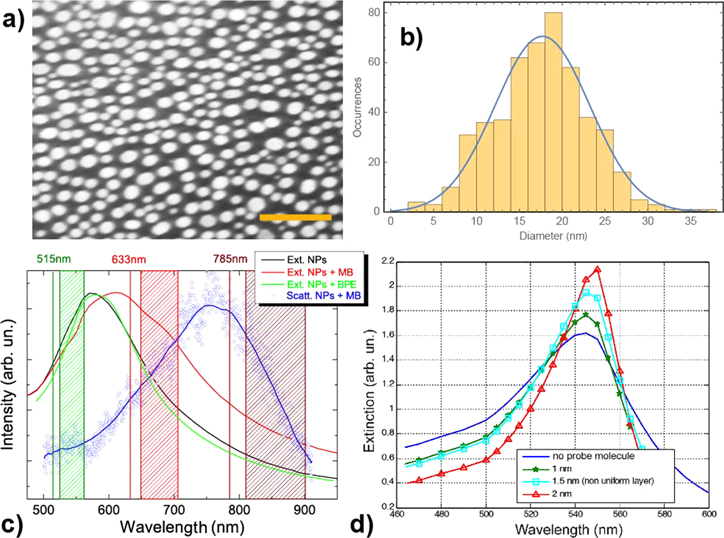
Figure 2. (a) SEM image of gold NPs produced by EBE on glass substrate. Scale bar is 100 nm. (b) Size distribution of the gold NPs. (c) Extinction spectra of bare gold NPs (black line) and after deposition of the MB molecules (red line) and BPE (green line); blue symbols show backscattering spectrum of the NPs with MB (the blue line is a smoothing of the data). All spectra are normalized to unity. Three excitation wavelengths used for SERS, together with the corresponding Raman scattering regions (450 to 1630 cm−1), are indicated by the vertical colored lines and the dashed boxes, respectively. (d) Extinction spectra calculated on a cluster of 8 gold NPs before (blue line) and after adsorption (green, cyan and red lines) of different layers of a probe molecule with constant refractive index of 1.55–0.6i.
Download figure:
Standard image High-resolution imageExtinction measurements (figure 2(c)) show different LSPR between the bare NPs (black line) and the NPs after adsorption of probe molecules. Trans-1,2-bis4-pyridylethene (BPE), featuring no electronic transitions in the visible–NIR, causes a shift of only few nm in the LSPR profile (figure 2(c), green line). MB, instead, (figure 2(c), red line) has strong absorption between 600 and 700 nm [7, 15] and yields a red-shift of the LSPR of about 35 nm (from 575 to 610 nm) and a marked broadening toward the near-infrared part of the spectrum. Shifts are likely due to the change of effective dielectric constant of the medium surrounding the NPs upon absorption of the probe molecules [17]. Numerical calculations carried out by DDA on small NPs clusters (eight particles with random arrangement and dimension ranging between 8 and 24 nm) confirm how the deposition of thicker and thicker layers of probe molecules (we assume a molecule with constant refractive index, for simplicity) yields an increasing red-shift of the LSPR (figure 2(d)). The backscattering (figure 2(c), blue symbols) peaks around 750 nm, remarkably red-shifted with respect to the extinction maxima.
Expected SERS enhancement
Some qualitative analysis of the SERS enhancement expected from the gold NPs clusters can be drawn based on the E4 model, assuming that the local- and the re-radiation field enhancement factors scale with the extinction intensity, i.e., EF ∼ Qe(λL) × Qe(λR). Excitations at 515, 633, and 785 nm (indicated by the colored vertical lines in figure 2(c)) cover both the ascending and descending regions of the LSPR profiles and are, therefore, well suited to gain a first insight on the spectral dependence of the EF. In particular, if the extinction of the bare NPs is considered for the calculation (equation (2)), SERS is expected to be maximum at 515 nm (where both the excitation and the Raman photon energies are close to the peak LSPR) and negligibly small at 785 nm (where both laser and Raman photons are off-resonance). If, instead, we consider the MB-induced red-shifted extinction profile, maximum SERS is expected at 633 nm (laser is resonant with LSPR). Excitation at 785 nm is in the tail of the LSPR, so some SERS is expected although the enhancement should be much smaller than at 633 or 515 nm. Excitation at 633 nm represents the situation closest to Wokaun's rule. Some considerations can also be drawn on the expected relative amplification of the different vibrational modes at a given excitation wavelength. MB is well suited to this aim, featuring several vibrations in the 400–1650 cm−1 region (indicated by the dashed boxes in figure 2(c)). According to equation (2), for a given λL, we expect EF ∝ Qe(λR). Based on the measured extinction profiles, at 515 nm, we expect a progressive increase of the intensity of the SERS peaks passing from the low frequency MB modes to the higher ones. An opposite behavior is foreseen for excitations at 633, 660, 691, and 785 nm, in which the condition of maximum re-radiation is better verified for the 450 cm−1 peak than for the 1620 cm−1 one.
SERS enhancement measurements
In order to study the spectral dependence of the SERS enhancement and check the validity of Wokaun's rule on gold NPs clusters, SERS experiments have been carried out using six lasers tuned from the visible to the near-infrared (515, 532, 633, 660, 691, 785 nm). For each excitation, the SERS intensity of the different MB vibrational bands (peaked at 450, 500, 897, 1152, 1301, 1390, 1425, and 1620 cm−1 [7, 38]) are compared with the corresponding Raman intensities acquired (with the same setup) on a reference sample consisting of flat gold film known to provide negligible (if any) amplification [7, 9].
Normalization of the SERS signal measured on the gold NPs to the Raman signal from a flat gold surface allows one to get rid of any modification of the Raman cross-section due to chemical interactions of the molecule with gold (e.g., chemical enhancement) and resonant Raman enhancement effects related to the resonant excitation of the molecule (as occurs for MB when using red lasers), highlighting the pure electromagnetic effects in SERS [7]. The normalized signal is, in addition, independent from the wavelength-dependent response of the spectrometer. In figure 3 we plot the SERS gain G, calculated as the SERS to Raman intensity ratio, normalized to the power and integration times [9], as a function of the excitation wavelength (different colors) and, for each excitation, as a function of the wavelength of the Raman photons (colored symbols). It is evident the incremental behavior of G; at 515 nm, we have a modest enhancement ranging from ∼7, for the low frequency modes, to ~60 for the band at 1620 cm−1. At 532 nm, G increases from 30 to 100 and at 633 nm from 220 to 350. At 660 and 691 nm, the gain reaches three orders of magnitude, and seems to be constant whatever the considered mode under these irradiation wavelengths. Maximum gain is observed for excitation at 785 nm, for which we calculated an enhancement of 3 × 10³ for the band at 450 cm−1, that decreases to 1 × 10³ for the 1620 cm−1 mode. Notably, the SERS gain G is smaller than the actual SERS enhancement factor, defined as  [39], by a factor NREF/NSERS related to the different number of molecules probed in the SERS (NSERS) and the reference (NREF) measurements. The factor NREF/NSERS is typically much higher than one since the molecules experiencing SERS are those located in the nanometric hot spots excited by the laser spot, i.e., much less than the number of total molecules illuminated by the laser spot itself.

Figure 3. SERS gain calculated for 515, 532, 633, 660, 691, and 785 nm excitation wavelengths. The colored circles are the intensities of the principal vibrational Raman modes of MB occurring in the range between 450 and 1620 cm−1. SERS measurements on the NPs are carried out with the following powers and integration times (slits width 100 μm, 1 accumulation): P515 = 40 μW, T515 = 120 s; P532 = 12 μW, T532 = 30 s; P633 = 0.6 μW, T633 = 120 s; P660 = 5.3 μW, T660 = 30 s; P691 = 1.1 μW, T691 = 10 s; P785 = 4 μW, T785 = 30 s. Raman measurements on the Au patch are carried out with the following powers and integration times (slits width 100 μm, 1 accumulation): P515 = 400 μW, T515 = 120 s; P532 = 120 μW, T532 = 60 s; P633 = 60 μW, T633 = 30 s; P660 = 530 μW, T660 = 30 s; P691 = 110 μW, T691 = 30 s; P785 = 4 mW, T785 = 30 s.
Download figure:
Standard image High-resolution imageMore insight on the mode-selective SERS amplification, and therefore on the re-radiation enhancement, is obtained comparing the ratios  between the high and the low energy vibrational modes of MB measured in SERS (spectra in figure 4, colored lines) and in Raman (black lines) as a function of the main excitation wavelengths (515, 633, and 785 nm). The results are summarized in table 1.

Figure 4. SERS spectra of MB deposited on the NPs (colored lines) with excitation at 515 (a), 633 (b), and 785 nm (c) compared with the respective Raman spectra (black lines) acquired on MB deposited on a flat gold film (Au patch). Power and integration times are the same as reported in the caption of figure 3. The SERS and reference spectra at each wavelength are normalized to the same experimental conditions, so the intensities can be directly compared. The SERS intensities at different wavelengths cannot be directly compared because of the different laser power, exposure times, spot size, and spectrometer response.
Download figure:
Standard image High-resolution image
Table 1.
Comparison of the  ratios as a function of the excitation wavelength in Raman and SERS.

|
Raman | SERS | ηSERS/ηRAMAN |
|---|---|---|---|
| 515 nm | 3.8 | 9 | 2.37 |
| 633 nm | 1.2 | 1.8 | 1.5 |
| 785 nm | 0.5 | 0.27 | 0.54 |
The intensity ratios  intrinsic to the MB molecules and measured in the Raman reference spectra, are modified in the SERS spectra. At 515 nm, the 1620 cm−1 mode is more amplified than the band at 450 cm−1 of a factor
  At 633 nm, this selective amplification is reduced to 1.5. At 785 nm, the opposite is observed, with a selective amplification of the band at 450 cm−1 with respect to the 1620 cm−1 peak by a factor 1.85. This phenomenon can be assumed as a signature of the different re-radiation experienced by the Raman modes as the excitation is changed.
Indeed, Wokaun's rule is not verified on our randomly distributed gold NP arrays, no matter if we consider the bare NPs LSPR profile or the MB-induced red-shifted one. Maximum SERS enhancement is observed for excitation at 785 nm, i.e., at a wavelength red-shifted by more than 160 nm with respect to the peak of the LSPR profiles. For what concerns the different (re-radiation) enhancement of the SERS modes, the experimental results at 515 nm (higher amplification of the 1620 cm−1 mode) and 785 nm (higher amplification of the 450 cm−1 mode) are in agreement with what is expected from the LSPR profiles. Conversely, the trends at 633 and 660 nm (higher amplification of the 1620 cm−1 mode) and 691 nm (equal amplification) are opposite to what is expected from Wokaun's rule. Surprisingly the trend of the SERS gain shown in figure 3 and of the selective mode enhancement (figures 3 and 4) qualitatively agrees with the wavelength dependence of the scattering spectrum reported in figure 2(c, blue line), peaked at 750 nm. Indeed, both the laser wavelengths tuned at 515 and 633 nm excite the ascending part of the scattering profile, while the NIR excitation matches its maximum. Furthermore, the SERS intensity re-radiated by the NPs in the visible range increases for the highest frequency Raman modes of MB and for the highest excitation wavelengths (from 515 to 691 nm), while an opposite trend is verified in the near-infrared for the excitation at 785 nm. Our findings therefore suggest that the scattering could provide useful information for the optimization of the SERS efficiency in randomly distributed metal NPs, with the advantage of being a quantity easily measurable in the far-field.
Discussion
Our experiments show that for a dense array of metal NPs with a silica shell layer: (i) the SERS maximum enhancement is observed at an excitation wavelength red-shifted by 160 nm with respect to the extinction peak; (ii) the vibrational modes of the probe molecule experience a selective intensity enhancement, which is wavelength dependent and cannot be explained using the extinction profile to account for the re-radiation effect; and (iii) the scattering of the sample is red-shifted with respect to the extinction and qualitatively describes the findings relative to the SERS signal. Red-shift effects between the excitation energy yielding maximum plasmonic enhancement and the energy of the plasmon resonance (peak of the extinction spectrum) are typically attributed to a spectral red-shift of the near-field (the local field acting on the molecules) with respect to the far-field radiation (detected in the extinction spectrum). Several models have been developed [22–27] to understand such phenomena, which are, however, still controversial in their physical nature. Messinger et al [22], working in the T-matrix formalism, attribute the red-shift to the different spectral behavior of the radial component of the electromagnetic field, prevalent in the near-field, with respect to the transverse component that is detected in the far-field. Zuloaga and Nordlander explained the energy shift between the near- and far-field intensities with a damped harmonic oscillator model, showing that an energy shift has to be universally expected whenever some damping is present in the system [27]. Moreno et al [40] interpreted this phenomenon in terms of an increased contribution of evanescent-to-propagating plane-wave components of the scattered field, as one moves from the far-field to the near-field region. Such a phenomenon, indeed, would qualitatively support our observations in terms of red-shift between the excitation yielding maximum SERS and LSPR peak position. The main controversial issue with these models is, however, the difficulty to experimentally prove that such a near-field shift exists also in the visible–NIR range. In addition, all the theoretical models have been developed for individual NPs and nothing is known about strongly coupled systems such as ours. While we cannot exclude that red-shift phenomena do contribute to our experimental findings, in this article we want to point out that for strongly interacting systems some alternative/complementary information can be found comparing the SERS enhancement with the scattering spectrum (a far-field quantity).
Recent experiments [21] carried out on inhomogeneous core–shell nanostructures made of 10–20 nm particles covered with thin silica shells, aggregated to form 100–150 nm diameter structures, show results very similar to ours, with extinctions peaked at 650 nm and maximum SERS measured for excitation between 750 and 850 nm, depending on the cluster size. The same authors were able to retrieve the scattering cross-section from independent photo-acoustic absorption measurements, and show 50–100 nm red-shifts of the scattering with respect to the extinction, dependent on the particle's size. The explanation of this latter issue is also controversial. Indeed, for single non-interacting NP Mie scattering predicts that the extinction scales with the particles' volume while the scattering is expected to scale with the square of the volume. As also calculated by us, the extinction of small particles with diameters smaller than 50 nm is dominated by the absorption contribution, whereas scattering becomes prevalent for 80 nm or larger diameters. In such a case, however, the extinction spectrum shows both a red-shifted dipolar mode and the non-shifted quadrupolar mode, which is indeed not our case. When small particles become strongly interacting, the situation is quite different. Experiments carried out on 30 nm Ag clusters in a glass matrix [41] have shown depleted scattering in correspondence with the dipolar and quadrupolar absorption, with a marked red-shift (>90 nm) with respect to the extinction peak. High order extinction processes [42], such as double scattering followed by absorption or triple scattering followed by absorption, have been invoked to justify this trend. Red-shifts between extinction and scattering are also reported on clusters of 10 nm diameter Au NPs [43] although in this case the shift is strongly dependent on the filling factor and on the diameter of the NPs. Considering the nanometric dimensions of the gaps among adjacent NPs it is reasonable to assume our sample as an extended cluster of NPs with optical properties similar to the ones reported in the previously cited articles. High order extinction scattering due to multiple scattering process could, therefore, justify the red-shift between extinction and scattering. On the other hand, our findings suggest that the re-radiation effect in SERS could be better described by using information from the scattering spectrum, rather than the extinction one, i.e.

where Qscatt(λR) is the scattering cross section.
Conclusions
We have carried out SERS experiments at variable excitations from the visible wavelengths to the NIR, on dense arrays of gold NPs covered with a thin silica shell. The measurements evidence maximum SERS amplification with excitation in the NIR (785 nm), whereas the maximum extinction is found at 620 nm. The red-shift of the LSPR induced by the adsorption of the MB on the NPs is not sufficient to justify the experimental findings, in the light of the E4 model. Unexpectedly, the scattering spectrum is observed to be maximum in the NIR and capable of qualitatively accounting for the large red-shift between the plasmon resonance and the excitation wavelength providing optimum SERS. Our findings are in agreement with recent experiments carried out on gold core–shell NPs. Further theoretical and experimental studies will be needed to establish the quantitative relation between the spectral dependence of the near-fields, the extinction, and the scattering for the determination of the SERS enhancement on nanoantennas with different morphologies and materials.
Acknowledgments
We greatly acknowledge financial support from MIUR under projects PRIN 2008J858Y7, PON01_01322 PANREX, from the EU under project FP7-HEALTH-F5-2009-241818-NANOANTENNA, and from the COST action MP1302 'Nanospectroscopy'.