
Abstract
Prostate cancer (PCa) is one of the most lethal cancers in men worldwide. The tumor microenvironment (TME) plays an important role in PCa development, which consists of tumor cells, fibroblasts, endothelial cells, and extracellular matrix (ECM). Hyaluronic acid (HA) and cancer-associated fibroblasts (CAFs) are the major components in the TME and are correlated with PCa proliferation and metastasis, while the underlying mechanism is still not fully understood due to the lack of biomimetic ECM components and coculture models. In this study, gelatin methacryloyl/chondroitin sulfate-based hydrogels were physically crosslinked with HA to develop a novel bioink for the three-dimensional bioprinting of a coculture model that can be used to investigate the effect of HA on PCa behaviors and the mechanism underlying PCa-fibroblasts interaction. PCa cells demonstrated distinct transcriptional profiles under HA stimulation, where cytokine secretion, angiogenesis, and epithelial to mesenchymal transition were significantly upregulated. Further coculture of PCa with normal fibroblasts activated CAF transformation, which could be induced by the upregulated cytokine secretion of PCa cells. These results suggested HA could not only promote PCa metastasis individually but also induce PCa cells to activate CAF transformation and form HA-CAF coupling effects to further promote PCa drug resistance and metastasis.
Export citation and abstract BibTeX RIS

Original content from this work may be used under the terms of the Creative Commons Attribution 4.0 license. Any further distribution of this work must maintain attribution to the author(s) and the title of the work, journal citation and DOI.
1. Introduction
Prostate cancer (PCa) is a common malignancy that has become the second leading cause of cancer death for men in the US, and one of the most commonly diagnosed cancers all over PCa is a common malignancy that has become the second leading cause of cancer death for men in the US and one of the most commonly diagnosed cancers worldwide [1, 2]. The 5 year survival rate for primary PCa in the US has been higher than 95%, while the cause of death is mainly from metastatic PCa, which has a 5 year survival rate of less than 30% and is gradually declining for elderly patients [3]. Approximately 90% of PCa metastases are to the bone [4], and others include lung and lymph node metastases. However, the metastatic mechanism of PCa cells is still poorly understood, which strongly restricts advances in PCa treatment.
The tumor microenvironment (TME) is the environment around tumor cells and consists of extracellular matrix (ECM), growth factors, immune cells, cancer-associated fibroblasts (CAFs), and blood vessels [5]. The TME has been shown to not only support tumor growth but also promote tumor development and metastasis [6]. The ECM is composed of various macromolecules that not only provide structural stability but also mediate cellular responses during PCa progression. Collagen is one of the abundant ECM components in PCa and bone structure, which is upregulated in PCa compared with benign prostate tissues and correlated with recurrence and distant metastases [7]. Chondroitin sulfate (CS) is a glycosaminoglycan that primarily occurs in the ECM as part of versican. Normal prostate tissue contains CS [8, 9], while it was overexpressed in primary PCa [8, 10] and further upregulated in metastatic PCa [11], suggesting that it may be a potential marker for poor PCa prognosis [12]. Hyaluronic acid (HA) is also a glycosaminoglycan that plays an important role in maintaining water, osmotic balance in tissues, and cellular behavior [13–15]. The deregulation of HA is also found in PCa, where a higher HA level was observed in PCa compared with normal prostate tissues, which is correlated with poor outcome [16–19]. In addition, HA could be a chemoattractant for PCa metastasis, since it is also highly expressed in bone, which is a typical metastatic target for PCa [20]. However, the mechanism underlying the effect of HA on PCa cellular behavior is not fully understood.
CAFs are one of the most common cell types in the TME and are phenotypically different from normal fibroblasts. Available evidence suggests that an increase in CAF quantity and overexpression of growth factors, such as platelet-derived growth factor (PDGF), transforming growth factor beta (TGF-β), and fibroblast growth factor 2 (FGF2), are associated with PCa drug resistance, neovascularization, and metastasis [21–23]. The paracrine interaction between cancer cells and fibroblasts has been shown to promote the activation of the CAF phenotype in PCa through the overexpression of TGF-β. [24] However, this mechanism is unlikely to be the only pathway that promotes CAF transformation; various inflammatory factors, such as interleukin-1 (IL-1) and interleukin-6 (IL-6), were also found to play a crucial role in CAF transformation. Therefore, the sources of CAFs and the molecular mechanism underlying the transformation of CAFs in PCa are not fully understood.
The molecular mechanism underlying cell‒cell interactions was mainly investigated through a coculture model, where cells were either seeded directly together or separately in Transwells [25, 26]. Due to the awareness of the importance of the TME in cancer progression, three-dimensional (3D) coculture models with various structures and biomaterial components were developed to create a microenvironment more analogous to their in vivo conditions. PCa cells could be cocultured with mesenchymal progenitor cells or osteoblasts on a hollow tube that was 3D printed with polycaprolactone (PCL) to investigate the PCa metastasis mechanism in a microenvironment that better mimics human bone [27–29]. Fibroblasts could also be seeded on an electro-written scaffold made with PCL for ECM deposition and then seeded with PCa cells for indirect coculture. However, the TME contains numerous chemical compositions and different types of cells, which could provide opposite or coupling effects on PCa progression. For example, the overexpression of HA [30] and CAF activation could promote angiogenesis, while the NC1 domains of basement membrane collagens have antiangiogenic functions [31, 32]. Additionally, the degradation of long ECM components caused by PCa cytokines could produce shorter fragments with distinct functions that can be pro- or antitumorigenic compared to the full-length ECM component [33]. Therefore, it would not provide a comprehensive understanding of the effect of individual TME components on PCa progression without considering others. To better understand the effect of the TME on PCa progression, it is necessary to develop an in vitro cell culture model that could closely mimic the microenvironment of the TME, which should meet the following requirements: (1) biomaterials used to mimic ECM components should contain various macromolecules to closely mimic the ECM compositions; (2) the compositions of biomaterials could be easily modified with limited influence on the material properties to better investigate the effect of individual ECM components; and (3) the in vitro cell culture model should closely mimic the structure and cellular distribution of the TME to better investigate the cell‒cell interaction.
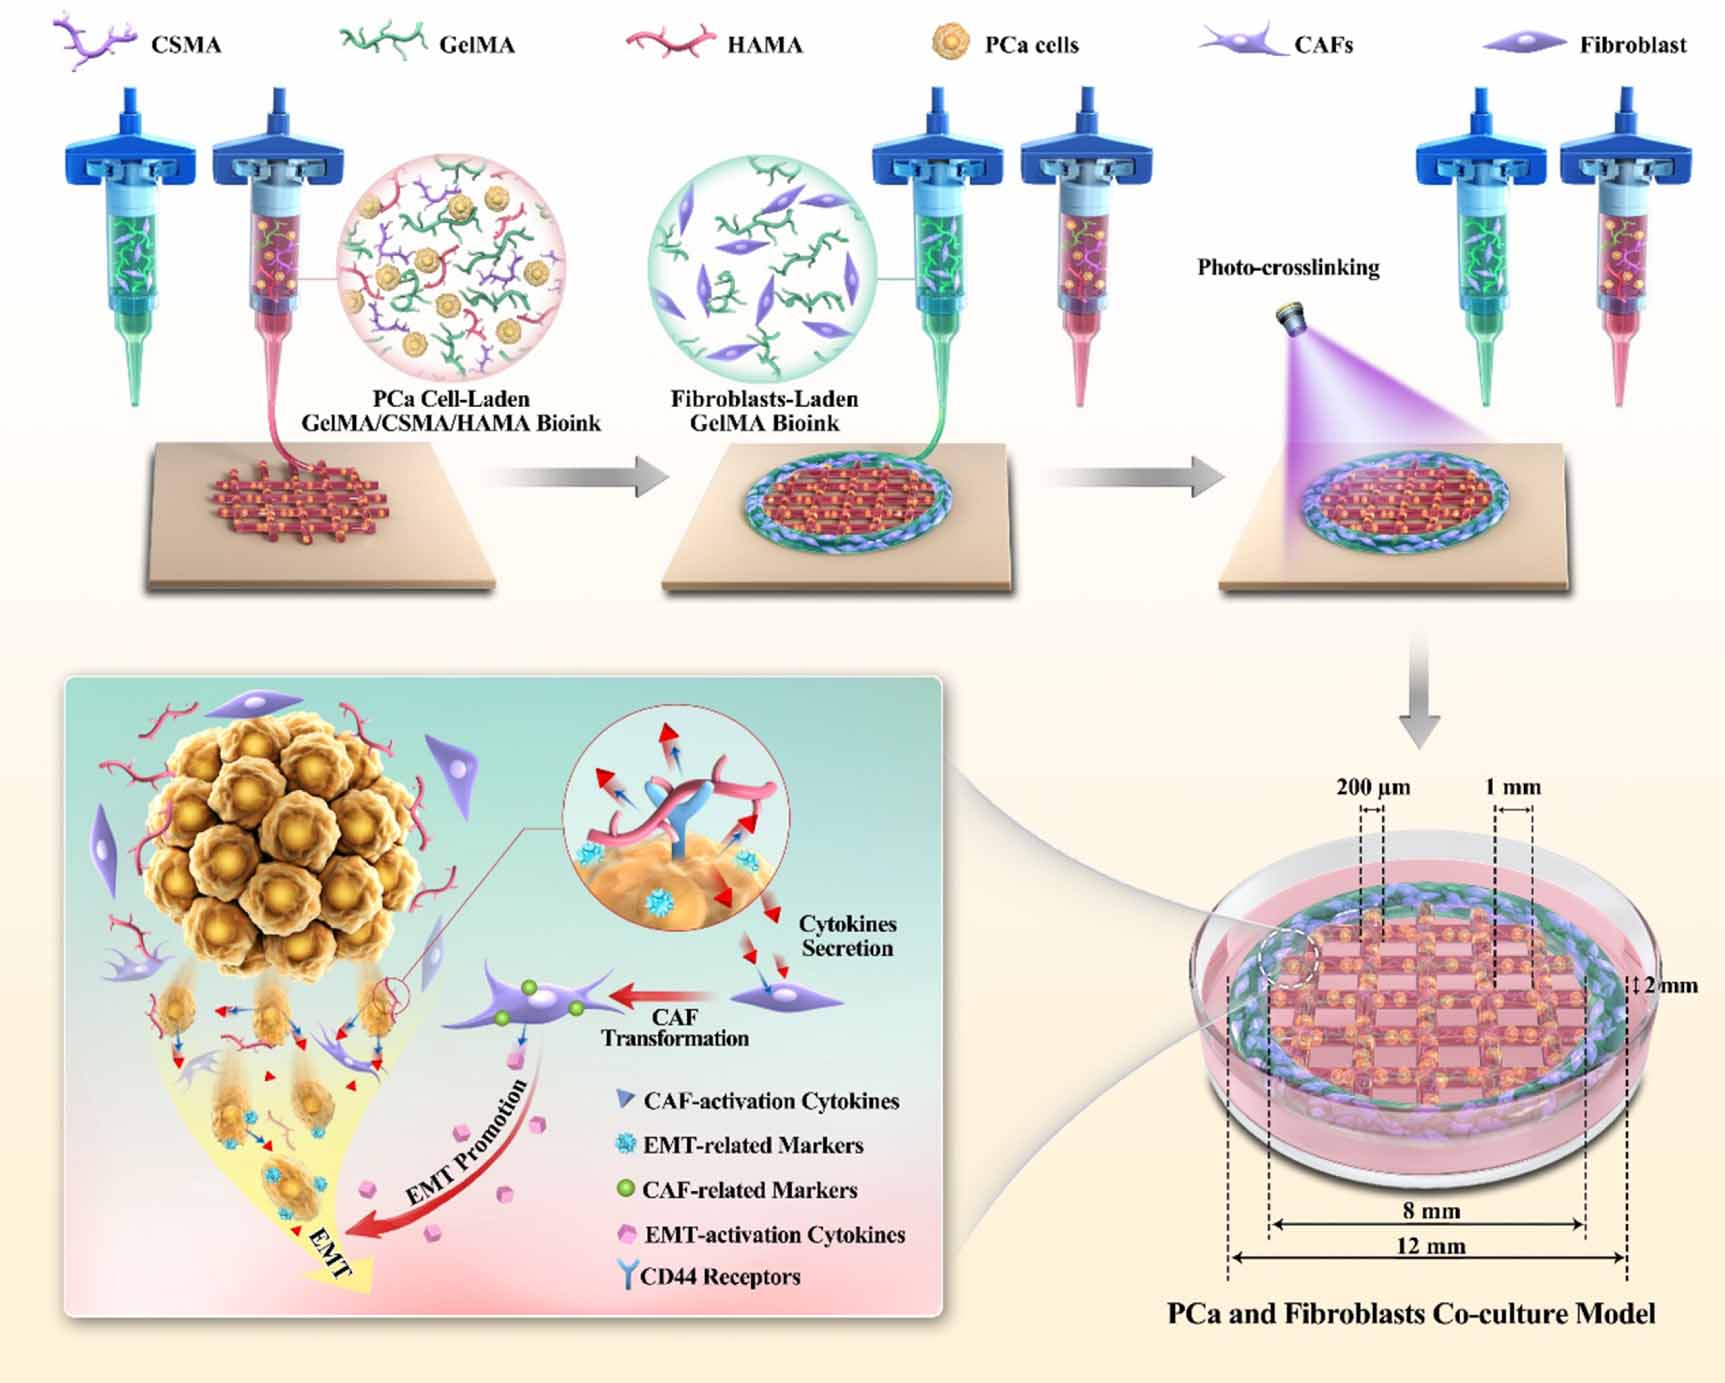
In this study, we developed a gelatin methacryloyl (GelMA)-based hydrogel with the inclusion of a constant CS-methacryloyl (CSMA) concentration (1%) and various HA-methacryloyl (HAMA) concentrations (0.1%, 0.5%, and 1%) to investigate the underlying mechanism of HA on PCa progression (figure 1). GelMA is a methacrylated gelatin, which retains collagen's high biocompatibility and cellular adhesion properties. The concentration of CSMA was constant since our previous study found that 1% CS could best promote PCa metastasis and drug resistance [34]. The material properties of all groups of mixed hydrogels were evaluated with viscosity tests, loss and storage module measurements, compression tests, swelling tests, scanning electron microscopy (SEM), and pore size measurements. The PCa cell lines, C4-2B and PC-3 were encapsulated in hydrogels, cultured for 7 d, and characterized with a cell counting kit-8 (CCK-8), live/dead assay, phalloidin staining, RNA sequencing (RNA-seq), western blotting and quantitative reverse transcriptase polymerase chain reaction (qRT‒PCR) to investigate the impact of HA on PCa cellular behavior and select a suitable HA concentration as a bioink for the 3D bioprinting of PCa and fibroblast coculture mode. Prostate is a compound tubuloalveolar gland, where the cancer cells were commonly surrounded by cancer stroma, including ECM and non-cancer cells. In this study, the PCa cells were bioprinted as a grid structure using the novel hydrogel in the middle, and fibroblasts were bioprinted to surround the PCa grid structure, which closely mimics the cellular distribution in the microstructure of the PCa TME (figure S1). The cocultured PCa cells and fibroblasts were characterized with enzyme-linked immunosorbent assay (ELISA), immunofluorescence (IF), qRT‒PCR, and drug resistance tests to investigate the reciprocal interaction between PCa cells and fibroblasts.

Figure 1. Schematic diagram of the 3D bioprinting process for PCa and fibroblast co-culture model.
Download figure:
Standard image High-resolution image2. Materials and method
2.1. Materials
Gelatin (porcine skin tissue 250 bloom, Type B) and methacrylic anhydride (MA) were purchased from Aladdin Industrial (Shanghai, China). Polydimethylsiloxane (PDMS) was purchased from Sylgard (Midland, MI, USA). The photoinitiator lithium phenyl-2,4,6-trimethylbenzoylphosphinate (LAP), CSMA, and HAMA were purchased from Engineering For Life (Suzhou, China). C4-2B, PC-3, and M-22 cells were purchased from Procell (Shanghai, China). Roswell Park Memorial Institute (RPMI)-1640, Ham's F-12K Medium, Dulbecco's modified Eagle medium/nutrient mixture F-12, penicillin/streptomycin (P/S), and 0.25% trypsin-ethylenediaminetetraacetic acid disodium salt (EDTA) were purchased from Gibco (Big Cabin, OK, USA). CCK-8 was purchased from Beyotime (Shanghai, China). The Live/Dead Viability Assay Kit, 4,6-diamidino-2-phenylindole (DAPI), paraformaldehyde (PFA), phosphate-buffered saline (PBS), radio immunoprecipitation assay (RIPA buffer, dimethylsulfoxide (DMSO) and phalloidin-fluorescein isothiocyanate isomer (FITC) were purchased from Solarbio (Beijing, China). All primers were synthesized by Sangon Biotech (Shanghai, China). Docetaxel (DTX) was purchased from MedChemExpress (Monmouth Junction, NJ). Optimal cutting temperature compound (OCT) was purchased from Sakura Finetek (Torrance, CA). All primary antibodies for IF staining were purchased from Cell Signaling Technology (MA, USA), and the secondary antibody was purchased from Abcam (Cambridge, UK). ELISA kits for TGF-β1, FGF2, IL-6, IL-1β, and tumor necrosis factor-α (TNF-α) were purchased from Multi Sciences (Hangzhou, China). TRIzol and Power SYBR Green PCR Master Mix were purchased from Life (MA, USA). The FastKing gDNA Dispelling RT SuperMix kit was purchased from Tiangen (Beijing, China). A BCA Protein Assay Kit was purchased from Thermo (MA, USA). Fetal bovine serum (FBS) was purchased from ExCell Bio (Shanghai, China). Primary antibodies against Slug, Snail 1, MMP-2, Zeb1, CD44, CDH1, CDH2, GAPDH, IL-1β, PDGF-A, PDGF-B, and TGF-β were purchased from Cell Signaling Technology (MA, USA).
2.2. Synthesis of GelMA
GelMA was synthesized by adapting a previously published method [35, 36]. Briefly, gelatin was dissolved in a buffer solution containing Na2CO3 and NaHCO3 at 50 °C under continuous stirring for 3 h until it completely dissolved. Next, various volumes (0.025/1 and 0.05/1) of MA were added dropwise into the gelatin solution to synthesize GelMA with various degrees of methacryloyl substitution (DMS, 30% and 50%, respectively). After reacting in the dark for 3 h, the samples were diluted five times with deionized water and dialyzed for 3 d at room temperature, with water changes three times per day. Finally, GelMA solutions were frozen at −80 °C, lyophilized for 3 d, and stored at −20 °C until further use.
2.3. Hydrogel preparation
Precursor solutions for CSMA (1%), HAMA (0.1%, 0.5%, and 1%), and GelMA (10% made with 30% DMS and 5% GelMA made with 50% DMS) were prepared separately by dissolving in a fully supplemented cell culture medium containing 0.5% LAP as a photoinitiator. GelMA precursor solutions (10% made with 30% DMS) were further added with a constant amount of CSMA (1%) and various amounts of HAMA to prepare a mixture solution, including 10% GelMA-1% CS-0.1% HA, 10% GelMA-1% CS-0.5% HA, and 10% GelMA-1% CS-1% HA. Each precursor solution was added to PDMS models (8 mm inner diameter, 2 mm thickness) and crosslinked with ultraviolet light (405 nm, 10 W cm−2) at a distance of 1 cm for 90 s to prepare a disc-like hydrogel for subsequent analysis.
2.4. Rheological properties
The rheological behaviors of all precursor solutions (n = 3 per group) were analyzed with a HAAKE MARS iQ Air rheometer (Thermo Scientific, Waltham, MA) using a plate geometry with a diameter of 25 mm for all measurements. The rotational viscosity-shear measurements were performed with shear rates from 0.1 to 100 1 s−1 under 18 °C within 5 min. The influence of temperature (4 °C–35 °C) on the viscosity of all samples was measured under a constant shear rate of 1 1 s−1 within 30 min. The influence of temperature (4 °C–35 °C) on the storage (G') and loss (G'') modules of all samples was measured under a constant shear stress of 1 Pa and a frequency of 1 Hz within 30 min.
2.5. Swelling test
The hydrogels (n = 5 per group) for all groups were immersed in fully supplemented media and incubated at 37 °C and 5% CO2 for 5 d. The diameters were measured after 0, 0.5, 1.5, 4, 6, 24, 48, 72, and 120 h using a digital micrometer (Deli, Ningbo, China). The measurements were normalized to the diameter at 0 h to provide scaled diameter values.
2.6. Mechanical characterization
The mechanical properties of disc-like hydrogels (n = 5 per group) with a diameter of 8 mm and a thickness of 2 mm were characterized by compression testing. The hydrogels were placed between two parallel plates and compressed at a rate of 0.5 mm min−1 to 50% of the initial height using an AGS-X mechanical tester (Shimadzu, Japan) with a 50 N load cell. The compressive modulus was calculated as the slope of the linear region in the 0%–30% strain range of the stress–strain curves.
2.7. SEM imaging
The pore structures for all groups were observed using SEM (Phenom Pro, the Netherlands). For this purpose, disk-like hydrogels (n = 3 per group) were frozen at −20 °C overnight and lyophilized with a freeze dryer (DYYB-10, Shanghai Deyangyibang Instruments, Shanghai, China) for 12 h. Before observation, the dried samples were mounted on stubs, sputter-coated with gold for 1 min using an ion sputter coater (ISC 150, Supro Instrument, NY, USA), and imaged with SEM (Phenom Pro).
2.8. Pore size measurement
The pore size for 10% GelMA-1% CS-0.1% HA, 10% GelMA-1% CS-0.5% HA, and 10% GelMA-1% CS-1% HA was measured with SEM images at 250× magnification using a modification of ASTM standard E112-13 to determine the average grain size. A template of 5 parallel lines spanning the SEM images with 18 mm spacing was used. The line length was calibrated to microns using the SEM image scale bar. The number of pores intersected by the lines was counted, and the line length was divided by the number of pores to quantify the pore size. The average pore size was calculated from five lines per image (n = 5 per group) for a total of 25 measurement lines per composition.
2.9. Cell culture
PC-3, C4-2B, and fibroblast cells were cultured in F-12K, RPMI-1640, and DMED/F-12 media, respectively, supplemented with 10% FBS and 1% P/S. Cells were maintained at 37 °C in 5% CO2, and cells in the log phase of growth and within passages P1–P10 were used for experiments.
2.10. Cellular encapsulation
Precursor solutions, including 5% GelMA (50% DMS), 10% GelMA (30% DMS), 10% GelMA-1% CS-0.1% HA, 10% GelMA-1% CS-0.5% HA, and 10% GelMA-1% CS-1% HA, were prepared as mentioned above and sterilized through a 0.22 µm filter. At 70% confluence, PC-3, C4-2B, and fibroblast cells were detached by adding 0.25% trypsin-EDTA, centrifuged at 1000 rpm for 5 min, and then resuspended in precursor solutions with a final cell density of 1 × 10⁶ cells ml−1. Immediately, the cell suspension was added to PDMS models (8 mm inner diameter, 2 mm thickness) and crosslinked with ultraviolet light (405 nm, 10 W cm−2) at a distance of 1 cm for 90 s. All samples were transferred into 24-well tissue culture plates and maintained at 37 °C in 5% CO2, and the medium was replaced every other day.
2.11. Live/dead assay
A fluorescence live/dead assay was performed based on the manufacturer's protocol at Day 5 to determine the viability of fibroblast cells encapsulated in 5% GelMA (50% DMS) and 10% GelMA (30% DMS) and PC-3 and C4-2B cells encapsulated in 10% GelMA-1% CS, 10% GelMA-1% CS-0.1% HA, 10% GelMA-1% CS-0.5% HA, and 10% GelMA-1% CS-1% HA. First, the samples were rinsed with 1× assay buffer from the kit three times and then incubated with 500 µl working solution (0.5 µM calcein-AM and 1.5 µM PI) for 15 min in the incubator. Then, the stained samples were washed twice with 1× assay buffer and imaged immediately using a confocal microscope (Nexcope, Ningbo, China).
2.12. Cellular proliferation analysis
A CCK-8 assay was performed to examine PC-3, C4-2B, and fibroblast cellular proliferation in hydrogels at Days 1, 3, 5, and 7. According to the manufacturer's protocol, 10 v/v% CCK-8 working solution was prepared with fully supplemented media. Cell-laden hydrogel (n = 3) was transferred into a new 24-well plate to avoid the effect of cells attached to the bottom of the plate. The PCa grid structures in the middle of the 3D bioprinted coculture model were punched out using an 8 mm diameter biopsy punch (Integra Miltex, Plainsboro, NJ) to avoid the influence of fibroblasts. CCK-8 working solution was added and incubated for 1 h. Then, the CCK-8 working solution was transferred into a 96-well plate for fluorescence reading at 450 nm. The cellular proliferation rate at each time point was evaluated by normalizing to the absorbance measured on Day 1.
2.13. Filament fusion test
The printability was analyzed with a filament fusion test by adapting a previously published method [37, 38]. The printing model follows a 0°–90° pattern, which captures the two-dimensional (2D) effect and increases the filament-to-filament distance (figure S2(a)). The range of filament-to-filament distance used was 1.5–4 mm with 0.5 mm increments. Ten percent GelMA-1% CS and 10% GelMA-1% CS-0.1% HA were printed at various temperatures, including 18 °C, 20 °C, and 22 °C, while 0.1% HA, 0.5% HA, 1% HA and 1% CS were printed at a constant temperature of 10 °C (n = 5 per group). The images of the printed pattern were taken with a ZK4A08MTP high-resolution camera (SANOTID, Shenzhen, China) immediately after printing to avoid unwanted spreading. The percentage of diffusion rate (Dfr) was calculated using equation (1) as shown below,
where At and Aa are the theoretical and actual areas of pores, respectively. The Aa was measured with NIH ImageJ. For a perfect square pore, Dfr is 0, and At = Aa, suggesting that there is no material spreading.
2.14. Cubic ratio analysis
Cubic ratio analysis was performed by printing the grid structure using 10% GelMA-1% CS and 10% GelMA-1% CS-0.1% HA at 20 °C (n = 10 per group), which could present the printability of the bioink. Images were taken immediately after printing to avoid unwanted spreading using an optical microscope (AZ100, Nikon, Japan), and cubic ratio (Pr) was calculated using equation (2), as shown below,
where L is the perimeter and A is the area of the printed square shape. L and A were measured with NIH ImageJ. For an ideal printability status, for an ideal printability status, the interconnected channels of printed constructs should demonstrate a perfect square shape, and the Pr value is 1 (figure S2(b)). The larger the Pr value is, the greater the gelation degree of the bioink.
2.15. Extrusion swelling analysis
The extrusion swelling ratio for 10% GelMA-1%CS and 10% GelMA-1% CS-0.1% HA (n = 10 per group) was analyzed using various nozzle sizes, including 20 G, 22 G, 24 G, 26 G, and 28 G, at 20 °C and calculated using equation (3) as shown below,
where Dn is the inner diameter of the nozzle used and Da is the actual diameter of the extruded filament, which was measured with NIH ImageJ.
2.16. PCa and fibroblast coculture model development
LB119 3D bioprinter (MEDPRIN, Guangzhou, China) was used to produce the PCa-fibroblast coculture models. The bioprinter cavity was wiped with 75% ethanol and sterilized with UV light for 30 min before cell-laden bioprinting, and the internal circulation system with a HEPA filter was turned on during printing. Cellular suspensions: fibroblasts in 5% GelMA and PCa cells in 10% GelMA-1% CS and 10% GelMA-1% CS-0.1% HA were prepared as mentioned previously and loaded in a 1 ml syringe. A circular grid structure encapsulated with PCa cells was printed with a diameter of 8 mm, thickness of 1 mm, and filament distance of 500 µm using a 24 G nozzle at 20 °C. The 5% GelMA-containing fibroblast cell was bioprinted to a circular structure along the PCa grid with an inner diameter of 8 mm and an outer diameter of 12 mm using a 24 G nozzle at 18 °C. The bioprinted coculture model was crosslinked with ultraviolet light (405 nm, 10 W cm−2) at a distance of 1 cm for 90 s. All samples were transferred into 6-well tissue culture plates and maintained at 37 °C in 5% CO2, and the medium was replaced every other day.
2.17. RNA extraction
The RNA of all cells was harvested using TRIzol (Life, Waltham, MA, USA), mixed with chloroform, and then washed once with isopropanol and twice with 75% ethanol. The extracted RNA was finally dissolved in RNase-free water, and the concentration was measured using a Nanodrop (Thermo Scientific, Waltham, MA, USA).
2.18. RNA-seq and data analysis
RNA integrity was assessed using the Agilent 2100 Bioanalyzer (Agilent Technologies, CA, USA). Then, the libraries were constructed using the VAHTS Universal V6 RNA-seq Library Prep Kit according to the manufacturer's instructions. Transcriptome sequencing and analysis were conducted by OE Biotech Co., Ltd (Shanghai, China). The libraries were sequenced on an Illumina NovaSeq 6000 platform, and 150 bp paired-end reads were generated. Approximately 50 raw reads for each sample were generated. Raw reads in fastq format were first processed using fastp, and the low-quality reads were removed to obtain clean reads for subsequent analyses. The clean reads were mapped to the reference genome using HISAT2. The FPKM of each gene was calculated, and the read counts of each gene were obtained by HTSeq-count. PCA was performed using R (v 3.2.0) to evaluate the biological duplication of samples. Differential expression analysis was performed using DESeq2. A Q value ⩽ 0.05 and fold change ⩾ 2 or fold change ⩽ 0.5 were set as the thresholds for significantly differentially expressed genes (DEGs). Hierarchical cluster analysis of DEGs was performed using R (v 3.2.0) to demonstrate the expression pattern of genes in different groups and samples. Based on the hypergeometric distribution, gene ontology (GO) pathway enrichment analysis of DEGs was performed to screen the significantly enriched terms using R (v 3.2.0). R (v 3.2.0) was used to draw the column diagram, chord diagram and bubble diagram. Gene set enrichment analysis (GSEA) was performed using GSEA software. The analysis used a predefined gene set, and the genes were ranked according to the degree of differential expression in the two types of samples. Then, we tested whether the predefined gene set was enriched at the top or bottom of the ranking list.
2.19. Real-time PCR
The extracted RNA was synthesized with complementary DNA (cDNA) using the FastKing gDNA Dispelling RT SuperMix kit according to the manufacturer's protocol. Relative gene expression analysis was conducted using real-time PCR (Roche, Basel, Switzerland). Power SYBR Green PCR Master Mix was mixed with 20 ng cDNA and the specific primers (table S1) in a total volume of 10 µl.
2.20. Enzyme-linked immunosorbent assay (ELISA)
The levels of TGF-β1 and FGF2 protein expression in fibroblast cells and the levels of IL-6, IL-1β, and TNF-α in PCa cells were measured using ELISA based on the manufacturer's protocol. The supernatants of fibroblast cells 5% GelMA and 10% GelMA-1% CS, along with the supernatants of PCa cells in 10% GelMA-1% CS and 10% GelMA-1% CS-0.1% HA, were collected at 5 d and analyzed using a microplate reader (Molecular Devices, SpectraMax iD3, San Francisco, CA, USA).
2.21. DTX drug responses
The PCa grid structures in the middle of the 3D bioprinted coculture model were punched out using an 8 mm diameter biopsy punch (Integra Miltex, Plainsboro, NJ) at 7 d and transferred to a new 24-well culture plate, and a 3D bioprinted monoculture model of PCa cells was used as a control group. For 2D cultures, cells (10 000/well) were seeded after 6 d of scaffold culture to avoid over confluency. The cultures were treated with DTX at 7 d: PC-3 cultures were treated with 60 nM DTX, and C4-2B cultures were treated with 10 nM DTX using DMSO as the vehicle (n = 5 per group). The DTX concentrations were determined to induce cytotoxicity in 2D cultures during preliminary testing. Fully supplemented media containing DMSO only was added to vehicle control samples (n = 5 per group). Cell number was evaluated with a CCK-8 assay after 48 h of drug treatment, and viability was determined by evaluating sample cell number relative to vehicle cell number for 2D and 3D cultures.
2.22. IF staining
PCa cultures at Day 7 were punched out using an 8 mm diameter biopsy punch as mentioned previously, transferred to a new 24-well culture plate, fixed in 4% PFA at room temperature for 2 h, and washed three times with PBS. A 3D bioprinted monoculture model of PCa cells was used as a control group. Then, samples were subsequently soaked in 20% sucrose solution, 30% sucrose solution, and 30% sucrose solution-OCT mixture (1:1), each for 24 h. Finally, samples were embedded in OCT, frozen at −20 °C for 1 h, cut into slices with a thickness of 8 μm using a CM1860 cryostat microtome (Leica, Germany), and affixed onto slides. The samples were washed three times with PBS before permeabilizing with 0.2% Triton X-100 for 15 min and blocking with blocking buffer for 2 h at room temperature. Rabbit anti-human Slug (1:200), Snail 1 (1:200), MMP-2 (1:200), ZEB1 (1:400), CD44 (1:200), CDH1 (1:400), and CDH2 (1:200) primary antibodies were used. After overnight incubation at 4 °C, the samples were washed with PBS and stained with goat anti-rabbit IgG (1:400) secondary antibodies for 2 h at room temperature. After washing three times with PBS, cell nuclei were stained with DAPI. Samples were imaged by confocal microscopy, and the fluorescence intensity was evaluated using NIH ImageJ.
2.23. Western blotting
PCa cultures at Day 7 were lysed in ice-cold RIPA buffer for 30 min and centrifuged at 12 000 RPM for 30 min, and the resulting supernatant cell lysates were collected. Protein concentrations were determined using a BCA Protein Assay Kit with bovine serum albumin (0.5 mg ml−1) as a standard. The total protein of each group (40 µg) was separated by polyacrylamide gel electrophoresis under reducing conditions, followed by transfer onto polyvinylidene fluoride membranes, blocking at room temperature with nonfat milk for 2 h, and overnight incubation at 4 °C with primary antibodies, including rabbit anti-human GAPDH (1:1000), CD44 (1:1000), IL-1β (1:1000), PDGF-A (1:1000), PDGF-B (1:1000), and TGF-β (1:1000). Next, HRP-linked goat anti-rabbit secondary antibodies (1:5000) were added as appropriate for 1 h at ambient temperature. The Clarity Western ECL Substrate detection solution (BIO-RAD, CA, USA) was used for visualization. The western blotting results were further quantified with ImageJ and normalized to GAPDH expression.
2.24. Statistical analysis
Unless otherwise mentioned, all results were analyzed using GraphPad 8.02. All experiments were performed in triplicate. Data are expressed as the mean ± standard deviation. T test analysis of variance was used for all data. A p value of <0.05 was considered to indicate a statistically significant difference, and *p < 0.05, **p < 0.01, ***p < 0.001.
3. Results
3.1. Material characterizations
The preliminary results suggested that PCa cells had a higher proliferation rate in 10% GelMA (30% DMS) than in 5% GelMA (50% DMS) (figures S2(c)–(g)), leading to the use of 10% GelMA (30% DMS) for the following experiments. HAMA and CSMA can hardly be used as bioinks individually due to their weak printability, low viscosity, slow photogelation rate, and high swelling rate (figure S3). Therefore, HAMA and CSMA were physically crosslinked with 10% GelMA (30% DMS) for four compositions, including 10% GelMA-1% CS, 10% GelMA-1% CS-0.1% HA, 10% GelMA-1% CS-0.5% HA, and 10% GelMA-1% CS-1% HA, to investigate the effect of HA on PCa cellular behavior and used as bioink for the 3D bioprinting of PCa and fibroblast coculture mode. The composition for CS was constant for all groups since our previous study found that 1% CS was an ideal concentration that could significantly promote PCa cellular proliferation and epithelial to mesenchymal transition (EMT) marker expression [34].
The appearances of all precursor solutions are shown in figure S4(a). The viscosity of precursor solutions under different temperatures and shear rates were significantly increased through the inclusion of 0.1% HA (figures 2(a) and (b)) and further increased after adding more HA (figures S4(b) and (c)). The storage and release moduli were measured for all precursor solutions, which showed that all compositions could undergo gelation at approximately 20 °C (figures 2(c) and S4(d)). All compositions were photocured to form hydrogels, and the stability was analyzed using swelling tests, which indicated that all compositions of hydrogels maintained their dimensions without deformation or visible degradation over 5 d, suggesting that the stability of all hydrogels is promising for PCa cell culture (figures S4(e) and (f)). The compressive modulus and pore size measurements were performed for all compositions of hydrogels (figures S4(g)–(i)). The inclusion of 0.1% HA had limited influences on the hydrogel compressive modulus and pore size, while the inclusion of 0.5% and 1% HA significantly increased the hydrogel compressive modulus and decreased the pore size.
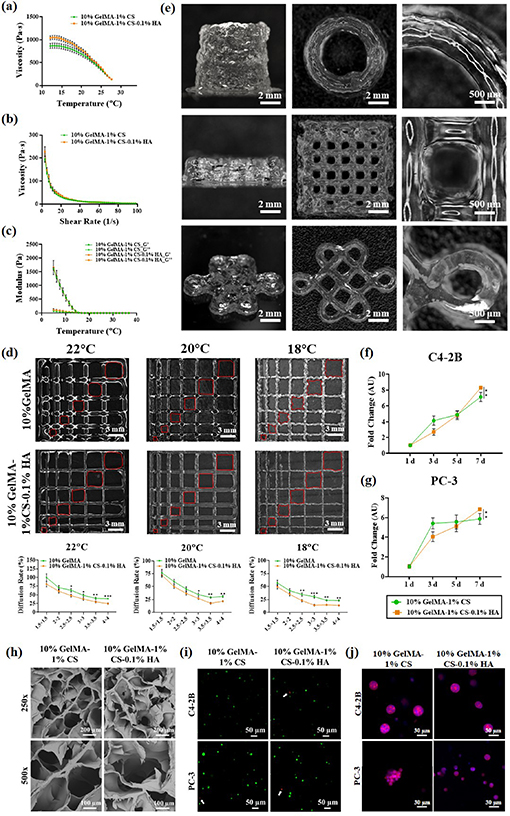
Figure 2. Physical and biological characterizations of hydrogels. (a) Hydrogel viscosities under various temperatures; (b) hydrogel viscosities with various shear rates; (c) hydrogel storage and loss modulus under various temperatures; (d) filament fusion test and diffusion rate; (e) extrusion printing of complicated structures using 10% GelMA-1% CS-0.1% HA; (f)–(g) PCa cellular proliferation rate at Days 1, 3, 5, and 7 in various compositions of hydrogels; (h) interconnected pore structure of various compositions of hydrogels; (i) live/dead assay. White arrows were used to indicate dead cells; (j) PCa cellular morphology in various compositions of hydrogels.
Download figure:
Standard image High-resolution imageThe printability of 10% GelMA-1% CS-0.1% HA was further analyzed and compared with that of 10% GelMA-1% CS to evaluate the potential for use as a bioink. To evaluate the effect of filament fusion and pore closure for each hydrogel, both compositions were printed with designed pore sizes under various temperatures (figure 2(d)). The diffusion rate was quantified, where the addition of 0.1% HA resulted in a significantly lower diffusion rate for all pore sizes at 18 °C, 20 °C, and 22 °C, suggesting a more stable pore structure. Although both hydrogels had the lowest diffusion rate at 18 °C, the printed filament had a zigzag structure rather than a smooth straight line similar to that at 20 °C, which made 20 °C more suitable for the following experiments. Further extrusion swelling analysis and cubic ratio evaluation also suggested that the inclusion of 0.1% HA could better promote hydrogel printability (figures S5(a)–(d)). The 10% GelMA-1% CS-0.1% HA was further used to print a more complicated structure to evaluate the printability, including a 5-layered Chinese knot with a size of ≈10.5 × 10.5 × 1 mm3 (wall thickness: 0.4 mm), a 15-layered thin-wall hollow tube with a diameter of ≈3.5 mm along with a height of 10 mm (wall thickness: 0.4 mm), and a 10-layered mesh cube with a size of ≈7.5 × 7.5 × 6 mm3 (wall thickness: 0.4 mm; strand distance: 0.2 mm). The side, top, and close views of all these structures are shown in figure 2(e), suggesting that 10% GelMA-1% CS-0.1% HA could be used as a bioink for complicated structure production with high resolution.
The biocompatibility of the four hydrogels was further analyzed through PC-3 and C4-2B cell culture for 7 d. The CCK-8 assay was also used to determine the cellular proliferation rate of PC-3 and C4-2B cells (figures 2(f) and (g)), where both cells had the highest cellular proliferation rate in the hydrogel containing 0.1% HA at Day 7, while the cell proliferation was significantly decreased after adding more HA (figures S5(f) and (g)), indicating that HA could promote cellular growth at low concentrations while inducing cellular death at high concentrations, which could due to the higher mechanical properties that physically hinder the cellular proliferation and also the smaller pore size that restricted the nutrition transferring.
The cellular viability was analyzed using a Live/Dead assay. There were almost no dead cells observed in hydrogels containing 0.1% HA (figure 2(i)), while more dead cells were observed in hydrogels with higher HA concentrations (figure S5(h)), which was also verified by live cell quantification (figure S5(i)). The cellular morphology of PC-3 and C4-2B cells was determined using phalloidin staining from Days 1–7 (figures 2(j) and S5(j), (k)), where both cells formed spheroids throughout the culture, while no significant differences were observed in spheroid size.
Therefore, these results suggested that 10% GelMA-1% CS-0.1% HA could be an ideal bioink to investigate the effect of HA on PCa cellular behavior and could also be used as a bioink for the 3D bioprinting of PCa and fibroblast cocultures.
3.2. Bioprinting of mono- and coculture models
The PCa cell and fibroblast coculture model was prepared as shown in figures 3(a)–(g), where PCa cell-laden (PC-3 or C4-2B) hydrogels (10% GelMA-1% CS or 10% GelMA-1% CS-0.1% HA) were used to bioprint a 5-layer grid structure in the middle, and the fibroblast-laden hydrogel (5% GelMA with 50% DMS) was used to bioprint the five-layer circular structure around the middle grid structure. The 5% GelMA (30% DMS) was used for fibroblasts since the pilot study suggested that fibroblasts showed more elongated morphology and a higher cellular proliferation rate in 5% GelMA (50% DMS) compared with 10% GelMA (30% DMS) (figures S2(e) and (f)). The appearance of the monoculture and coculture models were shown in figures 3(d) and (e). The PC-3 cells were stained with DiI cell labeling (red), and fibroblasts were stained with DiO cell labeling (green) before bioprinting for a clearer demonstration of the mono- and coculture system. As shown in figures 3(b) and (c), PC-3 cells only appeared inside the filament of the grid structure and were successfully separated from fibroblasts at the edge, suggesting that the coculture model could be used to investigate the mechanism underlying PCa-fibroblast paracrine signaling. The surface structure of the coculture model was imaged with SEM (figure S5(e)), where both hydrogel compositions retained the interconnected pore structure after printing. The cellular viability of PC-3 and C4-2B cells after cell-laden bioprinting was also analyzed using a live/dead assay. Both PC-3 and C4-2B cells in either 10% GelMA-1% CS or 10% GelMA-1% CS-0.1% HA were alive after 5 d of culture (figure 3(f)), and the same results were also observed for the fibroblasts in 5% GelMA (figure 3(g)).
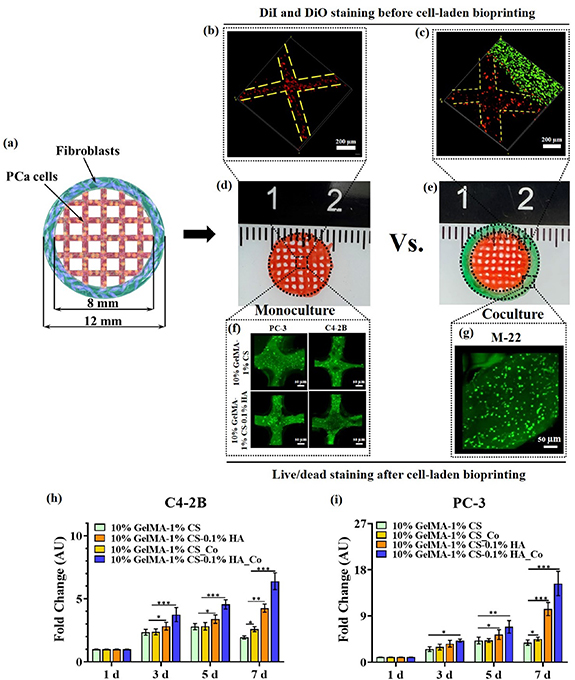
Figure 3. Bioprinting of PCa and fibroblast coculture model. (a)–(g) Coculture model and monoculture model developed with cell-laden bioprinting. PCa cells and fibroblasts were stained with DiI and DiO, respectively, before bioprinting for clear demonstration of cellular distribution. Live/dead assay was used to analyze the cellular viability for PCa cells after bioprinting; (h), (i) the cellular proliferation of PCa cells monocultured in 10% GelMA-1% CS and 10% GelMA-1% CS-0.1% HA, along with cocultured in 10% GelMA-1% CS and 10% GelMA-1% CS-0.1% HA.
Download figure:
Standard image High-resolution imageThe CCK-8 assay was further used to analyze PCa cellular proliferation in the cocultured model and then compared with the monoculture, which was the bioprinted grid structure without surrounding fibroblasts (figures 6(h) and (i)). Both PC-3 and C4-2B cells had a similar trend throughout the culture, where cells under monoculture in 10% GelMA-1% CS-0.1% HA still had higher proliferation than cells in 10% GelMA-1% CS monoculture or coculture, demonstrating that HA had a stronger promotion effect than fibroblasts. The proliferation rate for cells in 10% GelMA-1% CS-0.1% HA under coculture was the highest throughout the culture, suggesting that HA and fibroblasts had a coupling effect on cell proliferation.
3.3. PCa had distinct transcriptional profiles in 10% GelMA-1% CS-0.1% HA
Global transcriptome profiling of PCa cells bioprinted under monoculture in hydrogels with or without HA was performed through RNA-seq to investigate the impact of HA on the transcriptional signature of PCa cells. Principal component analysis revealed that the inclusion of HA drastically changed the transcriptional profile of PCa cells (figure 4(a)). A few proteins coding cancer-related genes or prognostic genes were significantly upregulated over ten-fold for C4-2B cells under HA stimulation, such as vitronectin, CCL5, fibrinogen gamma, SPINK1, Piezo2, and S100P (figure 4(b)). The upregulated cancer-related genes or prognostic genes for PC-3 cells in hydrogels containing HA were CD247, MAT1A, ADAM28, and ALDH3B2 (figure 4(c)).
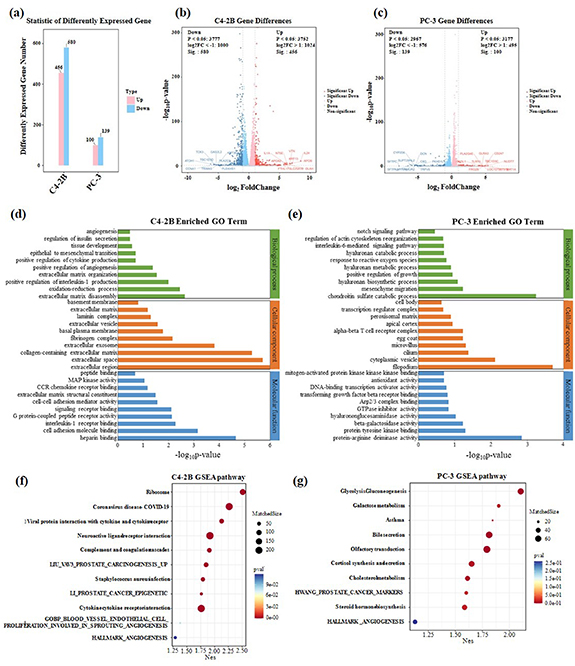
Figure 4. Distinct transcriptional profiles of PCa cells cultured in 10% GelMA-1% CS and 10% GelMA-1% CS-0.1% HA between the GBM sphere culture and 3D models. (a) Number of different genes determined; (b), (c) volcano plot of transcriptional landscape comparing C4-2B and PC-3 cells in different compositions of hydrogels. The x-axis represents log2 transformed fold change, and the y-axis shows the log transformed p value adjusted for multiple test correction; (d), (e) GO terms enriched for C4-2B and PC-3 cells in different compositions of hydrogels; (g), (h) the GSEA of C4-2B and PC-3 cells in different compositions of hydrogels.
Download figure:
Standard image High-resolution imageMoreover, GO enrichment analysis with RNA-seq was also performed to investigate the changes in biological processes, cellular components, and molecular functions of PCa cells (figures 4(d) and (e)). For C4-2B cells, the enriched GO terms involved in biological processes related to ECM remodeling, hypoxia-induced angiogenesis, cytokine secretion, and EMT were identified. The enriched GO terms involved in cellular components were mainly correlated with ECM reconstitution, such as collagen, fibrinogen, and laminin production. The enriched GO terms were involved in molecular functions that were correlated with cancer progression, such as mitogen-activated protein kinases (MAPK) activity, CCR chemokine receptor binding, and G protein-coupled peptide receptor activity. For PC-3 cells, enriched GO terms involved in biological processes such as mesenchyme migration, positive regulation of growth, and IL-1 production were identified. The enriched GO terms for molecular function were transforming growth factor beta receptor binding, antioxidant activity, and mitogen-activated protein kinase binding. Similarly, both PC-3 and C4-2B cells showed GO enrichment related to EMT, which was also verified with EMT-related gene expression using PCR (figures S6(a)–(g)).
GSEA was further applied to PCa cells (figures 4(f) and (g)). For C4-2B cells, the enriched gene sets were involved in LIU_vav3_prostate_carcinogenesis_up, LI_PROSTATE_CANCER_EPIGENETIC and angiogenesis-related gene sets. For PC-3 cells, the enriched gene sets were involved in HWANG_PROSTATE_CANCER_MARKERS and HALLMARK_ANGIOGENESIS. The enriched gene sets all have positive correlations with cancer cell proliferation, angiogenesis, migration, invasion, and drug resistance.
3.4. The promotion of PCa metastasis and drug resistance in a coculture model
The gene expression of EMT markers, including Snail 1, Slug, MMP-2, Zeb1, CD44, CDH1, and CDH2, along with cancer stem cell (CSC)-related genes, including Sox2, Nanog, and Oct4, was analyzed in PCa cells using qPCR at Day 7 and normalized to 2D cells (figures 5(a)–(g)). All 3D cultures had higher EMT-related and CSC-related gene expression than 2D cultures, indicating that 3D bioprinted culture models could better mimic the TME for PCa cells.

Figure 5. EMT-related marker expression in PCa cells under coculture and monoculture conditions. (a)–(j) EMT-related gene expression in PCa cells; (k), (l) EMT-related protein expression in PCa cells. Scale bar is 10 µm.
Download figure:
Standard image High-resolution imageFor both PCa cell lines, EMT-related gene expression in cells under HA or fibroblast stimulation was significantly upregulated compared with that in cells treated with 10% GelMA-1% CS, suggesting that the inclusion of either HA or fibroblast coculture could promote PCa metastasis. Comparing the EMT-related gene expression between 10% GelMA-1% CS-0.1% HA and 10% GelMA-1% CS _Co, C4-2B cells had no significant differences observed, while PC-3 cells had higher expression of Slug, MMP-2, Zeb1, and CD44, along with lower expression of Snail 1 and CDH2 in 10% GelMA-1% CS _Co. Under the coculture in hydrogel containing HA, both PCa cells had the highest EMT marker gene expression compared with all other groups, demonstrating the coeffect of HA and fibroblasts on PCa cellular EMT. Similar to EMT-related markers, PCa cells under fibroblast and HA co-stimulation had the highest CSC-related gene expression compared with all other groups (figures 5(h)–(j)). Interestingly, the C4-2B cells in 10% GelMA-1% CS-0.1% HA had significantly higher CSC-related gene expression than those in 10% GelMA-1% CS_Co, while the PC-3 cells had the opposite trend, suggesting that the effect of HA and fibroblasts could have different impacts on PCa cells with phenotypical differences.
The EMT markers were further determined using IF staining (figures 5(k) and (l)) and quantified with ImageJ (figures S7(a)–(g)) to determine the protein expression of PCa cells under different culture conditions. Similar to the PCR results, PCa cells under HA and fibroblast co-stimulation had the highest protein expression for most of the EMT-related markers, including Slug, Snail 1, MMP-2, and CD44, while no significant differences were observed for Zeb1, CDH1, and CDH2. For C4-2B cells, there were no significant differences observed for EMT-related proteins between 10% GelMA-1% CS-0.1% HA and 10% GelMA-1% CS_Co, which corresponds to the PCR results. For PC-3 cells, Slug, MMP-2, and CD44 protein expression was relatively lower in 10% GelMA-1% CS-0.1% HA compared with 10% GelMA-1% CS_Co, while CDH2 expression was higher, and no significant differences were observed for Zeb1 and Snail 1 expression.
The docetaxel drug response test was used to analyze the drug resistance of PCa cells at Day 7 (figures S7(h) and (i)). PCa cells under 3D cell culture all had relatively higher drug resistance than those under 2D cell culture. The C4-2B cells under HA and fibroblast co-stimulation had the highest cellular viability compared with all other groups, followed by 10% GelMA-1% CS_Co, 10% GelMA-1% CS-0.1% HA, and 10% GelMA-1% CS, suggesting that both HA and fibroblasts could enhance drug resistance, while fibroblasts had a relatively higher promotion effect. For PC-3 cells, there were no significant differences observed between 10% GelMA-1% CS-0.1% HA_Co, 10% GelMA-1% CS_Co and 10% GelMA-1% CS-0.1% HA, while they were all higher than 10% GelMA-1% CS. Overall, the results of EMT-related marker expression and docetaxel drug response tests suggested that HA and fibroblasts could individually promote PCa metastasis and drug resistance, and the coeffect had a more advanced impact.
3.5. Promotion of CAF transformation and potential mechanisms
To investigate the PCa and fibroblast paracrine interaction, the growth factors that could induce PCa metastasis were analyzed using ELISA for fibroblasts cultured in 5% (50% DMS) GelMA compared with 10% GelMA (30% DMS) and 2D culture (figures 6(a) and (b)). Fibroblasts had significantly higher TGF-β1 and FGF2 protein secretion in the 5% GelMA (50% DMS) group than in the other groups, which could be one of the potential factors that promoted PCa EMT-related marker expression.

Figure 6. CAF-related marker expression of fibroblasts. (a), (b) TGF-β1 and FGF2 protein secretion by fibroblasts treated with 10% GelMA and 5% GelMA; (c)–(j) CAF-related gene expression in fibroblast cultures in 2D, coculture and monoculture.
Download figure:
Standard image High-resolution imageThe CAF-related gene expression, including PDGF-B, PDGF-D, FGF2, IGF-1, Desmin, POSTN, NG2 and THY-1, in fibroblasts was also analyzed using PCR under monoculture and coculture conditions and normalized to 2D (figures 6(c)–(j)). All 3D cultured fibroblasts had higher CAF-related gene expression than 2D cultured fibroblasts, and the fibroblasts cocultured with PCa cells had relatively higher expression than those in monoculture, suggesting that PCa cells do have an activating effect on normal fibroblast-to-CAF transformation. Fibroblasts cocultured with PC-3 cells (10% GelMA-1% CS-0.1% HA) had the highest expression of all CAF-related genes compared with all other groups, except POSTN and THY-1, suggesting that more metastatic PCa cells had a stronger effect on CAF activation.
The CAF-activation marker expression for PCa cells in hydrogel with or without HA was further analyzed with PCR, western blotting, and ELISA to investigate the PCa and fibroblast interaction. The gene expression levels, including IL-1β, IL-6, IFN-γ, TGF-β, PDGF-A, PDGF-B, PDGF-C, PDGF-D, IFN-α, and FGF2, are shown in figures 7(a)–(j). The expression levels of all genes were upregulated in 3D culture compared with 2D culture, except for PDGF-B and PDGF-D in C4-2B cells. PCa cells stimulated with HA had the highest gene expression compared with those stimulated with 10% GelMA-1% CS. The protein expression levels of IL-1β, TGF-β, PDGF-A, and PDGF-B in PCa cells were evaluated with western blotting. C4-2B cells demonstrated significantly higher IL-1β and PDGF-B protein expression under HA stimulation, while the expression of PDGF-A and TGF-β was relatively downregulated (figure 7(k)). The PC-3 cells showed significantly upregulated IL-1β, TGF-β, PDGF-A, and PDGF-B expression in hydrogels containing HA (figure 7(l)). The protein secretion levels of IL-6, IL-1β, and TNF-α for PCa cells in 10% GelMA-1% CS and 10% GelMA-1% CS-0.1% HA were determined with ELISA, and fully supplemented media was used as a control (figures 7(m)–(o)). Similar to the PCR and western blotting results, the protein secretion level was also enhanced through HA stimulation. Compared with C4-2B cells, PC-3 cells had higher secretion levels of IL-6 and IL-1β and lower secretion levels of TNF-α.

Figure 7. CAF-activation marker expression for PCa cells in 10% GelMA-1% CS and 10% GelMA-1% CS-0.1% HA. (a)–(j) Gene expression of CAF activation markers in PCa cells; (k), (l) protein expression of CAF activation markers in PCa cells; (m)–(o) protein secretions of CAF activation markers in PCa cells.
Download figure:
Standard image High-resolution image
4. Discussion
4.1. 3D bioprinted biomimetic coculture model for PCa and fibroblasts
CAFs are one of the most common cell types in the PCa TME and can promote PCa cell proliferation, metastasis, and drug resistance [21–23], while the sources of CAFs and the molecular mechanism underlying the CAF and PCa interaction are still not fully understood. The effect of cell‒cell interactions is mainly investigated through a coculture model, where cells are either seeded together in a direct physical contact system or seeded separately in an indirect contact system. In direct contact coculture, cells could have physical interactions in either 2D or 3D cell culture, and paracrine signals can be evaluated, while the difficulties in investigating the different cytokine expression levels of the diverse cell types and individual cellular analysis after coculture are clear disadvantages [25]. In the indirect coculture system, cells are physically separated by a Transwell, with the culture medium and cytokines crossing the porous membrane, which is appropriate for the study of cell‒cell paracrine interactions [26]. However, these coculture models lack mimicking of the ECM components and cellular distributions in the TME, which makes the results less reliable. Taking advantage of the complicated structure development and precise cellular allocation, 3D bioprinting has been used to develop an in vitro TME for PCa. Holzapfel et al 3D printed a hollow tube to mimic human bone morphology for the investigation of the interaction between mesenchymal progenitor cells and PCa cells [27]. Similar studies were also performed by Shokoohmanda et al [28] and Bock et al [29], where engineered bone microenvironments were prepared by 3D printing to investigate PCa behavior after metastasis, while few researchers created coculture models to study the underlying mechanism by which fibroblasts promote PCa metastasis at the primary site.
In this study, we used 3D cell-laden bioprinting to prepare a highly biomimetic ecosystem that contains fibroblasts and PCa cells to provide important cues for recapitulating the pathological features of PCa (figure S1). To represent the heterogeneous ecology of PCa, the principal mechanism underlying the model was to provide a compartmentalized cancer-stroma structure, where PCa cells were cell-laden bioprinted as a grid structure in the middle, and fibroblasts were printed to surround the PCa cells. This model better mimics the cellular distribution in the PCa TME than direct contact coculture in 2D or 3D (figure S8) and provides a more heterogeneous ecology to study cell‒ECM and cell‒cell paracrine interactions. The bioink used in this study contains GelMA, CS and HA. Synthetic polymers, such as PCL [27, 28, 39], are most commonly used in 3D printing of PCa TME due to their excellent printability, while they completely lose their biological properties. Biomaterials used as bioinks to mimic ECM, such as collagen, alginate, and chitosan, have good biocompatibility, while they are single-component, which fail to recapitulate the complicated matrix compositions of a given organ. Collagen, CS and HA have been shown to be overexpressed in PCa and correlate with PCa progression, metastasis and drug resistance [12, 16–19], which leads to their inclusion in the bioink for the development of PCa 3D cell culture models. GelMA is a methacrylated gelatin that retains collagen's high biocompatibility and cellular adhesion properties while obtaining much better printability and has been widely used in various tissue engineering applications [40–43]. HA and CS can hardly be used as bioinks individually due to their weak printability, leading to physical crosslinking with GelMA. The CS concentration used in this study was constant at 1% since our previous study found that 1% CS could significantly promote PCa cellular proliferation, EMT gene expression and drug resistance. Various HA concentrations, including 0.1%, 0.5% and 1%, were mixed with 10% GelMA-1% CS for evaluation, and 0.1% HA showed the most ideal physical and biochemical properties as a bioink, leading to further applications in PCa and fibroblast coculture model development.
The 3D bioprinted coculture model developed in this study closely mimicked the cellular distribution, microarchitecture, and ECM of the PCa TME and also provided a better understanding of the cell–matrix and cell–cell interaction, suggesting the potential applications for the coculture of primary PCa cells and CAFs derived from patients for drug screening and development. Compared with Transwell, the cocultured model developed in this study better mimics the microarchitecture of PCa TME, which is one of the most important factors that influences the cancer development, metastasis and drug resistance [44–47]. Taking the advantages of 3D bioprinting in high resolution, efficiency, precision, reproducibility, and personalization, this coculture had higher potential to be used as a platform for drug screening and development clinically or in industry. In the future, the coculture model could be further developed to have more complicated structure that better mimics PCa TME, and the bioinks could also be developed to include more functional ECM components based on the proteomics of PCa TME, which could help us to more realistically mimic the PCa ECM components and microarchitecture.
4.2. HA induced CAF transformation through PCa cell cytokine secretion
Two PCa cell lines, PC-3 and C4-2B, were bioprinted in newly developed bioink that contained 0.1% HA to analyze the effect of HA on PCa cellular behavior. The two PCa cell lines have phenotypical differences, where PC-3 cells were derived from a lumbar metastasis and are androgen independent, while C4-2B cells were derived from a bone metastasis of the LNCaP parental line and are androgen dependent [48]. These two cell lines provided a comparison of PCa androgen responses that are observed in human patients to examine the influence of HA concentration and fibroblast interactions.
The inclusion of HA significantly promoted PCa cellular proliferation, which corresponded with the results found in another study, where the disulfide-crosslinked HA hydrogels could promote PC-3 and LNCaP cell growth [49]. RNA-seq was further used to analyze the effect of HA on PCa cellular behavior more comprehensively. Global transcriptome profiling revealed that PCa cells in 10% GelMA-1% CS-0.1% HA had a dramatically different transcriptional profile than those in 10% GelMA-1% CS. Both PCa cell lines showed upregulation in pathways related to EMT, angiogenesis, and cytokine secretion, which was further verified by gene and protein expression. EMT and angiogenesis have received considerable attention as a potential hypothesis to explain invasive and metastatic behavior during cancer progression. The acquisition of mesenchymal phenotypes for PCa cells could significantly promote their migration and invasion [50, 51], and the formation of new capillaries from preexisting vessels is also an absolute requirement for tumor progression and metastasis [52]. HA has also been found to facilitate EMT and angiogenesis in other studies. HA negatively regulates CDH1 expression in cancer cells through the activation of the CD44 receptor [53], which is a multistructural transmembrane glycoprotein involved in cell–cell interactions, cell adhesion and migration [54]. Overexpression of CD44 was also found in this study (figures S6(h) and (i)), which could explain the upregulation of EMT-related marker expression under HA stimulation. The overexpression of HA and degradation products was also found to accelerate the formation of intratumoural neovasculature in breast cancer [55]. However, few studies have reported that HA can induce cytokine expression in PCa cells.
The gene expression and protein secretion of the cytokines that could induce CAF transformation were relatively upregulated under the stimulation of HA in PCa cells, which corresponds with CAF transformation observed for the fibroblasts under coculture. Inflammatory factors are the major modulators that promote CAF transformation. IL-1 has been shown to activate CAF transformation through the NF-κB signaling pathway [56], and IL-6 could act primarily on the signal transducer and activator of transcription pathway [57]. TNF-α participates in paracrine signaling that promotes the activity of CAFs, and the mutation of p53 could promote TNF production by cancer cells [58], which corresponds to the GSEA of PCa cells under the stimulation of HA in this study. Receptor tyrosine kinase ligands, such as PDGFs and FGF, are also able to activate CAF transformation. The expression of PDGF-C in a mouse model has been shown to accelerate the recruitment and activation of CAFs [59]. TGF-β1 alters the target gene expression of stromal fibroblasts through the canonical TGFβ signaling pathway, leading to differential gene expression, such as α-SMA and FAP, in CAFs [60, 61]. Compared with C4-2B cells, PC-3 cells had relatively higher IL-6 and IL-1β secretion, suggesting that more aggressive PCa cells could better induce CAF transformation under HA stimulation.
The crosstalk between HA, PCa cells and CAFs revealed that HA not only promoted PCa metastasis directly, but also induced the CAFs transformation indirectly, and form a vicious circle that further promoted the PCa metastasis. Currently, most of the therapeutic strategies targeted the CAFs directly, while the inhibition of the CAFs transformation was less investigated. The findings in this study provided a better understanding of the potential sources of CAFs, and also suggested that HA could be a potential therapeutic marker to be inhibited for PCa therapeutics in the future.
5. Conclusion
In this study, we used 10% GelMA-1% CS-0.1% HA as a bioink to bioprint a PCa and fibroblast coculture model, which created a more biomimetic TME that could be used to investigate the effect of HA on PCa metastasis and the mechanism underlying the paracrine interaction between PCa cells and fibroblasts. Cytokine secretion, angiogenesis, and EMT were significantly upregulated under HA stimulation. Further coculture with normal fibroblasts had a coupling effect on the promotion of PCa cellular proliferation, drug resistance and EMT-related marker expression, which could be caused by CAF activation induced by the upregulated cytokine secretion of PCa cells. These results suggested that the coculture model developed in this study could be a promising in vitro platform for investigating the mechanism underlying cell‒cell interactions and screening chemotherapies.
Data availability statement
The data cannot be made publicly available upon publication because they are not available in a format that is sufficiently accessible or reusable by other researchers. The data that support the findings of this study are available upon reasonable request from the authors.
Authors' contributions
Kailei Xu performed the experiments, analyzed the data, and drafted the manuscript. Yuye Huang and Miaoben Wu analyzed the data. Jun Yin and Peng Wei revised and organized the experiments.
Conflict of interest
We declare that we have no financial and personal relationships with other people or organizations that can inappropriately influence our work, there is no professional or other personal interest of any nature or kind in any product, service and/or company that could be construed as influencing the position presented in, or the review of.
Funding
This study was partly funded by the National Natural Science Foundation of China (Grant No. 52075482, 52250006, and 12202387), the Key Laboratory of Precision Medicine for Atherosclerotic Diseases of Zhejiang Province, China (Grant No. 2022E10026), the Natural Science Foundation of Zhejiang Province (Grant No. BY23H180015), the Natural Science Foundation of Ningbo (Grant No. 2022J216).
Ethics approval and consent to participate
There were no human participants, human data, human tissues or animal studies included in this manuscript.
Consent for publication
All the involved authors agree to the submission of this paper. The material within the manuscript has not been submitted for publication elsewhere.
Supplementary data (5.0 MB DOCX)