

Abstract
Silicate bioceramics possess an excellent bioactivity; however, shaping them into complex geometries is still challenging. Therefore, this paper aims to present a new strategy for the shaping of a bioglass-ceramic with controlled geometry and properties starting from a glass powder combined with a preceramic polymer, i.e. a silicon resin, and reactive fillers. The powder-based three-dimensional (3D)-printing of wollastonite (CaSiO3)-based silicate bioceramic parts was demonstrated in this work. The resin plays a dual role, as it not only acts as a non-sacrificial binder for the filler powders in the printing process but it also reacts with the fillers to generate the desired bioceramic phases. The mechanical and physical properties, i.e. ball-on-three-balls test, density, porosity and morphology, were evaluated in 3D-printed discs. These samples possessed a total porosity around 64 vol% and a biaxial flexural strength around 6 MPa. The raw materials used in this work also enabled the 3D-printing of scaffolds possessing a designed multi-scale porosity, suitable bioceramic phase assemblage and a compressive strength of 1 MPa (for cylindrical scaffolds with total porosity ∼80 vol%). Solubility in TRIS/HCl and in vitro assays, i.e. viability, cytotoxicity and apoptosis assays, were also performed. In vitro tests indicated good cell viability and no cytotoxicity effect on the cells.
Export citation and abstract BibTeX RIS
1. Introduction
Due to their potential use as materials for bone tissue engineering, silicate bioceramics have been intensively studied in recent years [1, 2]. Since the milestone formulation of Hench's bioglass, several silicate systems have been shown to possess excellent bioactivity [3–6]. The shaping of bioceramics into complex structures is challenging, especially for developing porous scaffolds for tissue engineering applications. Traditional methods such as direct foaming, replica method and the use of sacrificial templates have limited control over the shape and dimension of the individual pores [7–9], thus the simultaneous control of shape and properties is difficult. On the other hand, additive manufacturing (AM) technologies offer the potential to precisely replicate a geometry directly from a 3D model by adding material in a layer-by-layer approach. AM is defined as the 'process of joining materials to make objects from 3D model data, usually layer upon layer, as opposed to subtractive manufacturing methodologies, such as traditional machining' [10]. AM is particularly useful for the shaping of complex structures, such as scaffolds for tissue engineering [11, 12]. In the powder-based 3D-printing system, a layer of powdered material is spread and a printing head selectively ejects droplets of the printing liquid, thus inscribing in the layer the corresponding cross-section of a 3D-model of the object to be built. This process is iteratively repeated until the object is completed. The fabricated part is completely embedded in a powder-bed, from which it can be easily extracted and cleaned by means of a brush and compressed air.
The aim of this study was to demonstrate the 3D-printing of wollastonite (CaSiO3)-based silicate bioceramic parts starting from a glass powder combined with a preceramic polymer, i.e. a silicon resin, and reactive fillers. In this process, the preceramic polymer acts as a binder for the ceramic powder; hence the use of organic binders is avoided. Furthermore, upon heat treatment the silicon resin yields a SiO2 residue which can be reacted with active fillers in the starting mixture, forming the desired phase assemblage. Furthermore, preliminary in vitro tests aimed to indicate that this process and these materials offered a good cell-material interaction by allowing the cells to proliferate and not causing a cytotoxic effect on them.
The approach described in this work is particularly interesting because it can be potentially applied to several other silicate bioceramics. In fact, hardystonite (Ca2ZnSi2O7) was recently obtained by the addition of nano-sized ZnO as a second filler [13]. Other silicate bioceramic compositions, such as akermanite (Ca2MgSi2O7), sphene (CaTiSiO5) or baghdadite (Ca3(Zr,Ti)Si2O9) have been produced or are currently under investigation [14].
2. Materials and methods
2.1. Materials
A commercial available polymethylsilsesquioxane (Silres MK polymer, Wacker Chemie, Germany) was used as preceramic polymer, supplied in the form of a fine powder (<100 μm). This polymer was used due to its high solubility in various organic solvents and to its high yield in SiO2 upon pyrolysis (84 wt%).
Calcium carbonate (CaCO3; Merck, Germany) and AP40 glass were used as active and inert fillers, respectively. AP40 is a proprietary glass which crystallizes in the apatite–wollastonite glass–ceramic system [15]. AP40 had a composition (wt%) as follows: 44.30 SiO2, 31.89 CaO, 11.21 P2O5, 0.20 K2O, 4.60 Na2O, 2.80 MgO, 5.00 CaF2. Briefly, AP40 was prepared by mixing the raw materials for 2 h in a tumbling mixer (Turbola TF2, Glenn Mills, USA) followed by melting for 3 h at 1550 °C in a platinum crucible and pouring in water to prepare a frit. Then, the frit was milled by a jaw crusher (BB50, Retsch, Germany), with the gap set at 100 μm, and sieved below 45 μm.
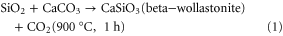
The preceramic polymer and the active filler were mixed in a stoichiometric ratio to give pure wollastonite according to the reaction presented in equation (1).
By mixing the preceramic polymer, CaCO3 and AP40 glass in specific ratios, different compositions were designed for the 3D-printing process, following table 1.
Table 1. Labeling and designed composition of the composite materials investigated.
| G = glass (AP40) (wt% after heat treatment) | HG = high glass (wt% after heat treatment) | LG = low glass (wt% after heat treatment) | W = wollastonite (wt% after heat treatment) | |
|---|---|---|---|---|
| AP40 glass–ceramic | 100 | 80 | 40 | 0 |
| Wollastonite (from preceramic polymer) | 0 | 20 | 60 | 100 |
2.2. Preparation of powder mixtures for the 3D-printing process
Powder mixtures for the 3D-printing process were prepared by dry mixing the raw materials in a tumbling mixer for 3 h followed by a granulation process. Briefly, the granulation was obtained by depositing a thin (<1 mm) layer of powder and spraying isopropanol from the top; after sieving between 45 and 125 μm, a granulated powder mixture with the desired particle-size distribution was obtained.
After the granulation process, the granule size and the size distribution were measured by laser granulometry (Mastersizer S, Malverns Instruments GmbH, Germany). The flowability of the granulated material was assessed by the Hausner ratio (HR), according to equation (2) [16]

Where ρBulk is the freely settled bulk density (g/cm3) of the powder and ρTap the plateau tap density (g/cm3) of the powder. Each measurement of the Hausner ratio was repeated three times (n = 3).
2.3. Powder-based 3D-printing process
In order to print the materials a printing head with 128 jets (Spectra SL128-AA, Dimatix Fujifilm USA, CA) mounted in a commercially available printer (Voxeljet Teststand VTS 16, Voxeljet Technology GmbH, Germany) was used. The system used a blade-recoating system. A powder mixture of the polymer, active filler and inactive filler was used to deposit layers with a thickness of 150 μm. A mixture of 1-hexanol and hexylacetate (Voxeljet, Germany) was used as a printing liquid [17]. Printing liquid was injected through the nozzles of the printing head in order to obtain the required cross-section of the object for a given layer. This process was repeated until completion of the designed object. The printed part was left to dry in the powder bed overnight. Then, it was extracted from the surrounding powder-bed and gently cleaned with a brush and compressed air. In order to obtain a completely ceramic part, the green samples were subsequently heat treated in air at 900 °C for 1 h with a heating rate of 2 °C min−1.
The ratio between the mass of solvent and the mass of powder (R) used to print a part was calculated as previously described [17].
For each composition, 3D-printed discs with dimensions of 16 mm diameter and 3 mm in thickness were obtained to evaluate their shrinkage and density. The dimensions of the discs and their density were measured before and after heat treatment. Density was obtained by the Archimedes' method using deionized water. Briefly, the dry mass of printed discs was measured after keeping them for 24 h at 150 °C. Afterwards they were placed in boiling water for 5 h for impregnation and their suspended and immersed masses in water were measured. From the measurements of the dry, suspended and impregnated masses, the apparent density and open porosity values were calculated (ASTM C373-88). Shrinkage was measured using a digital caliper, measuring each tablet on different locations to obtain a representative value. Six samples of type HG (n = 6) and four samples of type LG (n = 4) were measured.
3D-printed samples were observed after heat treatment under a scanning electron microscope (SEM) (Zeiss Gemini Supra 40, Carl Zeiss GmbH, Germany), in order to investigate the morphology and the morphological changes.
The phase composition after heat treatment was investigated by x-ray diffraction (XRD; D8 Advance, Bruker, Germany). The XRD analysis was performed on powdered 3D-printed tablets with Cuα1 radiation (10–70° 2θ, 2 s/step). A semi-automatic phase identification was provided by the Match! software package (Crystal Impact GbR, Germany), supported by data from the PDF-2 database (ICDD-International Center for Diffraction Data, PA, USA).
2.4. Dissolution tests
The dissolution was measured according to the DIN EN ISO 10993–14 standard, but applied to 3D-printed discs instead of granules. Discs with dimensions of 16 mm in diameter and 3 mm in thickness were produced and three samples were tested for each composition (n = 3). Samples HG and LG were weighted (MC1 Research RC210P, Sartorius, Germany) before and after the dissolution test. Samples G and W were also tested for comparison. Here 3D-printed discs of type G were produced by 3D printing an AP40 glass powder with a commercial 3D printer (RX-1, Prometal RCT GmbH, Germany) which makes use of a binder directly mixed with the printing liquid. An as-sieved AP40 powder in the range 45–90 μm was used to achieve a good flowability.
Briefly, the samples were immersed in 20 ml of TRIS-HCl solution for each 1 g of powder and the sample holder was left at 37 °C under a continuous circular movement. The pH was adjusted at pH = 7.4 by adding HCl to the TRIS buffer solution. The total dissolution was measured after 120 h (according to the normative) and then every week (168 h) for a further 9 weeks. The solution was completely replenished after each measurement.
Samples were measured by ICP-OES (Optima 3000, Perkin-Elmer, USA). The dissolution was normalized by expressing it as mg of dissolved material divided by the weight of the sample.
The printed tablets weighed 0.75 ± 0.10 g. The only exception was for tablets W; these samples were lighter (0.5 g) because the thickness of the tablets had to be decreased in order to avoid cracking caused by the gas released during heat treatment.
2.5. Mechanical testing of 3D-printed tablets
Biaxial flexural mechanical tests using the ball-on-three-balls set up were performed to assess the strength of the samples using a mechanical testing machine (Zwick/Roell Z005, Germany) [18]. The measurement was performed on 3D-printed discs of dimensions 16 mm in diameter and 3 mm in thickness. 3D-printed discs of type G were also produced as controls.
The ball-on-three-balls method requires the knowledge of the Poisson coefficient of the tested material. Therefore, the coefficient of the ceramic mixtures was estimated with a rule of mixtures starting from the coefficients of the individual phases, i.e.apatite–wollastonite glass–ceramic and wollastonite [19, 20].
The porosity was taken into account by following three different models and averaging the results of the three methods [21–23]. A possible error of 5% on the maximum stress could be estimated [24]. The number of tested samples for the mechanical was 32 for HG and 19 for G. Compression tests were also performed at speed of 5 mm min−1 between parallel plates of the same testing machine used for the ball-on-three-balls measurements. Fifteen (n = 15) 3D-printed porous cylinders of type HG were measured.
2.6. In vitro assessment
MC3T3-E1 subclone 4 cells (ATCC, USA) were used. The medium consisted of DMEM (Gibco, Germany) supplemented with 10% FBS (Sigma-Aldrich, Germany), 2mM L-glutamine (Gibco, Germany), 50 μg ml−1 of ascorbic acid (Sigma-Aldrich, Germany), 5mM β glycerophosphate (Sigma-Aldrich, Germany) and 50 μg ml−1 of penicillin–streptomycin (Gibco, Germany). Cells were cultured in T75 cell culture flasks with 12 ml of medium. The medium was refreshed three times a week. For amplification, cells were grown until confluence in cell culture flasks and then detached with a 0.25% trypsin/0.02% EDTA (BioChrom, Germany) solution and passaged. Cells were seeded on 3D-printed discs with dimensions of 10 mm in diameter by 2.5 mm in height. Before performing the seeding, discs were heat sterilized at 300 °C for 3 h and then placed in cell culture medium for 24 h. After this period, the medium was removed and a specific amount of cells per disc was seeded on the top of the discs, i.e. 50 000 cells in an 80 μl drop. After 3, 7 and 14 days of culture, cell proliferation, cytotoxicity and apoptotic behavior were measured using an alamarBlue® assay (Invitrogen, Germany), a CellTox Green® assay (Promega, Germany) and a Caspase 3/7® assay (Promega, Germany), respectively. Assays were performed in triplicate (n = 3). Cells seeded at different densities in normal plastic wells were used as standards for comparison purposes for the viability tests, i.e. alamarBlue®. This standard included different cell densities from 1 × 10⁶ to zero, or a blank value for zero live cells. The cytotoxicity assay used only a blank value as comparison point with which to have a signal for no dead cells, or zero dead cells. For the apoptosis assay the results were only relative to the other samples.
3D-printed samples were observed under a SEM (Phenom Pure, Phenom, Germany) at 3 days and 14 days the in vitro tests.
2.7. Statistical analysis
Results are expressed as mean ±standard deviation. Where applicable, statistical significance (p < 0.01) of the results was assessed using the Student's t-test.
3. Results
3.1. Preparation of powder mixtures for the 3D-printing process
Figure 1 displays the SEM analysis for the two powder compositions obtained. After granulation, both compositions present a similar morphology with an equiaxial particle shape.

Figure 1. SEM micrographs of (a) HG and (b) LG granulated powder mixtures used for 3D-printing. HG = high amount of glass filler, LG = low amount of glass filler.
Download figure:
Standard image High-resolution imageThe properties of the granulated powder mixtures are presented in table 2.
Table 2. Results of the powder mixtures used, i.e. HG and LG in terms of their particle size at which 10% (d10), 50% (d50) and 90% (d90) of the particles are smaller than this value. The Hausner ratio is also displayed here. HG = high amount of glass filler, LG = low amount of glass filler.
| Powder mixture | d10 (μm) | d50 (μm) | d90 (μm) | Hausner Ratio |
|---|---|---|---|---|
| HG | 14 | 44 | 80 | 1.28 ± 0.01 |
| LG | 19 | 85 | 146 | 1.23 ± 0.01 |
Granulated powders had a maximum particle size, i.e. the d90 value, and a mean particle size value, i.e. d50, of 80 μm and 44 μm for HG and of 146 μm and 85 μm for LG. Both compositions presented low fractions of small particles as the d10 values for 80A and 40A were 14 μm and 19 μm, respectively. The distribution values show that LG had a larger mean particle size and a lower Hausner ratio.
3.2. Powder-based 3D-printing process
Based on the SEM analysis of the surface of 3D-printed tablets, the green body HG (figure 2(a)) presented a more uniform structure while LG (figure 2(c)) presented a less uniform structure with larger pores than HG. LG also displayed a more important presence of the polymer binder. After sintering, HG (figure 2(b)) presented a slightly more porous structure than LG (figure 2(d)). However, HG remained with a more compacted morphology than LG.

Figure 2. SEM micrographs of the top surface of the printed HG samples (a) before and (b) after heat treatment for ceramization and LG samples (c) before and (d) after heat treatment for ceramization. The arrow indicates the wollastonite obtained from the reaction between the preceramic polymer and the CaCO3 filler. The asterisk indicates the network of sintered glass particles. HG = high amount of glass filler, LG = low amount of glass filler.
Download figure:
Standard image High-resolution imageTable 3 presents the density, shrinkage and porosity results. HG after heat treatment had a radial linear shrinkage smaller than LG and a lower density value. The shrinkage values are in good correlation with the SEM observations, as HG presented the smaller change in its structure. Nevertheless, these values indicate a limited densification during the sintering process. The residual porosity was larger for HG than for LG. From the values of total and open porosity, it could be calculated that 92% and 96% of the total porosity was open porosity for samples HG and LG, respectively.
Table 3. Printing parameters and density, porosity and radial shrinkage of printed parts after ceramization at 900 °C. G = glass alone, HG = high amount of glass filler, LG = low amount of glass filler.
| Powder mixture | R value | Density (g cm−3) | Total porosity (%) | Open porosity (%) | Shrinkage after Ceramization (%) |
|---|---|---|---|---|---|
| G | a | 1.48 ± 0.07 | 48 ± 2 | 48 ± 3 | 8.1 ± 0.4 |
| HG | 0.19 | 1.00 ± 0.01 | 63.8 ± 0.7 | 58.5 ± 0.9 | 5.2 ± 0.6 |
| LG | 0.08 | 1.30 ± 0.04 | 53.1 ± 0.7 | 51.0 ± 1.0 | 6.7 ± 0.5 |
Figure 3 shows the flexibility of the 3D-printing system to produce different geometries, from simple ones (figures 3(a)–(b)) to more complex ones (figures 3(c)–(d)).

Figure 3. Images of (a) CAD model of a cylindrical porous scaffold, (b) obtained HG 3D-printed scaffold from (a) and after heat treatment, (c) green body of an obtained HG cubic scaffold after 3D printing and (d) cubic scaffold from (c) after heat treatment. HG = high amount of glass filler, LG = low amount of glass filler.
Download figure:
Standard image High-resolution image3.2.1. XRD analysis
The phase purity of samples HG and LG was examined by means of XRD analysis. Figure 4(b) shows that for HG, almost all peaks could be assigned to wollastonite-2M and hydroxylapatite (Ca10(PO4)6(OH)2) or fluorapatite (Ca5(PO4)3F), except for a minor amount of cristobalite (SiO2). Hydroxylapatite and fluorapatite are not easy to separate since their peaks are in similar positions; it is possible that the sample contains both phases.

Figure 4. X-ray diffraction patterns of 3D-printed sample LG (a) and HG (b), after heat treatment at 900 °C. HG = high amount of glass filler, LG = low amount of glass filler.
Download figure:
Standard image High-resolution imageThe presence of wollastonite and apatite was confirmed in LG as well (figure 4(a)). However, the expected phase purity could not be confirmed in this case, since some peaks that could not be attributed either to wollastonite or to apatite were present. The correct phase identification is rather complex, due to the presence of multiple phases with superimposed peaks, but surely there are secondary phases of cristobalite and larnite, which is a dicalcium silicate (Ca2SiO4).
3.3. Dissolution tests
The dissolution results are presented in figure 5. Here the total dissolution for 3D-printed compositions HG, LG, G and W is presented after ceramization.

Figure 5. Cumulative dissolution results for sintered samples. G = glass alone, HG = high amount of glass filler, LG = low amount of glass filler, W = no glass filler.
Download figure:
Standard image High-resolution imageSample W, i.e. mainly wollastonite, presented the highest dissolution at all time points, reaching around 230 ± 8 mg g−1 after 68 days. This was followed by LG, HG and G in decreasing order.
3.4. Mechanical testing of 3D-printed tablets
The ball-on-three-balls mechanical strength of printed G and HG tablets is reported in table 4.
Table 4. Mechanical properties, i.e. the Weibull strength and modulus, of 3D-printed discs after ceramization at 900 °C. G = glass alone, HG = high amount of glass filler.
| Sample | No. of tested samples | Weibull characteristic strength (MPa) | Weibull modulus |
|---|---|---|---|
| G | 19 | 7.9 | 3.7 |
| HG | 32 | 5.9 | 6.6 |
A Weibull characteristic strength of 5.9 MPa with a Weibull modulus of 6.6 was measured for HG tablets, while G tablets had slightly higher Weibull strength (7.9 MPa), but lower Weibull modulus (3.7).
A compressive strength of 1.0 ± 0.3 MPa was measured for the porous cylindrical scaffold in figure 3(b). These scaffolds had a total porosity of 78 ± 1% (measured geometrically) including both the designed macro-porosity and the porosity in the struts. The designed macro-porosity (calculated on the CAD drawing) was 37.9%; including in the model a porosity in the struts of 63.8% from table 3, we estimated a total porosity of 37.9% (macro porosity) + (100–37.9)% · 0.638 = 77.5%, which is similar to the geometrically measured density of our scaffolds, thus confirming our model.
3.5. In vitro assessment
A preliminary viability test was performed in order to evaluate the cell proliferation and growth on ceramic discs of composition LG and HG. Figure 6(a) shows the results of the viability assessment of the two samples, i.e. HG and LG, at the different time points of 3, 7 and 14 days.

Figure 6. Results of the in vitro assays performed on the HG and LG sintered discs with MC3T3 cells for 3, 7 and 14 days (a) cell viability, (b) cytotoxicity and (c) apoptotic behavior. Boxes show 25, 50 and 75 percentiles and whiskers represent standard deviation. HG = high amount of glass filler, LG = low amount of glass filler.
Download figure:
Standard image High-resolution imageAfter 3 days the number of cells was kept constant for HG; compared to the initial number of cells seeded, this value was significantly lower for LG (p = 1.06 · 10−9). After 7 days the number of cells increased and there were no significant differences between HG and LG (p = 0.31). At 14 days the difference in the number of cells between the two materials increased, being significantly higher for LG (p = 7.6 · 10−4). In general, after 14 days the number of cells increased significantly on both materials compared to the initial seeding cell number.
The cytotoxocity assay (figure 6(b)) seems in correlation with the viability assay as the results for LG at 3 days were significantly higher compared to HG. At 7 and 14 days the differences between the two materials were not significant. However, for all the materials and for all the time points, the cytotoxicity was lower compared to the well plate with the CellTox Green dye in the medium without cells, i.e. there were zero dead cells. The lower cytotoxicity values to this zero–dead cells value indicated that the materials obtained by the preceramic polymer route, in combination with the 3D-printing process, did not created a cytotoxic environment for the cells.
The apoptotic assay (figure 6(c)) presented a higher significant value for HG compared to LG after 3 and 7 days. At 14 days, there was no significant difference between the two samples (p = 0.04). The ratio of the mean number of cells at a given time point divided by the Caspase activity remained similar. The observations performed by the in vitro assessment were also confirmed by SEM observation (figure 7).

Figure 7. Representative SEM images of MC3T3 cells seeded on sintered discs (a) 3 days on HG, (b) 14 days on HG, (c) 3 days on LG and (d) 14 days on LG. HG = high amount of glass filler, LG = low amount of glass filler.
Download figure:
Standard image High-resolution image
At 3 days a reduced number of cells were present on both materials. After 7 days a continuous layer of cells formed on the surface of the samples, indicating a good growth and spreading of the cells on the samples. After 14 days, the cells covered the whole surface of both materials.
4. Discussion
4.1. Preparation of powder mixtures for the 3D-printing process
The particle-size distribution of both granulated powders was suitable for the layer-by-layer deposition, since the layer thickness used was 150 μm and the particles had mainly a diameter below this value. HG powder had a mean dimension that was smaller than LG powder. This can be associated to the fact that composition LG had a higher amount of polymer, which probably favored the growth of the size of the granules during the granulation process.
The measured Hausner ratio corresponded, based on our former experience [25], to a fair flowability which is sufficient for the deposition of a defect-free layer. A lower Hausner ratio corresponds to a better flowability, because it is an indication that the powder is more efficiently packed already before tapping, and the increase in packing density after tapping is therefore lower. These Hausner ratio values also agree with values associated with a fair or acceptable flowability for other powders [16]. The round shape of the granulated powders was also favorable for the flowability.
As expected, the HG powder had a higher Hausner ratio value due to the fact that its mean particle size was smaller. It is known that flowability is greatly dependent on the Bond number, which is the ratio between the gravitational forces and the interparticle forces that act on the single particles [26]. Since the interparticle forces increase as the particle size decreases, it is expected that powders with a smaller particle size have a worse flowing behavior.
4.2. Powder-based 3D-printing
The use of preceramic polymers, besides giving unique ceramic phases upon heat treatment in inert and oxidizing atmosphere, takes advantage of the excellent solubility of preceramic polymers in several organic solvents. Hence, a ceramic component can be produced without the addition of a binder within the powder or the printing liquid. This means that the printing head can simply eject tiny droplets of a solvent, which locally and selectively dissolves the preceramic polymer. The polymer becomes sticky and after solvent evaporation, a solid phase is thus formed. When an additional filler (inert or active) powder is mixed in the composition, the preceramic polymer acts as a binder within the powder, locally gluing the particles. An advantage in this case is that the polymer behaves as a 'non-sacrificial' binder, because it gives a high ceramic yield upon heat treatment (>80 wt%), opposite to standard organic binders, which completely burn and need a dedicated debinding step. Other advantages are directly related to the properties of preceramic polymers and fillers mixtures, which can generate the desired ceramic phases with high purity and at lower temperatures compared to traditional processing techniques [27].
Furthermore, in contrast to previous experiments, when using a relatively high amount of fillers (as in this work), the addition of a cross-linking catalyst was no longer necessary. This is because the geometry of the part remains stable owing to the support provided by the inorganic fillers, even when the temperature is increased above the polymer's Tg [17].
This 3D-printing approach allowed the production of tablets as well as complex porous structures. Samples containing a higher and a lower amount of glass inert filler were produced. From a processing point of view, it was expected that in HG samples, with high amount of glass filler (and thus with a low amount of preceramic polymer), the polymer acted only as a local binder between ceramic particles, whereas in LG samples, with a higher amount of preceramic polymer, it formed a continuous polymeric phase containing the ceramic particles, thus forming a very different morphology of the sample in the two cases.
HG-printed tablets had a more uniform morphology and smaller pores than LG. This characteristic seems indeed to be related to the effect that the different amount of polymer had on the 3D-printing process. LG had a much higher amount of polymer, which was dissolved by the printing liquid and formed, after re-solidification, an almost continuous polymeric phase containing the ceramic fillers, leaving relatively large and irregularly distributed pores. After the heat treatment, large cracks formed on the surface due to the ceramization process, which is accompanied by shrinkage, and gas release. The HG contained instead a lower amount of polymer, which was only sufficient to locally bind the adjacent ceramic particles. After the heat treatment, the morphology of the sample was comprised by a network of AP40 glass–ceramic particles, formed by sinter-crystallization (figure 2(b), asterisk), and a secondary phase deriving from the ceramization process and reaction of the preceramic polymer with the active filler CaCO3, which decomposed forming reactive CaO at the treatment temperature (figure 2(b), point 1).
The porosity of HG was smaller (<50–100 μm) and more homogeneously distributed than that of LG. This morphology of HG is more desirable for the absence of cracks, a higher homogeneity and for the better printing precision that was achievable when printing HG compared to LG.
HG had a lower shrinkage and densification compared to G. The densification mechanism for G during heat treatment is the sinter-crystallization of the glass particles; the addition of a secondary phase in HG reasonably partially hinders the densification, resulting in lower shrinkage and higher final porosity. This behavior, however, does not follow a linear trend with decreasing amount of glass filler in LG; the reason may be that the glass particles do not form a continuous network in this case, and the main contribution to the shrinkage becomes the reduction in volume that follows the polymer-to-ceramic transformation and the formation of the wollastonite phase.
Pores of this size are too small for cells ingrowth, since usually a pore size of 200–400 μm [28] and a large size of the interconnections [29] is considered optimal. However, the microporosity in the struts of a biomaterial also has a role on their overall behavior. Chan et al suggested that silicate-substitute calcium phosphate graft materials with higher strut porosity are more osteoconductive [30]. They also noted bone formation in small pores <10 μm, although these pores are probably too small for cells. Bignon et al studied the effect of both macropores and strut pores on the growth of osteoblasts and fibroblasts [29]. The size of the macro-interconnections affected the penetration of cells; however, cell migration occurred via emission of cytoplasmic extensions that attached to the microporosity. It is also important to observe that for both 3D-printed samples the open porosity was >90% of the total porosity. 3D-printing of these compositions therefore allows for the production of samples with both a microporosity in the struts and a designed macroporosity, which is easily tailored by the printing process.
Obviously, the influence of porosity on both mechanical properties and resorbability of an implant has to be considered, whereas an increased porosity generally decreases the strength and increases the resorption rate.
4.2.1. XRD analysis
In the case of HG, the possibility of achieving a high-phase purity was demonstrated. Both apatite phases were generated by the crystallization of the AP40 glass, while wollastonite derived both from the crystallization of AP40 and from the reaction between the residues coming from the preceramic polymer and the CaCO3 filler upon heat treatment. The presence of an expected amorphous phase (deriving from the AP40 glass) could also be detected by observing the amorphous hump located at about 28°.
In the case of LG, the formation of different silicates as secondary phases was consistent with what was found in samples W and in a previous work when using the same silicone resin and a micro-sized CaCO3 filler, which led to a non-optimal mixing [31]. It was found that the formation in the shaped component during heating of regions richer in CaO and regions richer in SiO2 (from the preceramic polymer) would cause the formation of larnite and cristobalite secondary phases, respectively.
4.3. Dissolution tests
It is well known that wollastonite has the highest dissolution rate amongst the most-studied silicate bioceramics, and that this rate is often considered excessive. Wang et al showed that wollastonite was osteostimulative, but lacked osteoconductivity due to its rapid degradation [32]. After 10 weeks, W indeed lost more than 20 wt% of its mass, while G lost less than 10 wt%.
In our work, the dissolution rate was effectively controlled by controlling the AP40 glass filler amount in the composites content. AP40 glass has a moderate dissolution rate (as confirmed by the results in figure 5), therefore its addition as filler allows the formation of bioceramic composites with an additional degree of freedom to regulate the dissolution rate by modifying the relative amount of the silicate phases [15].
The dissolution of LG and HG was indeed intermediate between the values obtained for W and for G.
4.4. Mechanical testing of 3D-printed tablets
We can state that HG tablets had a mechanical strength slightly lower than G tablets, (5.9 MPa and 7.9 MPa Weibull strength, respectively) but their porosity was almost 30% higher (64% and 50% respectively). It is expected, in fact, that an increase in porosity corresponds to a decrease in strength, which can often be fitted with an exponential trend for ceramic materials: σ (P) = σ0 exp (-bP), where σ (P) is the strength, σ0 a constant related to the strength of the zero-porosity material, b another constant and P the porosity [33].
The absolute strength values measured were rather low, due to the high porosity present in the samples, making them only suitable for applications as non–load-bearing biomaterial components. These results for composition HG are, however, in the same range or higher than several values of flexural strength relative to biomaterials produced by powder-based 3D-printing reported in the literature. Recently, Inzana et al produced composites of calcium phosphate (composite of hydroxyapatite, Ca10(PO4)6(OH)2, and tricalcium phosphate, Ca3(PO4)2) and collagen which had a 3-points bending strength <0.1 MPa at porosities of 20–40% [34]. Chumnanklang et al measured a 3-points bending strength <1.5 MPa for hydroxyapatite samples with 60–65% porosity [35]. A much higher flexural strength was measured by Suwanprateeb et al for hydroxyapatite–wollastonite glass–ceramic composites, but in this case the total porosity was much lower; the authors reported a strength of 35.2 MPa for 30% porosity and 76.8 MPa for 2.5% porosity, when increasing the temperature up to 1300 °C [36].
The mechanical strength could be improved by decreasing the particle size of the raw materials (AP40 in particular) and/or by optimizing the heat treatment in order to increase the density of the strut of the samples.
4.5. In vitro assessment
Cells seeded on LG after 14 days exceeded significantly in number the cells seeded on HG.
For both samples the apoptotic assessment in combination with the viability and cytotoxicity assessment indicated that the materials allowed the cells to grow without causing an adverse reaction on them and that the long-term behavior tested here confirmed the absence of a cytotoxic effect from the materials on the cells over the 14 day period.
Further work will be necessary to assess the relationship between composition and biological behavior, taking into account that the release of ions [4, 37] and the changes in pH [38] related to the dissolution of silicate bioceramics have an important effect on cell growth, even though the role of silicon substitution in calcium phosphate ceramics is controversial [39].
Furthermore, a comparison with other biomaterials in terms of osteogenic markers and/or pre-clinical performance is needed to prove the capabilities of these materials for bone applications [40–42].
5. Conclusions
Mixtures of a preceramic polymer and fillers were successfully shaped into complex porous scaffolds by means of powder-based 3D-printing. The ceramic parts produced after heat treatment consisted of wollastonite, produced by the reaction of SiO2 deriving from the preceramic polymer and CaO from CaCO3 added as an active filler, and apatite–wollastonite derived from a glass powder added as inert filler. Solubility tests performed in TRIS-HCl demonstrated that the solubility could be regulated by the addition of the apatite–wollastonite inert filler and that the total dissolution increased with the amount of wollastonite. Samples printed in the form of tablets were highly porous (up to 64% total porosity) and had a low biaxial flexural strength (∼6 MPa). However, the use of these raw materials allowed the shaping of complex porous scaffolds having a high porosity (almost 80%) and comprising a designed ordered macro-porosity and micro-porosity in the struts.
Preliminary in vitro cell tests demonstrated that the materials were not cytotoxic and that cells grew well on their surface, forming an almost dense layer after two weeks. Future work will focus on understanding the relationship between the release of ions from the material and their effect on cell growth and attachment.
Acknowledgments
The authors would like to thank O Sanson for his valuable technical assistance on the 3D-printing and D Nicolaides for the ICP measurements.