

Abstract
Recent studies in spontaneously breathing subjects indicate the possibility of obtaining the alveolar fraction of exhaled breath condensate (aEBC). In critically ill mechanically ventilated patients, in whom microbial colonization of the upper airways is constant, collection of aEBC could considerably add to the ability of monitoring alveolar inflammation. We designed this study to test the feasibility of collecting aEBC in mechanically ventilated critically ill patients through a dedicated apparatus, i.e. a CO2 valve combined with a condenser placed in the expiratory limb of the ventilator circuit. We also aimed to assess the adequacy of the samples obtained by measuring different markers of oxidative stress and inflammation.
We enrolled 40 mechanically ventilated patients, 20 with and 20 without acute respiratory distress syndrome (ARDS). Measurements of respiratory mechanics, gas exchange and hemodynamics were obtained with a standard ventilator circuit after 30 min of aEBC collection and after inserting the dedicated collecting apparatus. Data showed that intrinsic positive end-expiratory pressure, peak and plateau pressure, static compliance and airway resistance (Raw) were similar before and after adding the collecting apparatus in both ARDS and controls. Similarly, gas exchange and hemodynamic variables did not change and 30 min collection provided a median aEBC volume of 2.100 and 2.300 ml for ARDS and controls, respectively. aEBC pH showed a trend toward a slight reduction in the ARDS group of patients, as opposed to controls (7.83 (7.62–8.03) versus 7.98 (7.87–8.12), respectively, p = 0.055)). H2O2 was higher in patients with ARDS, compared to controls (0.09 (0.06–0.12) μM versus 0.03 (0.01–0.09) μM, p = 0.043), while no difference was found in proteins content, 8-isoprostane, 4-hydroxy-2-nonhenal.
In conclusion, we demonstrate, in patients receiving controlled mechanical ventilation, that aEBC collection is feasible without detrimental effects on ventilator functioning, respiratory mechanics and gas exchange. In addition, we show that the sample obtained is appropriate for compounds analysis.
Export citation and abstract BibTeX RIS
Introduction
The analysis of the volatile and non-volatile constituents of exhaled breath condensate (EBC) is a non-invasive method to study oxidant markers [1, 2] and inflammatory mediators [3, 4] in the airway surface liquid. In spontaneously breathing healthy subjects [5] and patients [1, 3, 6], EBC can be collected with no discomfort and without complications. In mechanically ventilated patients with [7–9] and without [10, 11] lung injury, EBC has been obtained by placing home-made [8] or commercially available [7, 9–11] collecting devices in-line with the expiratory limb of the ventilator circuit.
Recent studies on spontaneously breathing healthy individuals [12, 13] and patients [14] indicate the possibility of obtaining the alveolar component of the overall EBC, namely alveolar EBC (aEBC). EBC fractionation was first obtained considering that after breathing out, 30% of the tidal volume (VT) of the exhaled air would come from the alveolar compartment (volume threshold) [14]. More recently, aEBC has been collected through a valve designed to fractionate the exhaled air according to the end-tidal carbon dioxide signal [12], identifying a 50% CO2 increase as a safe limit to consider the exhaled air completely alveolar. These studies also showed the concentration of biomarkers in the alveolar fraction to be quite different from the upper/medium airway fraction [12–14].
So far, all the studies performed on mechanically ventilated patients analyzed the whole (unfractioned) EBC [7–11]. In critically ill mechanically ventilated patients, however, the microbial colonization of the upper airways is constant and tracheobronchitis is common, being definitely more frequent than ventilator-associated pneumonia [15]. The possibility of separately collecting aEBC would considerably add to the ability of diagnosing and monitoring deep (alveolar) lung inflammation. We therefore modified the device previously utilized to obtain aEBC during spontaneous breathing [12] to sample during mechanical ventilation. Because collecting aEBC implies adding an external valve and circuitry to an expiratory limb, however, dynamic hyperinflation consequent to increased (expiratory) resistance might occur and affect ventilator functioning.
In this pilot study we test the feasibility of collecting aEBC in mechanically ventilated critically ill patients through a dedicated apparatus, i.e. a CO2 valve combined with a condenser, sited in the expiratory limb of the circuit of patients with lung injury. We also aim to assess the adequacy of the samples obtained by measuring different markers of oxidative stress and inflammation.
Materials and methods
Patients
The study was performed at the intensive care unit (ICU) of the University Hospital 'Maggiore della Carità' in Novara (Italy), between January 2013 and December 2013, according to the principles outlined in the Declaration of Helsinki. The protocol was approved by the local Ethics Committee, and written informed consent was obtained for all patients according to the Italian regulations.
We enrolled 20 consecutive patients with mild to moderate acute respiratory distress syndrome (ARDS) [16], and 20 control patients without ARDS and intubated for neurosurgery with planned postoperative ICU admission. ARDS is characterized by bilateral pulmonary infiltrates and hypoxemia in the absence of evidence for cardiogenic pulmonary edema. Mild ARDS identifies patients with a ratio of partial pressure of oxygen and fraction of inspired oxygen (PaO2/FiO2) between 200 and 300 mmHg, evaluated with a positive end-expiratory pressure (PEEP) or a continuous positive airway pressure (CPAP) value of 5 cmH2O or higher [16]. If PaO2/FiO2 is between 100 and 200 mmHg with PEEP of 5 cmH2O or higher, ARDS is defined as moderate, but is severe with a PaO2/FiO2 below 100 mmHg [16]. Exclusion criteria were: (1) age <18 years old; (2) history of immunosuppressive therapy; (3) chronic lung diseases; (4) hemodynamic instability, i.e. systolic arterial pressure <90 mmHg despite fluid repletion; (5) use of vasopressors, i.e. vasopressin, epinephrine at any dosage, norepinephrine >0.2 μg kg−1 min−1, and dopamine or dobutamine >5 μg kg−1 min−1; (6) life-threatening arrhythmias or electro-cardiographic signs of ischemia.
Predefined criteria for study interruption and resumption of ventilation with the standard circuit of the mechanical ventilator were: (1) hemodynamic instability, i.e. systolic arterial pressure <90 mmHg despite fluid repletion; (2) need for vasoactive agents, i.e. vasopressin, epinephrine at any dosage, norepinephrine >0.2 μg kg−1 min−1, and dopamine or dobutamine >5 μg kg−1 min−1; (3) life-threatening arrhythmias or electro-cardiographic signs of ischemia; (4) heart rate >120 per minute; (5) oxygen desaturation (SaO2 < 90%).
Measurements
Demographic data, simplified acute physiologic score (SAPS) II and lung injury score [17] (LIS) were recorded at the enrollment. Systolic and diastolic pressure, heart rate and oxygen saturation were continuously monitored throughout the study period. VT, respiratory rate (RR), inspiratory to expiratory ratio (I:E), extrinsic PEEP (PEEPe), peak inspiratory pressure (PPEAK) and FiO2 were obtained from the ventilator. Plateau pressure (PPLAT) was measured at the end of inhalation and prior to exhalation using an end-inspiratory occlusion. Intrinsic PEEP (PEEPi) was determined through an end-expiratory occlusion pause and subtracting that value to the PEEPe. Static compliance (CSTAT) was calculated as the ratio between VT and the difference between PPLAT and the total PEEP, i.e. PEEPe + PEEPi. Airway resistance (RAW) was calculated as the difference between PPEAK and PPLAT divided by the (constant) inspiratory flow. PaO2, partial pressure of carbon dioxide (PaCO2) and pH were assessed through arterial blood analysis. Peroxide dioxide (H2O2), pH, overall protein content, 8-isoprostane, 4-hydroxy-2-nonhenal (HNE), and amylase activity were measured in the aEBC.
Equipment
Patients received controlled mechanical ventilation by means of common ICU ventilators (Servo I, Maquet, Solna, Sweden; EVITA 4, Drager, Lübeck, Germany; Puritan Bennet 840, Covidien, Minneapolis, USA). The ventilator settings were those set by the ICU attending physicians. Temperature and humidification were maintained constant throughout the study protocol by means of an active humidifier (Fisher & Paykel Healthcare, Auckland, New Zealand).
The scheme of EBC collection is reported in figure 1. The CO2 sensor is inserted between the proximal end of the endotracheal tube and Y-piece of the ventilator circuit. While the inspiratory limb remains unmodified during aEBC collection, an additional piece composed by two 9 mm tubes connected in parallel is placed in the expiratory limb next to the Y-piece. One of the two 9 mm-tubes enters the condenser (Turbo DECCS System, Medivac, Parma, Italy) set at −5 °C, and is attached to a 50 ml falcon conical centrifuge tube. The CO2 valve (AAV14, Medivac, Parma, Italy) controls the opening and closing of the 9 mm-tubes. The time lag between the CO2 measurement and the switch of the valve is about 0.1 s. Based on the Fowler's model [18], a 50% increase in CO2 concentration (C50) is used to discriminate the anatomical dead-space air from the alveolar component of exhalation. As previously described [12] and depicted figure 1(A), below C50 the exhaled air enters channel 1 and is discarded. Above C50, channel 1 is excluded and the exhaled air passes into channel 2 and condenses in a TURBO-DECCS system (Medivac, Parma, Italy) (figure 1(B)). When the next inspiration starts, the inhaled air brings CO2 concentration down to zero and the system returns to the initial phase (channel 1 opened; channel 2 closed). All the materials used for aEBC collection are sterile and disposable, and tested for contamination (e.g. all the biomarkers used in this study + metals); the percentage of the recovery of albumin is guaranteed at low concentrations (<1 mg l−1). C50 is continuously calculated and adjusted by dedicated software along three complete respiratory cycles (auto-learning system).
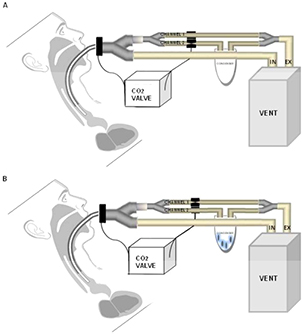
Figure 1. Schematic representation of the experimental design. (A) When CO2 concentration is below the 50% increase from the baseline, exhaled air enters channel 1 and is discarded. (B) When CO2 concentration is above the 50% increase, alveolar air is collected in the condenser.
Download figure:
Standard image High-resolution imageProtocol
During aEBC collection, the patient was maintained in a semi-recumbent position. A target of deep sedation was reached and neuromuscular blocking agents were administered before collection. All patients received constant-flow volume-targeted controlled mechanical ventilation with I:E, 1:2. A new sterile circuit made of polyvinilclorure replaced the circuit in use immediately before starting the study protocol. Arterial blood gases and respiratory mechanics were assessed with the standard circuit in place (T0STANDARD) and 30 min after placing the dedicated collection apparatus in the expiratory limb of the circuit (T30VALVE).
After inserting the dedicated collection apparatus, a recruiting manoeuvre was performed. Briefly, the ventilator was switched to CPAP mode increasing PEEP up to 30 cmH2O. This manoeuvre was sustained for 30 s [19]. Thereafter, the ventilator setting was switched back to volume-controlled mode with the same prior settings. aEBC was condensed for 30 min and then centrifuged, as previously described [20]; the total volume was immediately aliquoted and stored at −80 ◦C for further analysis.
aEBC analysis
We determined pH with a Metrohm electrode for microsamples (Metrohm Ltd, Herison, Switzerland) connected to a Radiometer pH-meter (pHM 240, Radiometer Analytical SAS, Villeurbanne Cedex, Lyon, France) after deaeration with argon for 10 min [21]. After deaeration (with the aim of removing EBC CO2 and obtaining a stable pH value), the pH value was stable for at least 5 min, despite potential contamination by environmental CO2. Calibration was verified with standard solutions at low ionic strength (0.001–0.1 M) [12]. Total proteins were measured by means of the commercially available Micro BCATM Protein Assay kit (Thermo Scientific, Rockford, IL, USA) with a limit of detection (LOD) of 0.5 mg l−1. HNE was measured by liquid chromatography tandem-mass spectrometry according to the method previously described [12]. The LOD was 0.01 nM. 8-isoprostane was measured by a specific enzyme-linked immunosorbent assay (EIA) (Cayman Chemical Company, Ann Arbor, MI, USA) with a LOD of 2.7 pg ml−1. H2O2 was measured using a commercial fluorimetric kit (Amplex Red assay, Invitrogen/Molecular Probes, Carlsbad, CA). The LOD was 0.02 μM. Amylase activity was determined with the EnzChek amylase fluorimetric assay (Molecular Probes, Eugene, OR).
Statistical analysis
Due to the relatively small sample size, non-parametric statistics were always used. Data are reported as median (interquartile range). To test independent samples, the Mann–Whitney's test was applied. The statistical analysis was performed with Prism 4.0 (Graphpad, La Jolla, CA), and a p value < 0.05 was considered significant.
Results
As shown in table 1, age, gender, weight and SAPS II on the day of the study entry were not significantly different between ARDS and controls, while the LIS [17] was significantly higher (p < 0.00 01) in ARDS patients than in controls (2.5 (2.25–3.00) versus 0.63 (0.44–0.75)).
Table 1. Patients' characteristics at enrolment. ARDS: acute respiratory distress syndrome; LIS: lung injury score; SAPS: simplified acute physiologic score. Groups were analyzed with the Mann–Whitney test and Fisher's exact test for ordinal and categorical variables, respectively.
| ARDS (n = 20) | Control (n = 20) | p | |
|---|---|---|---|
| Patients' characteristics | |||
| Age, yr, median (interquartile range) | 71 (66–78) | 66 (48–77) | 0.066 |
| Gender, male/female, n | 10/10 | 12/8 | 0.751 |
| Weight, Kg, median (interquartile range) | 70 (60–84) | 70 (65–80) | 0.7019 |
| SAPS II score, median (interquartile range) | 49 (37–59) | 42 (31–55) | 0.1262 |
| LIS, median (interquartile range) | 2.5 (2.25–3.00) | 0.63 (0.44–0.75) | <0.000 1 |
aEBC sampling was completed for all the patients. Figure 2 depicts airway pressure (PAW), flow and VT tracings obtained from two representative subjects, one from the ARDS group (left panel) and one from the control group (right panel), before and after inserting the dedicated collection apparatus to the expiratory limb of the ventilator circuit.

Figure 2. Examples of tracings from one representative patient in the acute respiratory syndrome (ARDS) group (left panels) and in the control group (right panels), with the standard ventilator circuit in place (T0STANDARD) and 30 min after inserting the dedicated collecting apparatus (T30VALVE). Airway pressure (Paw), flow, and tidal volume (VT), are displayed from top to bottom.
Download figure:
Standard image High-resolution image
As shown in table 2, PPEAK, PPLAT, PEEPi, CSTAT and PaO2/ FiO2 were significantly different between ARDS and controls. In both groups, however, none of these variables were significantly different between T0STANDARD and a T30VALVE. RAW, pHBLOOD, PaO2 and PaCO2 were similar between the two groups and remained unmodified after inserting the valve-condenser system.
VT was not significantly different between ARDS patients (6.7 (5.4–7.3) ml kg−1 of ideal body weight (IBW) and controls (7.1 (6.4–7.5) ml Kg−1 of IBW). PEEPe and RR were higher in the ARDS group of patients (10 (10–8) cmH2O and 21 (14–27) breath min−1, respectively), as opposed to controls (5 (5–8) cmH2O and 14 (12–16) breath min−1, respectively).
aEBC volume was similar between ARDS and the control group, respectively 2.1 and 2.3 ml (p = 0.33). As presented in table 3, the alveolar pH showed a trend toward a slight reduction in the ARDS group of patients, as opposed to controls (7.83 (7.62–8.03) vs 7.98 (7.87–8.12), respectively, p = 0.055). H2O2 was significantly higher in patients with ARDS, compared to controls (0.09 (0.06–0.12) μM versus 0.03 (0.01–0.09) μM, p = 0.043). We found no difference in the alveolar content of proteins, 8-isoprostane, and HNE (table 2).
Table 2. Respiratory variables at T0STANDARD and at T30VALVE. T0STANDARD: variables recorded during mechanical ventilation with the standard circuit; T30VALVE: variables recorded after inserting the dedicated collection apparatus sited in the expiratory limb of the circuit and ventilating for 30 min. Data are expressed as median (interquartile range).
| Respiratory variables | ARDS (n = 20) | Control (n = 20) | ||
|---|---|---|---|---|
| T0STANDARD | T30VALVE | T0STANDARD | T30VALVE | |
| PEEPi (cmH2O) | 1 (0–2) | 1 (0–1) | 0 (0–1) |
0 (0–1) |
| PPLAT (cmH2O) | 23(20–27) | 23(20–26) | 15(13–18) |
15(12–17) |
| PPEAK (cmH2O) | 30 (27–36) | 29(26–34) | 21(18–24) |
21(17–23) |
| CSTAT (l/cmH2O) | 43 (30–48) | 43 (29–50) | 53 (45–73) |
58 (48–83) |
| RAW (cmH2O/l/s) | 12 (9–14) | 12 (10–16) | 10 (8–14) | 11 (8–14) |
| RR (breaths/min) | 21 (14–27) | 20 (14–26) | 14 (12–16) |
14 (12–15) |
| Tidal volume (ml) | 480 (393–508) | 480 (393–518) | 500 (450–540) | 500 (450–540) |
| PEEPe (cmH2O) | 10 (8–10) | 10 (8–10) | 5 (5–8) |
5 (5–8) |
| pHBLOOD | 7.40 (7.37–7.48) | 7.42 (7.35–7.46) | 7.43 (7.38–7.44) | 7.44 (7.39–7.47) |
| PaO2/FiO2 (mmHg) | 152 (125–207) | 181 (144–237) | 329 (271–329) |
305 (260–393) |
| PaO2 (mmHg) | 76 (70–97) | 89 (76–95) | 90 (79–105) | 80 (73–100) |
| PaCO2 (mmHg) | 39 (36–42) | 40 (36–43) | 39 (37–40) | 40 (36–43) |
ARDS, acute respiratory distress syndrome; CSTAT, static compliance; PEEPe, estrinsic positive end-expiratory pressure; PEEPi, intrinsic positive end-expiratory pressure; PPLAT, plateau pressure; PPEAK, peak inspiratory pressure; PaO2/FiO2, ratio of partial pressure of arterial oxygen and fraction of inspired oxygen; PaCO2, partial pressure of carbon dioxide; RAW, airway resistance; RR, respiratory rate. Two-way Anova with Bonferroni post hoc test. ap < 0.01, ARDS vs. Group at T0STANDARD bp < 0.001; ARDS vs. Control at T0STANDARD; cp < 0.001, ARDS vs. Control at T30VALVE.
Table 3. Alveolar EBC markers. All data are presented as median (interquartile range). Mann–Whitney test has been applied. ARDS: acute respiratory distress syndrome; H2O2: hydrogen peroxide; HNE: hydroxynonenal.
| ARDS (n = 20) | Control (n = 20) | p | |
|---|---|---|---|
| Alveolar EBC | |||
| pH, median (interquartile range) | 7.83 (7.62–8.03) | 7.98 (7.87–8.12) | 0.053 |
| H2O2 (μM) | 0.09 (0.06–0.12) | 0.03 (0.01–0.09) | 0.043 |
| Proteins (μg mL−1) | 0.5 (0.25–1.74) | 1.3 (0.25–2.1) | 0.280 |
| 8-isoprostane (pg ml−1) | 5.2 (3.41–6.62) | 4.96 (2.81–7.17) | 0.877 |
| HNE (nM l−1) | 3.79 (1.01–8.57) | 1.73 (1.04–3.98) | 0.445 |
Not shown in the table, α-amylase activity was, in all samples, inferior to the LOD (1 mU ml−1), i.e. lower by a factor > 10−5 as compared to α-amylase activity measured in saliva (100–200 Uml−1), and NH4+ concentration in our EBC samples was always below 10 microM.
All the solutes we measured in EBC were not detectable in humidifier fluid and its pH mean value was 7.09.
Discussion
Our study shows that in patients invasively ventilated in controlled mode (1) aEBC can be collected without affecting respiratory mechanics and arterial gas exchange; (2) 30 min of sampling is adequate for volume and quality obtained.
aEBC, while certainly containing more alveolar components than other EBC fractions, still travels through the upper airways and likely contains mediators contributed from those airways, thus it is still not purely 'alveolar'. However aEBC represents a valid compromise between accuracy and invasiveness of alveolar fluid sampling procedures. Furthermore, although in our study a contamination of upper airways is avoided, the absolute value of pH as a biomarker should be cautiously interpreted, as it depends in a complex manner by CO2 not eliminated with deaeration and EBC ionic composition. However, very recently some authors suggested a promising approach to standardize pH measures, based on measurement with a blood-gas analyzer and standardization of pH [22], which will be considered in further studies dealing with EBC pH.
Few works have recently investigated the possibility to fractionate EBC to separate the alveolar component. aEBC has been analyzed in spontaneously breathing healthy volunteers [12–14], chronic obstructive pulmonary disease patients [13] and asthmatic children [14]. We decided to test aEBC collection in ARDS patients because alveolar inflammation is the hallmark of this disease. The activation of endothelium [23], the neutrophil and macrophage infiltration with the release of many inflammatory mediators and the reactive oxygen spices formations [24] lead to the mechanical derangements of ARDS lung [25–27]. One could expect the addition of the dedicated collection apparatus to the expiratory limb of the ventilator to determine an increase of expiratory Raw and development of dynamic hyperinflation and PEEPi. Indeed, as shown in the tracings of the representative patients shown in figure 2 and confirmed by the unmodified values of respiratory mechanics (table 2) these detrimental effects did not take place. As proof of concept, we measured the ohmic resistance of the standard circuit connected to a test balloon. We set the ventilator with RR 16 breath min−1, I:E ratio 1:2, and VT 250, 500 and 750 ml. Then we made the same measurements after insertion of the collection apparatus in the inspiratory limb of the closed circuit channel. Significantly, the values of RAW were no different with and without the additional apparatus. Also, setting the ventilator with VT 500 ml and I:E ratio 1:2, we progressively increased RR by 2 breaths min−1 step-ward increases and observed that, regardless of the circuit, PEEPi was not present up to 32 breaths min−1.
The pH of EBC is the product of a balance between several buffer systems and the release of acids in the airways [28]. In the whole EBC airway acidity is a marker of lung inflammation in several lung conditions such as chronic obstructive pulmonary disease [29] and asthma exacerbations [29, 30], cystic fibrosis [31], bronchiectasis [29] and acute lung injury [7, 8, 32–35]. Our results on the alveolar fraction seem to confirm the same tendency. However, we have discussed some limitations of pH in EBC independently on the method of collection [12] and the result should be cautiously interpreted. On the other hand, the fractionation of exhaled breath in ventilated subjects completely avoids possible perturbation factors arising from the upper airways and the airway dead-volume [36].
Similarly, H2O2 is a marker of oxidative stress and is released from neutrophils and eosinophils and from macrophages and epithelial cells in inflammatory processes as during ARDS [32, 37]. The modest but significant H2O2-EBC increase indicates that EBC may be used to detect oxidative stress and/or inflammation products of the lower airways also in ventilated patients. As already observed, the fractionation may slightly reduce H2O2-EBC levels in EBC but increase its specificity [12], and it may explain some discrepancies with previous literature in terms of absolute effect [38].
Our study has limitations that deserve discussion. First, we used the 50% increase of CO2 concentration as already proposed to discriminate between dead-space and alveolar fractions of exhaled air; this assumption could be challenged by the turbulent air motion that highly influences its composition and mixing during the expiration. Second, our controls were patients intubated for neurosurgery with planned postoperative ICU admission. It has been shown in brain-injured patients with no lung injury or sepsis that the presence of subtle pulmonary inflammation is detectable by unfractioned EBC [10]. We cannot exclude that the same could occur in postoperative neurosurgical patients. Furthermore, mechanical ventilation itself is known to determine changes in pH and nitrogen oxide concentrations in the unfractioned EBC [11]. In our study, we used low VTs in both groups to avoid the risk of ventilator-induced lung injury, which may potentially add to the inflammatory lung response. Third, active humidification was present in all patients throughout the whole study protocol. In many studies [8, 10, 11] collecting whole EBC in mechanically ventilated patients, humidification was removed for 30–60 min. Although the humidification system may contribute to substantially dilute the EBC, thereby reducing the differences in compounds, we chose to conditionate and humidificate the inhaled air to avoid the adverse effects caused by dry gas on airway mucosa during mechanical ventilation [39–41].
Some authors have suggested a dilution factor of about 10 000 between EBC and blood. One possibility to overcome this limitation would be finding a suitable dilution marker—a compound that has a known and stable concentration in blood which diffuses through the cell membranes, but is not produced in the alveoli or airways. It needs to be pointed out that the dilution of non-volatile biomarkers by water vapor may vary, but to date, there is no gold standard for assessing the dilution of airway lining fluid biomarkers in the EBC since none of the putative biomarkers (urea, conductivity, etc) have been properly validated [42, 43].
Furthermore, we are aware that in other studies involving different types of lung injury, exhaled pH values in severely ill patients were lower than those found in this study [34], but when an adapter for mechanically ventilated patients was used (as we did), pH measurements were similar to our results [11].
Conclusion
In conclusion, our study demonstrates that in patients receiving controlled mechanical ventilation for mild or moderate ARDS as well as for patients without ARDS, aEBC collection is feasible without detrimental effects on ventilator functioning, respiratory mechanics and gas exchange. In addition, we show that the sample obtained is appropriate for compounds analysis. Since aEBC sampling is noninvasive, repeatable, and applicable to the ventilators most commonly used in ICU, our data suggest the possibility of monitoring alveolar inflammation in mechanically ventilated patients.
Acknowledgments
TURBO-DECCS system and AAV14 valve were kindly supplied by Medivac, Parma, Italy.
This study was supported by the National Institute of Foreign Trade (ICE), AGAVE Project, Research Project N. 01, ICE, Protocol N. 968 del 10/10/2008.
RV, LC, SP, UF, FC, FL, and FDC have no conflict of interest.
PN research laboratory has received equipment and grants from Maquet Critical Care and Intersurgical S.p.A. PN also received honoraria/speaking fees from Maquet Critical Care, Covidien AG, Breas, Hillrom and Linde AG.
MG, MC, AM, PN have worked on the development of AAV14 valve (Medivac, Parma, Italy). Patent license n° 0001407168, issued 28th March 2014.