

Abstract
Understanding the impacts of volcanic eruptions on the atmospheric circulations and surface climate in the extratropics is important for inter-annual to decadal climate prediction. Previous studies on the Northern Hemisphere climate responses to volcanic eruptions have shown that volcanic eruptions likely induce northern Eurasian warming through the intensified Arctic polar vortex in the stratosphere and the positive phase of Arctic Oscillation/North Atlantic Oscillation in the troposphere. However, large uncertainties remain and the detailed physical processes have yet to be determined. The circulation responses in the Southern Hemisphere also remain controversial with large differences between the observed and model-simulated results. In this paper, we review previous studies on the extratropical circulation and surface climate responses to volcanic eruptions and update our understanding by examining the latest observational datasets and climate model simulations. We also propose new insights into the crucial role of the latitude of volcanic eruptions in determining the extratropical circulation changes, which has received less attention. Finally, we discuss uncertainty factors that may have important implications to the extratropical circulation responses to volcanic eruptions and suggest future directions to resolve those issues through systematic model experiments.
Export citation and abstract BibTeX RIS

Original content from this work may be used under the terms of the Creative Commons Attribution 4.0 license. Any further distribution of this work must maintain attribution to the author(s) and the title of the work, journal citation and DOI.
1. Introduction
Tropical explosive volcanic eruptions can trigger the worldwide spread of sulfate aerosols oxidized from sulfur dioxide and scatter incoming solar radiation in the lower stratosphere, inducing global cooling in the troposphere (Robock and Mao 1995, Robock 2000). As opposed to the overall tropospheric cooling, sulfate aerosols absorb near-infrared terrestrial radiation and induce localized heating in the tropical lower stratosphere (Lacis et al 1992, Stenchikov et al 1998). This enhances pole-to-equator temperature gradient in the upper troposphere and lower stratosphere, affecting atmospheric circulations. At the surface, tropical volcanic eruptions decrease global land precipitation particularly over summer monsoon regions in both the Northern Hemisphere (NH) and Southern Hemisphere (SH) (Trenberth and Dai 2007, Joseph and Zeng 2011, Iles and Hegerl 2014, Paik et al 2020, 2022).
The volcanic eruptions also influence on climate variability modes in varying time scales. They include the Arctic Oscillation/North Atlantic Oscillation (AO/NAO) (Stenchikov et al 2002), El Niño-Southern Oscillation (ENSO) (Adams et al 2003), and Atlantic Multidecadal Oscillation (Otterå et al 2010). In particular, positive AO/NAO and El Niño-like responses to volcanic eruptions have been widely reported (Swingedouw et al 2017, McGregor et al 2020, Marshall et al 2022). However, such responses exhibit large uncertainty. Recent modelling studies for instance showed inconsistent AO/NAO phase following tropical volcanic eruptions (e.g. Zambri and Robock 2016, Polvani et al 2019, Azoulay et al 2021, Coupe and Robock 2021). Likewise, southern annular mode (SAM) responses to volcanic eruptions were found unclear with substantial discrepancies between the observations and climate model simulations (e.g. Barnes et al 2016, McGraw et al 2016).
While explosive volcanic eruptions majorly occurred in the tropics during the 20th century (e.g. 1963 Agung, 1982 El Chichón, and 1991 Pinatubo eruptions), they had occasionally occurred in mid- to high-latitudes (e.g. 1783 Laki, 1912 Novarupta eruptions). Unlike tropical volcanic eruptions, extratropical volcanic eruptions retain most of stratospheric volcanic aerosols in the hemisphere of eruptions due to the stratospheric circulation (Oman et al 2005, Gao et al 2008). It leads to a greater scattering of incoming solar radiation in the relevant hemisphere, producing distinctly different climate responses from the tropical volcanic eruptions (e.g. Oman et al 2005, Stevenson et al 2016, Zuo et al 2018). However, there might be similarity in climate responses to tropical and extratropical volcanic eruptions (Ward et al 2021), as tropical volcanic eruptions can have asymmetric inter-hemispheric aerosol loadings e.g. 1963 Agung, 1982 El Chichón eruptions (Sato et al 1993). However, their similarities or differences in the AO/NAO and SAM and resultant surface climate changes have not been thoroughly examined.
In the present review, we revisit the impacts of volcanic eruptions on the tropospheric and lower stratospheric atmospheric circulations in the extratropics by considering both NH and SH responses, and summarize the proposed physical mechanisms by analyzing the latest observations (utilized in IPCC 2021), reanalysis datasets, and multiple climate model simulations. We also discuss the importance of the latitude of volcanic eruptions by examining multi-ensemble single model simulations. General discussions, conclusions, and perspectives in future opportunities are given at the end of the review.
2. AO/NAO, Arctic polar vortex and Eurasian winter surface temperature responses
2.1. Observational evidence
Robock and Mao (1992) and Perlwitz and Graf (1995) were one of the most pioneering studies, reporting boreal-winter (December to next year February, DJF) surface warming in the NH extratropics after historical volcanic eruptions. Such warming was suggested to occur via strengthened westerly winds resulting from an enhanced pole-to-equator temperature gradient in the upper troposphere and lower stratosphere. Supporting their findings, Stenchikov et al (2006) found an enhanced Arctic lower stratospheric polar vortex (hereafter Arctic polar vortex), positive NAO and Eurasian warming in the two consecutive winters after volcanic eruptions from Met Office Hadley Centre/Climatic Research Unit global surface temperature version 2 (Jones and Moberg 2003), Hadley Centre Sea Level Pressure dataset (HadSLP) version 1 (Basnett and Parker 1997), and National Centers for Environmental Prediction/National Center for Atmospheric Research reanalysis (NCEP1; Kalnay et al 1996) data. Driscoll et al (2012) later found the same results from 20th Century Reanalysis version 2 (20CRv2; Compo et al 2011) and 45 year second-generation reanalysis from the European Centre for Medium-Range Weather Forecasts (ERA40; Uppala et al 2005). By examining the 1883 Krakatau and 1991 Pinatubo eruptions with the 20CRv2 and ERA40, Zambri and Robock (2016) also reported an enhanced Arctic polar vortex, positive NAO and northern Eurasian warming, which are statistically significant at 10% level, in the first DJF following volcanic eruptions. Based on climate reconstruction dataset, Fischer et al (2007) provided the evidence of positive NAO and corresponding northern European surface warming and wetting in the DJF following volcanic eruptions in the last half-millennium period. Ortega et al (2015) also showed the emergence of positive NAO in response to strong volcanic eruptions in the last millennium. However, Swingedouw et al (2017) indicated that NAO response to volcanic eruptions in the instrumental era (1883 Krakatau, 1902 Santa María, 1963 Agung, 1982 El Chichón and 1991 Pinatubo eruptions) is not significantly detected, raising the uncertainty of tropospheric circulation responses to volcanic eruptions.
Given the importance of AO/NAO to atmospheric variability in the extratropics, the AO/NAO responses to volcanic eruptions are briefly updated in figure 1 using the latest observations and reanalysis data. The HadSLP version 2 (Allan and Ansell 2006), the Cowtan and Way data version 2.0 (Cowtan and Way 2014), and ERA5 reanalysis (Hersbach et al 2020) are utilized for sea level pressure, near-surface air temperature, and 10 hPa zonal wind, respectively. These datasets have advantages in both spatio-temporal coverage and reliability than the datasets used in previous studies. The ERA5 for instance presents better performance in several aspects with higher resolution than NCEP1, 20CRv2 and ERA40 (Hersbach et al 2020).
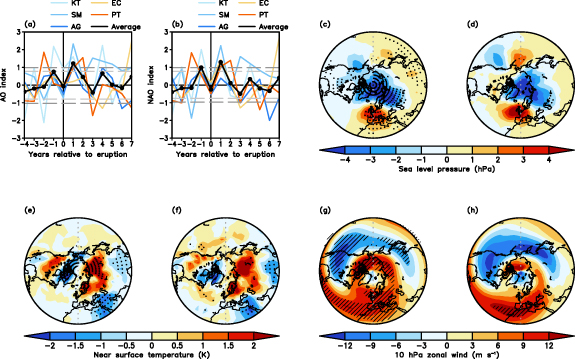
Figure 1. Time series of boreal winter (December to next year February average, DJF) (a) Arctic Oscillation (AO), (b) North Atlantic Oscillation (NAO) index before and after volcanic eruptions from five volcanic eruptions in the historical period. The year 0 denotes the last DJF before the eruptions. The anomalies relative to pre-eruption five year averages are shown. Here, five historical eruptions are 1883 Krakatau (KT; light sky blue), 1902 Santa María (SM; sky blue), 1963 Agung (AG; blue), 1982 El Chichón (EC; yellow), and 1991 Pinatubo (PT; orange). Light and dark gray dashed lines represent 95% and 99% confidence intervals, respectively, for five-case composites based on a Monte Carlo analysis (see text S1). Spatial patterns of (c), (d) sea level pressure, (e), (f) near-surface temperature, and (g), (h) 10 hPa zonal wind responses at first DJF (i.e. season commences after the eruptions) averaged over (c), (e), (g) all five eruptions, and (d), (f), (h) two strongest eruptions (1883 KT and 1991 PT eruptions), relative to pre-eruption five year averages. Black dots and hatchings indicate that the responses are statistically significant at 5% level based on a Student's t-test.
Download figure:
Standard image High-resolution imageFigures 1(a) and (b) illustrate the time series of AO and NAO indices in DJF from pre- to post-eruption years for individual volcanic eruptions in the historical period and their average. Here, AO is defined as the first empirical orthogonal function mode of detrended DJF sea level pressure anomalies over the north of 20°N using HadSLP version 2. The NAO is defined same as AO but over 20°W–80°E and 20–80°N. These statistical approaches, instead of simple methods based on sea level pressure difference between the two points, are adopted to consider large-scale atmospheric circulation pattern. Results show the emergence of positive AO and NAO in the first DJF after volcanic eruptions, except for 1963 Agung and 1982 El Chichón eruptions which exhibit only positive AO (insignificant NAO) and NAO (insignificant AO) response, respectively. These results present more robust AO/NAO responses to the historical volcanic eruptions than those reported by Swingedouw et al (2017), and highlight the importance of datasets and analysis methods to improve the signal-to-noise ratio.
Figures 1(c)–(h) present spatial patterns of sea level pressure, near-surface temperature, and 10 hPa zonal wind responses averaged over all five historical eruptions or two strongest eruptions (i.e. 1883 Krakatau and 1991 Pinatubo eruptions), relative to five year averages before the eruptions. They robustly reveal positive AO/NAO, northern Eurasian warming, and Arctic polar vortex enhancement in the first DJF after volcanic eruptions, confirming previous studies (e.g. Stenchikov et al 2006, Zambri and Robock 2016). Nevertheless, these responses are mostly insignificant when analyzing only two strongest cases (figures 1(d), (f) and (h)), although stronger responses than other cases are anticipated (Bittner et al 2016a, Zambri and Robock 2016, ). These results indicate the presence of the uncertainty or nonlinearity of extratropical circulation responses to volcanic eruptions, possibly due to the small sample size (Bittner et al 2016a).
2.2. Physical mechanisms
Many studies have attempted to detect and understand NH-winter AO/NAO response to volcanic eruptions. Based on the Atmospheric Model Intercomparison Project model analyses, Mao and Robock (1998) suggested that warming over the NH high-latitude continents in response to the 1982 El Chichón eruption likely resulted from the enhanced Arctic polar vortex and its downward propagation to the troposphere. Otterå (2008) and Marshall et al (2009) also found similar results for the 1991 Pinatubo eruption from two different models. Their results were consistent with Stenchikov et al (2002) who reported a close relationship between the positive AO response to the 1991 Pinatubo eruption and the strengthened Arctic polar vortex in the perturbation model experiments.
The driving mechanism of Arctic polar vortex intensification after strong volcanic eruptions (e.g. figure 1(g)) has been examined by conducting climate model simulations. Stenchikov et al (2002) proposed that polar stratospheric cooling by ozone depletion through photochemical reactions can strengthen the Arctic polar vortex. They also suggested that the reduced meridional temperature gradient in the troposphere, which results in weak planetary-scale wave activities, may help the polar vortex intensification. In contrast, Toohey et al (2014) highlighted the importance of the enhanced stratospheric residual circulation in the polar vortex intensification after the 1991 Pinatubo eruption. Bittner et al (2016b) attributed the polar vortex enhancement after the 1815 Tambora eruption to anomalous subtropical westerlies which induce an equatorward wave propagation and Eliassen-Palm (EP) flux divergence (strengthening of polar vortex) in the NH high-latitudes.
The above mechanisms are briefly updated in figure 2 using the latest climate model simulations. Both the coupled model intercomparison project phase 6 (CMIP6; Eyring et al 2016) and the last millennium simulations of the Community Earth System Model Last Millennium Ensemble (CESM-LME; Otto-Bliesner et al 2016) are utilized. While CMIP6 provides multiple climate model simulations for the historical period (1850–2014), CESM-LME allows to analyze multiple tropical volcanic eruptions occurred during the last millennium with a large ensemble size. A total of 192 ensembles from 26 CMIP6 models are analyzed (table S1). The CESM-LME simulation consists of 17 ensemble members, 12 and 5 of them being integrated with all external forcings and volcanic forcing only, respectively.
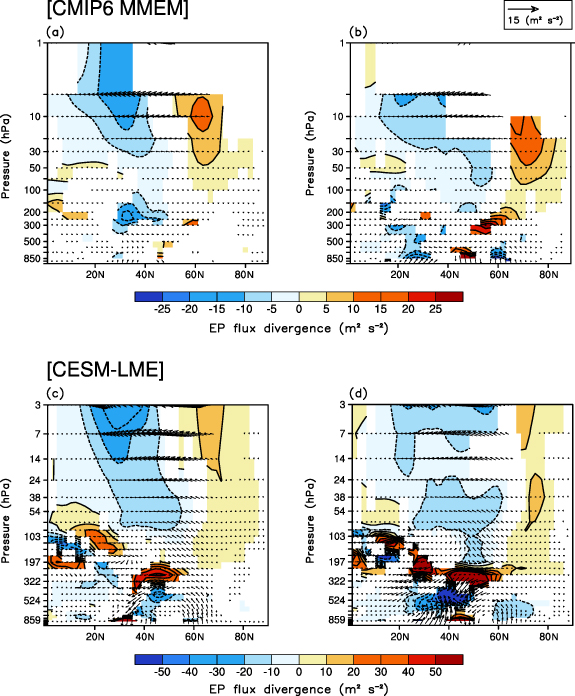
Figure 2. Eliassen-Palm (EP) flux anomalies (vectors) and their divergence (shading) averaged for (a), (b) the 1883 Krakatau and 1991 Pinatubo eruptions, (c), (d) last millennium five tropical volcanic eruptions from (a), (b) CMIP6 multi-model ensemble mean (MMEM) and (c), (d) CESM-LME simulation mean. Anomalies are shown relative to pre-eruption five year averages in the first (commences after the eruptions occur) (a), (c) October–November and (b), (d) December to next year February, only where the values are statistically significant at 5% level based on a Monte Carlo analysis (see text S1).
Download figure:
Standard image High-resolution imageFigure 2 illustrates EP flux anomalies in the first October–November and DJF following the two strongest tropical volcanic eruptions in the historical period (i.e. 1883 Krakatau and 1991 Pinatubo eruptions; top row) from CMIP6 model simulations and those following the five strongest tropical volcanic eruptions in the last millennium period from CESM-LME simulation (bottom row). Here, only five tropical volcanic eruptions are selected in the last millennium by excluding northern- and southern-extratropical volcanic eruptions (see figures S1(a) and (b), Fasullo et al 2019), which are defined as the eruptions presenting the largest interhemispheric shortwave perturbation differences (see below).
Both CMIP6 and CESM-LME simulations show an equatorward wave propagation in the stratosphere, which potentially results from the enhanced westerly in the subtropical stratosphere (figures S1(d) and (e)). The volcanic aerosols-induced heating in the tropical lower stratosphere strengthens pole-to-equator temperature difference in the upper troposphere and lower stratosphere (gray contours in figures S1(d) and (e)) which in turn strengthens the subtropical westerlies through the thermal wind balance. The enhanced subtropical westerly allows Rossby waves to propagate deep into the tropics by shifting the critical latitude equatorward. The resultant EP flux divergence in NH high-latitudes (figure 2) may contribute to Arctic polar vortex strengthening. This result supports the physical mechanism suggested by Bittner et al (2016b). Since many CMIP6 models have a high-top configuration with the model top above 50 km (table S1; Chen et al 2021, IPCC 2021), the same analyses are repeated with high-top models which may better represent stratospheric processes. High-top models show essentially the same results as those of full models (figure S2). It should be, however, noted that previous studies have found little improvement for high-top models in simulating extratropical circulation responses to volcanic eruptions (Marshall et al 2009, Charlton-Perez et al 2013, Polvani and Camargo 2020). The analyses of the 1815 Tambora eruption, to be compared with Bittner et al (2016b), also present similar results (figure S3), demonstrating the robustness of the results. It is noteworthy that Stenchikov et al (2002) indicated that the increased pole-to-equator temperature difference in the upper troposphere and lower stratosphere may not be a necessary condition for Arctic polar vortex intensification. They alternatively proposed a bottom-up mechanism relating the polar vortex intensification with a weakened vertical wave propagation in the NH mid-latitudes. However, EP flux in figure 2 does not show a weakened vertical wave propagation in the middle troposphere, not supporting Stenchikov et al (2002).
The Arctic polar vortex intensification following tropical volcanic eruptions could drive a positive AO in the troposphere through the downward coupling on the sub-seasonal time scale (Baldwin et al 2021). Daily events with strong Arctic polar vortex occur more frequently at the first winter after historical tropical volcanic eruptions compared to pre-eruption winters (figure 3(a)) in CMIP6 model simulations. Composite analysis reveals that strong polar vortex anomalies tend to propagate downward from the lower stratosphere to the troposphere (figure 3(b)), as discussed in Baldwin and Dunkerton (2001) and Thompson et al (2002). It explains a significant correlation between 10 hPa zonal wind and AO index anomalies (p-value = 0.01) (figure 3(c)). In figure 3(c), many winters from 26 CMIP6 models are found in the first quadrant. This result, i.e. anomalously strong Arctic polar vortex and positive AO, suggests that the historical volcanic eruptions may affect the NH mid- to high-latitude surface climate by modulating the Arctic polar vortex and its downward coupling in the first DJF after the eruptions as proposed by Robock and Mao (1992) and Perlwitz and Graf (1995). Consistent results are also obtained from CESM-LME simulation (figures 3(d)–(f)) and subset of high-top CMIP6 models (figure S4), supporting the reliability of the physical pathway.

Figure 3. Analysis of strong Arctic polar vortex events using (a)–(c) CMIP6 and (d–f) CESM-LME simulations. (a) Probability ratio of strong lower stratospheric Arctic polar vortex events (60°N–70°N averaged daily 10 hPa zonal wind anomalies; relative to pre-eruption five year averages), which are defined as the days with 1.645 standard deviation or greater in each calendar day corresponding to the 90% confidence interval, during the first post-eruption and pre-eruption five years December to next year February (DJF) from CMIP6 individual models (sky blue bars) and multi-model ensemble mean (MMEM; blue bar) for the 1883 Krakatau and 1991 Pinatubo eruptions. Horizontal black line indicates equal probability ratio between post- and pre-eruption DJFs; (b) vertical profile of normalized (divided by standard deviation of inter-annual variabilities in each calendar day) daily zonal wind anomalies averaged over 60°N–70°N, relative to pre-eruption five year averages, from −30 to +60 d with respect to the strong Arctic polar vortex events. Day 0 represents the initial date of the selected strong Arctic polar vortex events; (c) scatterplot of 10 hPa zonal wind anomalies averaged over 60°N–70°N (x-axis; normalized for each model through divided by standard deviation obtained from 1871 to 2000) and AO index anomalies (y-axis), relative to pre-eruption five year averages, at the first DJF from individual CMIP6 models (open circles; ensembles averaged) and MMEM (filled circle). Linear regression line and correlation coefficient (top-right corner) derived from all samples are presented together; (d) Tropical volcanic eruptions probability density functions of normalized (divided by standard deviation of inter-annual variabilities in each calendar day) daily 10 hPa zonal wind anomalies averaged over 60°N–70°N during the first post-eruption DJF (red), relative to pre-eruption five year averages, and five pre-eruption DJFs (black) from CESM-LME simulation; (e) and (f) same with (b) and (c), respectively, but for last millennium tropical volcanic eruptions from CESM-LME simulations and under stronger Arctic polar vortex events (zonal wind for at least five days positively beyond the 95% confidence interval in each calendar day during the first DJF to tropical volcanic eruptions).
Download figure:
Standard image High-resolution image2.3. Uncertainties of climate model simulations
There is a large uncertainty in the NH surface climate response to volcanic eruptions in climate models, possibly due to inter-model difference in volcanic forcings as well as dynamical-physical processes. Stenchikov et al (2006) reported that CMIP3 models (Meehl et al 2007) show too weak AO and Eurasian surface air temperature responses. Driscoll et al (2012) also reported that CMIP5 models (Taylor et al 2012) do not robustly reproduce the observed NH mid- to high-latitude climate responses to volcanic eruptions. Charlton-Perez et al (2013) presented the consistent result by analyzing the subset of high-top CMIP5 models. Using the multi-models that participated in the Paleoclimate Modeling Intercomparison Project phase 3 (PMIP3; Braconnot et al 2012), Swingedouw et al (2017) reported that the models do not consistently show positive NAO anomalies after strong volcanic eruptions during the last millennium. Unlike these studies, Zambri and Robock (2016) found positive AO response in the first DJF to the two strongest historical volcanic eruptions, i.e. 1883 Krakatau and 1991 Pinatubo, in CMIP5 models. Barnes et al (2016) also reported Arctic polar vortex enhancement to the 1991 Pinatubo eruption in CMIP5 models.
These studies suggest that surface responses to volcanic eruptions, either via direct effect or indirect effect through the Arctic polar vortex intensification, are still uncertain in climate models. Such uncertainty was further emphasized by recent studies with the latest climate models including CMIP6 models. For instance, Polvani and Camargo (2020) reported the absence of Eurasian winter warming after the 1883 Krakatau eruption in the low-top and high-top models with fine vertical resolution in the stratosphere. By analyzing large ensemble simulations, they indicated that the observed Eurasian winter warming to the 1883 Krakatau eruption may not be related to volcanic eruption. Polvani et al (2019) also showed that Arctic polar vortex enhancement and Eurasian winter warming after the 1991 Pinatubo eruption are not well captured by climate models due to strong internal variability. Analyzing 1991 Pinatubo eruption simulations from six climate models participating in the Model Intercomparison Project on the climatic response to Volcanic forcing (VolMIP; Zanchettin et al 2016), Zanchettin et al (2022) reported that climate models generally do not show positive NAO after volcanic eruptions. In contrast to these studies, Zambri et al (2017) found Eurasian winter warming in the first DJF to ten strongest last millennium volcanic eruptions in PMIP3 multi-models and CESM-LME. The ensemble mean of five decadal climate prediction models also showed positive NAO and associated northern Eurasian winter warming to the 1963 Agung, 1982 El Chichón and 1991 Pinatubo eruptions, albeit weaker than the observations (Hermanson et al 2020). Recently, Liu et al (2020) also found lower stratospheric tropical warming and Arctic polar vortex enhancement after the five largest historical tropical volcanic eruptions in CMIP6 models.
To understand varying model responses to volcanic eruptions, the possible factors that determine the uncertainty need to be explored. The varying magnitude of volcanic eruptions (Dhomse et al 2020), differing model mean state (Zanchettin et al 2012), and small ensemble size (Bittner et al 2016a) could possibly induce different climate responses across the models, enlarging discrepancies between the observations and models. In regard of volcanic forcing, Azoulay et al (2021) proposed a threshold behavior, sulfur injections of 10 Tg, approximately corresponding to the 1991 Pinatubo eruption, being a threshold for Arctic polar vortex and surface climate responses. DallaSanta and Polvani (2022) further suggested that statistically significant Eurasian winter warming can be obtained with sulfur injections of at least 20 Tg. However, they showed that the forced signal barely exceeds the internal variability even with 160 Tg of sulfur injected, which is considerably greater than any volcanic eruptions known to have occurred in the past 2000 years. The large-scale environments could also play a critical role in shaping the circulation response to volcanic eruptions. Coupe and Robock (2021) for instance suggested that Eurasian winter warming after volcanic eruption can be explained only when observed El Niño-like equatorial Pacific Ocean variations are considered in the model.
The varying circulation responses to historical volcanic eruptions in NH winter are examined in figure 4 by using CMIP6 models. All available models (table S1) are utilized here unlike in previous studies where only selected models were used. Figure 4(a) shows that CMIP6 models simulate the observed positive AO/NAO response in the first DJF after the 1883 Krakatau and 1991 Pinatubo eruptions as in Zambri and Robock (2016). It leads to northern Eurasian warming (figure 4(b)). The multi-model ensemble mean also qualitatively well capture the observed Arctic polar vortex enhancement (figure 4(c)), with a significant inter-model relationship with AO index variations (figure 3(c)). These results suggest the downward influence of the stratosphere to the troposphere after the 1883 Krakatau and 1991 Pinatubo eruptions. Although a few models do not simulate the observed responses, a strong relationship between Arctic polar vortex enhancement and positive AO response (figure 3(c)) and a consistent result derived from high-top CMIP6 models (figures S4(c) and S5) suggest that varying results in the previous studies are partly due to the small ensemble size.

Figure 4. Spatial patterns of (a) sea level pressure, (b) surface air temperature, and (c) 10 hPa zonal wind responses in the first boreal winter (December to next year February) after the 1883 Krakatau and 1991 Pinatubo eruptions (averaged), relative to pre-eruption five year averages in CMIP6 multi-model ensemble mean (MMEM; computing the arithmetical average of all available ensemble members for each model and then calculating their average). Hatchings indicate statistically significant values at 5% level based on Monte Carlo analysis (see text S1). (d)–(h) Same as (a), but for (d) 1883 Krakatau, (e) 1902 Santa María, (f) 1963 Agung, (g) 1982 El Chichón, and (h) 1991 Pinatubo eruptions. (i) Time series of (top) Northern Hemisphere (equator to 40°N), (bottom) Southern Hemisphere (equator to 40°S) top-of-atmosphere (TOA) net-shortwave (net-SW; downward minus upward) anomalies from CMIP6 MMEM with its 95% confidence interval (shadings). Individual time series are detrended and centered to zero. Vertical gray lines indicate the month of individual historical volcanic eruptions occurred.
Download figure:
Standard image High-resolution imageThe sea level pressure anomalies in the first DJF of the individual historical volcanic eruptions are further illustrated in figures 4(d)–(h). They reveal a wide range of surface response. The 1883 Krakatau and 1991 Pinatubo eruptions show positive AO/NAO responses, with greater intensity for the former presumably because of stronger radiative perturbation (figure 4(i)). These two cases contrast to the 1902 Santa María and 1982 El Chichón eruptions which are not followed by positive AO/NAO (figures 4(e) and (g)). Such difference likely results from rather weak radiative forcing compared to the 1883 Krakatau and 1991 Pinatubo eruptions (figure 4(i)) (Sato et al 1993, Jacobson et al 2020). The 1963 Agung eruption has asymmetric shortwave inflow with much greater intensity in the SH than in the NH (figure 4(i)) (Sato et al 1993, Jacobson et al 2020) and presents significant positive AO in high-latitudes (figure 4(f)) with comparable sea level pressure decrease over the Arctic to the 1991 Pinatubo eruption (figure 4(h)) but no change over the North Atlantic Ocean to western Europe (figure 4(f)). This result implies that the meridional structure of volcanic forcings likely plays a role in NH-winter climate response to volcanic eruptions. Thus, it would be valuable to examine NH circulation responses to extratropical volcanic eruptions which has received less attention.
During the last millennium, many volcanic eruptions occurred in mid- to high-latitudes (Gao et al 2008), reducing incoming solar radiation especially in the relevant hemisphere (Stevenson et al 2016). This hemispherically-asymmetric forcing causes surface cooling in the hemisphere of eruption and produces distinct climate responses, such as Intertropical Convergence Zone shift, interhemispherically-asymmetric summer monsoon precipitation decrease, and ENSO (e.g. Oman et al 2005, Liu et al 2016, Stevenson et al 2016, Zuo et al 2018, 2019a, 2019b, 2021, Pausata et al 2020).
For high-latitude volcanic eruptions, Oman et al (2005) reported rather minor responses of Arctic polar vortex and unclear surface anomalies following the Katmai eruption which occurred at 58°N. In contrast, Zambri et al (2019) showed negative NAO after the 1783 Laki eruption which occurred at 64°N. Sjolte et al (2021) additionally presented the appearance of positive and negative NAO to low- and NH high-latitude volcanic eruptions, respectively, during the last millennium from climate reconstructions. In general, there is little clarity as to how the latitude of volcanic eruptions affects the Arctic polar vortex, lower tropospheric circulation and Eurasian winter surface climate.
Figure 5 compares atmospheric circulation responses to tropical and northern extratropical volcanic eruptions. Here, CESM-LME simulations are utilized as they allow to analyze multiple tropical and northern extratropical volcanic eruptions in the last millennium. Five tropical and five northern extratropical volcanic eruptions are analyzed in figure 5. Following Fasullo et al (2019), northern extratropical volcanic eruptions are defined as top five volcanic eruptions which have the strongest interhemispheric difference in shortwave radiation reduction with a greater perturbation in the NH than in the SH (see figures S1(a) and (c)). The northern extratropical volcanic eruptions exhibit weak and non-robust NH mid- to high-latitude climate responses (figures 5(d)–(f)) as previously reported (Oman et al 2005). They contrast to the tropical volcanic eruptions which present positive AO and significant warming over the northern Eurasia in the first DJF following volcanic eruptions (figures 5(a) and (b)) with an enhanced Arctic polar vortex (figure 5(c)) as discussed above.
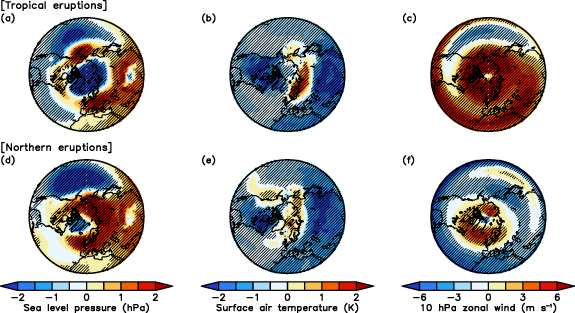
Figure 5. (a), (d) Sea level pressure, (b), (e) surface air temperature, and (c), (f) 10 hPa zonal wind responses to (a)–(c) tropical and (d)–(f) northern extratropical volcanic eruptions in the first boreal winter (December to next year February commences after the eruptions), relative to pre-eruption five year averages in CESM-LME. Hatchings indicate statistically significant values at 5% level based on Monte Carlo analysis (see text S1).
Download figure:
Standard image High-resolution imageThis result indicates that extratropical circulation and surface climate responses to volcanic eruptions are dependent on the latitude of volcanic eruptions. A further analysis based on PMIP3 last millennium simulations shows largely consistent results, reaffirming the crucial role of the latitude of volcanic eruptions (figure S6). This finding suggests that the uncertainty of NH circulation response to volcanic eruptions can be partly caused by differing latitudes of volcanic eruptions.
3. Antarctic polar vortex and southern annular mode
The impact of volcanic eruptions on SH extratropical circulations has received less attention until present, albeit the Antarctic lower stratospheric polar vortex (hereafter Antarctic polar vortex) and the SAM variations exert strong impacts on SH surface climate (e.g. Hendon et al 2007, Lim et al 2019). The Antarctic polar vortex and SAM are expected to respond to volcanic eruptions through physical mechanisms similar to the NH as discussed above. Previous studies based on reconstructions, reanalysis and satellite datasets showed either negative or insignificant SAM responses to historical or last millennium volcanic eruptions in the SH (Robock et al 2007, Karpechko et al 2010, Barnes et al 2016, McGraw et al 2016, Dätwyler et al 2018). Robock et al (2007) also reported insignificant SAM response to the 1991 Pinatubo eruption from a single climate model simulation. Such insignificant responses have been attributed to large internal variability such as El Niño-like equatorial Pacific Ocean conditions before volcanic eruptions (e.g. Swingedouw et al 2017, Paik et al 2020).
However, the recent study using reconstructed SAM records (Yang and Xiao 2018) showed the emergence of positive SAM after historical volcanic eruptions. It was also shown that recent volcanic eruptions occurred in the tropics and SH extratropics were followed by the Antarctic stratospheric ozone depletion, Antarctic polar vortex enhancement, and positive SAM in austral spring to early summer (Solomon et al 2016, Yook et al 2022). Positive SAM responses to historical volcanic eruptions were further found from CMIP3 and CMIP5 multi-model simulations (Karpechko et al 2010, Barnes et al 2016, McGraw et al 2016). In addition, Zanchettin et al (2014) reported the emergence of positive SAM to supervolcano-size eruption in austral winter.
Figure 6 presents the SAM and Antarctic polar vortex responses to historical volcanic eruptions from the latest datasets. The SAM is defined as the difference of normalized sea level pressure between 40°S and 65°S (Gong and Wang 1999, Son et al 2022). The CMIP6 model simulations are also analyzed as in NH analysis (figure 4). The observed responses show weak negative SAM in October to December (OND) and relatively strong (and more roust) negative SAM in DJF following historical volcanic eruptions (e.g. Barnes et al 2016) (figures 6(a) and (b)). The negative SAM responses are hinted in the spatial pattern of sea level pressure anomalies in DJF, exhibiting positive and negative pressure anomalies over the Antarctic and SH mid-latitudes, respectively (figure 6(c)). However, Antarctic polar vortex response is very weak (figure 6(d)). Note that in contrast to NH responses assessed for boreal winter, SH responses are analyzed for austral late spring as the strongest historical eruptions (e.g. 1883 Krakatau, 1902 Santa María, and 1991 Pinatubo eruptions) occurred during the austral winter to spring (June to October). Moreover, the Antarctic polar vortex variability and the associated downward coupling are strongest in austral late spring to early summer (Hendon et al 2007, Son et al 2013, Lim et al 2019). These would allow stronger responses of SAM to volcanic eruptions in the austral late spring to early summer instead of the austral winter. Nevertheless, positive SAM response to the 1902 Santa María eruption remains uncertain since it erupted in the October and its impact on the Antarctic polar vortex in OND is quite small (figure S7(g)).
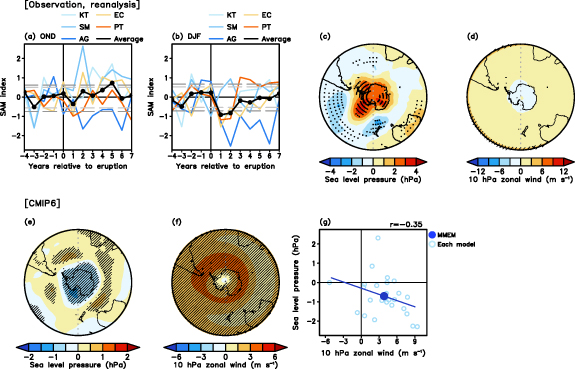
Figure 6. Time series of (a) October to December (OND) and (b) December to next year February (DJF) southern annular mode (SAM) indices before and after volcanic eruptions from five volcanic eruptions in the historical period. The year 0 denotes the last OND or DJF before volcanic eruptions. The anomalies relative to pre-eruption five year averages are shown. Here, five historical volcanic eruptions are 1883 Krakatau (KT; light sky blue), 1902 Santa María (SM; sky blue), 1963 Agung (AG; blue), 1982 El Chichón (EC; yellow), and 1991 Pinatubo (PT; orange). The 95% and 99% confidence intervals for five-case composite (see text S1) are presented as light and dark gray dashed lines, respectively. Spatial patterns of (c) sea level pressure, (d) 10 hPa zonal wind responses at the first DJF (i.e. season commences after the eruptions) averaged over (c) all five eruptions and (d) the most recent three eruptions (1963 AG, 1982 EC and 1991 PT), relative to pre-eruption five year averages. (e), (f) Same as (c), and (d), respectively, but from CMIP6 multi-model ensemble mean (MMEM) to all five historical volcanic eruption averages at first OND (i.e. season commences after the eruptions, 1902 for Santa María eruption). Hatchings indicate statistically significant value at 5% level based on a Monte Carlo analysis (see text S1). (g) Scatterplot of 10 hPa zonal wind anomalies averaged over 60°S–70°S (x-axis) and sea level pressure anomalies averaged over south of 60°S (y-axis), relative to pre-eruption five year averages, averaged at the first OND to all five historical volcanic eruption averages from individual CMIP6 models (open circles; ensembles averaged) and MMEM (filled circle). Linear regression line and correlation coefficients (top-right corner) calculated using all samples are presented together.
Download figure:
Standard image High-resolution imageThe CMIP6 models show the opposite responses to the observations (figures 6(e) and (f)). They simulate robust positive SAM anomalies in the first OND after volcanic eruptions, when averaged across the five historical volcanic eruptions, with the strongest signal of negative sea level pressure anomalies over the Antarctic (figure 6(e)). Individual volcanic eruptions also generally show positive SAM-like responses (figures S7(a)–(e)). Unlike the observations, the Antarctic polar vortex is enhanced (figure 6(f), see also figures S7(f)–(j) for individual volcanic eruptions) as reflected by its strong connection with the SAM (figure 6(g)). Thus, the latest climate models support the emergence of positive SAM after the historical volcanic eruptions.
The contrasting SH circulation responses between the observations and CMIP6 models (figures 6(a)–(d) versus figures 6(e) and (f)) are likely in part due to different internal variability such as pre-eruption El Niño conditions, which often occur along with negative SAM in austral warm seasons (e.g. Lim et al 2016). In contrast to the observations, CESM-LME simulation shows a weak positive correlation between the ENSO and SAM following tropical volcanic eruptions (figure S8). This suggests that different SH responses to volcanic eruptions in climate models may partly result from different climate variability in the models compared to the observations.
The SAM and Antarctic polar vortex responses are further compared for tropical and northern extratropical volcanic eruptions using CESM-LME simulation. Both tropical and northern extratropical volcanic eruptions are followed by positive SAM along with enhanced Antarctic polar vortex in the first OND (figures 7(a)–(e)). The relationship between the Antarctic polar vortex and tropospheric responses is also quite strong (figures 7(c) and (f)) as in the NH (figures 3(c) and (f)). Furthermore, the impacts of tropical and northern extratropical volcanic eruptions on SH extratropics are generally well supported by the PMIP3 last millennium simulations (figure S9). The strong correlation between Antarctic polar vortex and SAM is found from non-volcanic years (figure S10). It indicates that their relationship is typical of intrinsic dynamics and can be captured by CESM-LME simulation.

Figure 7. (a), (d) Sea level pressure and (b), (e) 10 hPa zonal wind responses at the first October to December (OND) after (a)–(c) tropical and (d)–(f) northern extratropical volcanic eruptions, relative to pre-eruption five year averages in the CESM-LME simulation means. Hatchings indicate the values which are statistically significant at 5% level based on Monte Carlo analysis (see text S1). (c), (f) Scatterplots of 10 hPa zonal wind (60°S–70°S averaged; x-axis) and sea level pressure anomalies (averaged south of 60°S; y-axis), relative to pre-eruption five year averages, at the first OND following individual (c) tropical and (f) northern extratropical volcanic eruptions in CESM-LME simulation (n = 85). Open dots indicate each sample while filled dots indicate the sample average. Linear regression lines and correlation coefficients (top-right corner) are calculated using all samples.
Download figure:
Standard image High-resolution image
The above results indicate that the SH circulation responses to volcanic eruptions are not much sensitive to the latitude of volcanic eruptions in contrast to the NH circulation responses (figure 5). However, the hemispheric difference needs to be further explored by considering seasonality. The SH circulation responses are more apparent in the austral spring to early summer than in the winter, as shown in the temporal variation of 10 hPa zonal wind and corresponding meridional temperature gradient at 50 hPa (figure S11). This is possibly related to the requirement of several months for the signals to propagate towards high-latitudes and the restricted transport of volcanic aerosols to polar region during cold season (Gao et al 2008). Also, studies on SH responses to southern extratropical volcanic eruptions have been limited, considering minor volcanic eruptions only (Solomon et al 2016, Yook et al 2022). In this respect, quantifying the influence of Mount Hudson eruption occurred at August 1991 around 45.5°S following the 1991 Pinatubo eruption will be helpful to understand the details, although it loaded much smaller amount of stratospheric aerosols than the Pinatubo eruption (McCormick et al 1995).
4. Discussion and future avenues
The present study reviews observational and modelling studies of the volcanic impacts on NH and SH mid- to high-latitude atmospheric circulations. Earlier findings are also reassessed by conducting updated analyses with the latest observations, reanalysis, and climate model simulations.
The positive AO/NAO are observed in the first DJF after the historical volcanic eruptions, with a large uncertainty due to the uncertainty of reconstructions, internal variability of extratropical atmospheric circulations, and small sample size. Such response is not always reproduced by climate model simulations especially with outdated climate models. The CMIP3 models are generally incapable of reproducing the observed responses. While CMIP5 models are able to capture the observed NH winter responses to some extent, the results still vary depending on the analysis methods and the choice of model simulations. The CMIP6 models capture the Arctic polar vortex enhancements, positive AO/NAO, and northern Eurasian winter warming in response to the two strongest historical eruptions, i.e. the 1883 Krakatau and 1991 Pinatubo eruptions. However, reproducing circulation responses to rather weak eruptions remains challenging. CMIP6 models simulate positive AO/NAO responses to the 1963 Agung eruption but not for the 1902 Santa María and 1982 El Chichón eruptions which have comparable intensities. Such varying responses are likely caused by the meridional structure of volcanic forcings: greater shortwave perturbations in NH than in SH after the 1902 Santa María and 1982 El Chichón eruptions versus the opposite perturbations after the 1963 Agung eruption.
The NH circulation responses to volcanic eruptions are also sensitive to the latitude of the eruptions. The analysis of CESM-LME simulations revealed that northern extratropical volcanic eruptions (e.g. 1783 Laki eruption) do not robustly drive Arctic polar vortex enhancement, positive AO/NAO, and Eurasian warming in the first DJF after the eruptions. It contrasts to the tropical volcanic eruptions that produce robust NH mid- to high-latitude responses. This result is based on the low-top model with a coarse resolution in the stratosphere. Although high-top models have been found inessential to simulate extratropical circulation responses to volcanic eruptions, analysis with multiple high-top models could be still useful to produce more robust evidences of the role of latitude of volcanic eruptions on extratropical circulation and surface climate responses.
The physical mechanism(s) through which volcanic eruptions impact on the extratropical atmospheric circulations has not been fully understood. The leading hypothesis is the Arctic polar vortex enhancement in the first DJF after volcanic eruptions and its downward influence which resembles positive AO/NAO (Robock and Mao 1992). The Arctic polar vortex intensification has been explained with various processes. An enhanced pole-to-equator temperature gradient in the upper troposphere and lower stratosphere, resulting from tropical lower-stratospheric warming by enhanced long-wave radiation absorption of volcanic aerosols, is proposed to generate anomalously strong Arctic polar vortex through thermal wind relationship. Other studies proposed the role of the Arctic ozone depletion through heterogeneous chemical reactions to volcanic aerosols, the weakened planetary wave activities due to the reduced meridional temperature gradient in the troposphere by stronger cooling in the tropics than in mid-latitudes, and the residual circulation enhancement in the stratosphere. Among them, most intriguing hypothesis is the wave-mean flow interaction. The subtropical westerly anomalies in the lower stratosphere, due to the enhanced pole-to-equator temperature gradient in the upper troposphere and lower stratosphere, can strengthen equatorward wave propagation by shifting a critical latitude equatorward. The associated EP flux divergence in high-latitude stratosphere can strengthen the Arctic polar vortex (Bittner et al 2016b). Strong Arctic polar vortex signals then propagate downward to the troposphere on the sub-seasonal time scale. Both CMIP6 and CESM-LME simulations support this hypothesis. Presumably, multiple processes work together to drive the enhanced Arctic polar vortex and positive AO/NAO in the first DJF after volcanic eruptions. It is difficult to identify the dominant mechanism(s) because of the uncertainty of climate model itself. It is desirable to conduct dedicated model experiments with state-of-the-art climate models. In this regard, a series of model experiments of the VolMIP, such as simulations prescribing only surface or stratospheric forcing of the 1991 Pinatubo eruption, would be beneficial (Zanchettin et al 2016).
The impact of volcanic eruptions on the SH circulations has a larger uncertainty than that in the NH. Previous studies showed insignificant SAM response to historical and last millennium volcanic eruptions, possibly due to chaotic internal variability (e.g. El Niño conditions before volcanic eruptions). The negative SAM response was reported in the first and second DJF when the Antarctic polar vortex does not form. However, unlike in the observations, CMIP6 models simulate positive SAM along with an enhanced Antarctic polar vortex in the first OND as in previous modeling studies. The CESM-LME simulation also shows the positive SAM with an enhanced Antarctic polar vortex to last millennium volcanic eruptions for both tropical and northern extratropical eruptions. These observation-model discrepancy likely results from different internal climate variability. While observations show a negative correlation between ENSO and SAM in OND (Lim et al 2016), CESM-LME simulation exhibits a positive correlation after tropical volcanic eruptions (figure S8(a)). The similar results are also found in CMIP5 and CMIP6 models (e.g. Lim et al 2016, Coburn and Pryor 2021). This poor representation of the ENSO-SAM relation could hinder understanding of the detailed physical mechanisms of volcanically-induced SAM changes. To reconcile this, further modeling studies with improved representation of ENSO-SAM relationship are needed.
Based on the review, future directions are discussed for better understanding of volcanic influences on extratropical circulations. To identify the causes of large inter-model uncertainties, systematic model experiments, including and beyond the VolMIP, with a large ensemble size are needed. The idealized experiments with varying volcanic eruption latitudes would be particularly useful for understanding distinct extratropical atmospheric circulation responses to tropical, northern, and southern volcanic eruptions. In addition, volcanic eruptions with varying magnitude could be considered to explore possible threshold behaviors or non-linearity of AO/NAO and SAM responses to volcanic eruptions (e.g. Azoulay et al 2021, DallaSanta and Polvani 2022) as well as their impacts on surface climate. Other factors critically affecting extratropical circulation responses, such as pre-eruption ocean conditions (e.g. Coupe and Robock 2021), seasonality of volcanic eruptions (e.g. Stevenson et al 2017), and uncertainty in volcanic forcing reconstructions (e.g. Gao et al 2008, Toohey and Sigl 2017, Marshall et al 2022), could be also tested. Finally, how the extratropical circulation responses to volcanic eruptions will change in a warming climate (i.e. different global warming rates or levels) needs to be explored to better identify the associated risks.
Acknowledgments
This study was supported by the National Research Foundation of Korea (NRF) Grant funded by the Korea government (MSIT) (NRF-2018R1A5A1024958 and NRF-2021R1C1C2094185). E-P L was supported by the Australian National Environmental Science Program and the Victorian Water and Climate Initiative. We acknowledge the World Climate Research Programme, which, through its Working Group on Coupled Modelling, coordinated and promoted CMIP5/6. We thank the climate modeling groups for producing and making available their model output, the Earth System Grid Federation (ESGF) for archiving the data and providing access, and the multiple funding agencies who support CMIP5/6 and ESGF. We thank the climate modeling groups of National Center for Atmospheric Research (NCAR) for producing and making available their model output and providing access.
Data availability statement
The utilized CMIP6 model simulations are listed in table S1. All of the datasets can be accessed at https://esgf-node.llnl.gov/projects/cmip6/. The CESM-LME simulation is available at www.cesm.ucar.edu/projects/community-projects/LME/. The CMIP5/PMIP3 simulations utilized in this study are available at https://esgf-node.llnl.gov/projects/cmip5/ and https://archive.ceda.ac.uk/. The observation datasets of sea level pressure (HadSLP version 2), near-surface temperature (version 2 of Cowtan and Way 2014) are obtained from https://psl.noaa.gov/gcos_wgsp/Gridded/data.hadslp2.html, and www-users.york.ac.uk/~kdc3/papers/coverage2013/series.html, respectively. ERA5 reanalysis datasets are assessed from https://cds.climate.copernicus.eu/cdsapp#!/dataset/reanalysis-era5-pressure-levels-monthly-means?tab=overview.
Supplementary data (1.4 MB PDF)