


Abstract
The rapid depletion of US groundwater resources and rising number of dying wells in the Western US brings attention to the significance of groundwater governance and sustainability restrictions. However, such restrictions on groundwater withdrawals are likely to generate spillover effects causing further environmental stresses in other locations and adding to the complexity of sustainability challenges. The goal of this paper is to improve our understanding of the implications of growing global food demand for local sustainability stresses and the implications of local sustainability policies for local, regional, and global food production, land use, and prices. We employ SIMPLE-G-US (Simplified International Model of agricultural Prices, Land use, and the Environment—Gridded version for the United States) to distangle the significance or remote changes in population and income for irrigation and water resources in the US. Then we examine the local-to-global impacts of potential US groundwater sustainability policies. We find that developments in international markets are significant, as more than half of US sustainability stresses by 2050 are caused by increased commodity demand from abroad. Furthermore, a US sustainable groundwater policy can cause overseas spillovers of US production, thereby potentially contributing to environmental stresses elsewhere, even as groundwater stress in the US is alleviated. These unintended consequences could include deforestation due to cropland expansion, as well as degradation in water quality due to intensification of production in non-targeted areas.
Export citation and abstract BibTeX RIS
1. Introduction
During recent decades, rapid economic growth has intensified the impacts of human systems on natural ecosystems, with degraded land and water resources creating a global crisis (Jury and Vaux Jr 2007, Hanjra and Qureshi 2010, Srinivasan et al 2012, Famiglietti 2014). Rapid groundwater depletion is among the most challenging of these environmental problems (Changming et al 2001, Qureshi et al 2010, Karami et al 2012, Konikow 2013, Voss et al 2013, Castle et al 2014, Liesch and Ohmer 2016, Dalin et al 2017, Nabavi 2018). The pressure on farmers to produce more output has led to unsustainable use of water resources in many locations (Seckler et al 1999, Valley 2009, McGuire 2017, Reitz et al 2017, Russo and Lall 2017, Rodell et al 2018). In addition, reductions in groundwater storage are threatening many regions' ability to meet future water needs (Cook et al 2015). Groundwater demand is likely to be particularly strong in the coming decades, as irrigation becomes a more important element of agricultural adaptation in a warming climate (Bruinsma 2009, Perry et al 2009, Schlenker and Roberts 2009, Nepal and Shrestha 2015, Pathak et al 2017, Haqiqi et al 2018, 2019, 2021). On the other hand, effective water sustainability policies also require understanding of the critical interactions between environmental and human systems. Decisions and policies in the human system can affect the environment, but changes in the environment can also affect people and their decisions (Dagnino and Ward 2012, Haqiqi et al 2020, 2023). Solutions and strategies ignoring these responses may fail. For example, improving irrigation efficiency can result in increased irrigation demand motivated by lower costs (Perry et al 2017, Grafton and Wheeler 2018, Perry 2018, Pérez-Blanco et al 2020).
While food security issues are typically studied at the global and country-level, resource sustainability stresses are usually felt at the local level (e.g. abandoned villages, dying wells, drying lakes and sub-basins, land subsidence). The overarching goal of this paper is to measure how economic changes in one region can affect environmental sustainability in another region of the world, as well as how the implementation of local sustainability policies can export environmental stresses to other regions. Such teleconnections in the global food system can have important implications for global environmental justice, as rising incomes in some regions support increasingly rich and specialized diets, resulting in significant environmental costs elsewhere (e.g. McNall 2011, Marston et al 2015). This paper also contributes to the literature on international trade in virtual water and virtual land by quantifying the impacts of population changes on remote water and land resources (Hoekstra and Mekonnen 2012; Hoekstra and Wiedmann 2014; Ramankutty et al 2018).
Given the importance of future groundwater sustainability, a variety of different approaches have been employed to study the interaction between hydrological and human systems. The growing literature in socio-hydrology involves using increasingly complex models to address challenges involving water quality, groundwater depletion, flood risk, drought, and conflicting demands (Ghosh et al 2014, Ertsen et al 2014, Van Emmerik et al 2014, Fernald et al 2015, Blair and Buytaert 2016, Giuliani et al 2016, Di Baldassarre et al 2019). The literature on tele-coupling and virtual water trade has also explored the connections between human systems and land-water systems (Dalin et al 2012, Bruckner et al 2015, Wichelns 2015, Chaudhary and Kastner 2016, Hertel 2018, D'Odorico et al 2019). However, the significance of different global drivers for local sustainability stresses (e.g. changes in groundwater withdrawals) has not previously been quantified in a multi-scale, economic equilibrium framework.
We develop a quantitative economic framework that allows for global-to-local-to-global (GLG) analysis of a broad range of environmental research topics. The philosophy of the multiscale, GLG approach is to evaluate the implications of global changes for local environmental stresses; alongside assessing the implications of local responses for global conditions through global and regional agricultural markets. In this paper, we focus on groundwater withdrawals as an application of this GLG framework. First, we look at the local changes in water withdrawal caused by global drivers using a decomposition approach which allows us to quantify the separate contribution of global economic changes to growth in irrigation water withdrawal in the United States. We look at population and income as demand-side drivers and growth in total factor productivity (TFP—the ratio of outputs to inputs) as a supply-side driver. Second, we quantify changes in crop production and agricultural water and land use around the world in response to local groundwater sustainability policies in the US. This research highlights the trade-offs between economic growth and sustainability, as well as the unintended consequences of local sustainability policies, including the associated spillover effects. This multi-scale framework can better inform local environmental policy by providing a holistic evaluation. The supplementary material (SI) provides more details about the model, data, parameterization, validation, and robustness checks.
To focus on the decomposition of the impacts of global changes, we do not consider changes in water and heat stress. We are aware that this simplification is likely to result in the underestimation of future water stress in many regions by mid-century. However, this simplification allows us to focus more sharply on the main messages of the study, namely the importance of GLG linkages in the context of land and water sustainability.
2. Methods
This study employs the SIMPLE-G framework, Simplified International Model of agricultural Prices, Land use, and the Environment-Gridded version (Liu et al 2017, Baldos et al 2020). It is an extension of the (non-gridded) SIMPLE model which has been validated for the study of long-run sustainability and food security (Baldos and Hertel 2013, Liu et al 2014, Hertel and Baldos 2016, Hertel 2018). It is a comparative static framework for counterfactual (i.e. what-if) analysis designed for simulating the new state of the agricultural, food and environmental systems when considering a policy intervention or exogenous shock. (figure 1).

Figure 1. Overview of the SIMPLE-G model. The crop production boxes are in green, the gridded input markets are in blue, the demand side boxes are in red, and ovals represent exogenous variables subject to perturbation based on external studies. The dashed shapes are information and models outside of SIMPLE-G. There are three food commodities: crops, livestock products, and processed food. There are six agricultural input commodities: N fertilizer, land, groundwater, surface water, irrigation equipment, and a composite of all other inputs. In the gridded version, crop production in each grid cell is linked upward to regional and global crop markets and downward to long-run economic decisions about nitrogen fertilizer application, water withdrawals, land use, and other inputs (the latter is an aggregate of capital, labor, chemicals, energy, etc). The SIMPLE-G model solves for new equilibrium prices and quantities for local, regional, and international markets for all commodity and input markets in the model. This solution includes gridded equilibrium volumes of groundwater and surface water withdrawals, cropland area, nitrogen fertilizer application, crop production, imports, and exports. Further, the regional and global equilibrium prices and quantities for crops, livestock, and processed food are determined. The model used in this study is initialized to the economic and agricultural conditions around the year 2010. The shocks comprise fundamental changes to exogenous variables in the model that caused by changes outside the model, like population and income changes.
Download figure:
Standard image High-resolution imageIn this study, we focus on the groundwater module of SIMPLE-G to analyze the economic decisions about groundwater withdrawals for irrigated cropland. These withdrawals are defined as the amount of water extracted from groundwater resources; it is usually larger than crop groundwater consumption, with the difference recharging groundwater or running off into streams. The variables affecting withdrawal decisions are varied and include surface water availability and costs, groundwater availability and costs, irrigation extent, irrigation rent gaps, irrigation infrastructure (equipment and technology), crop prices, crop production technology, etc. The model is open-source, open-access, and available on myGeoHub for High Performance Computation (Woo et al 2020, 2022).
A key feature of our analysis is the decomposition, which we provide with respect to the exogenous drivers of sustainability stresses. We follow the numerical integration approach developed by Harrison et al (2000) to decompose the contribution of each exogenous variable in changes in output variables.
The model of this study is built on previous studies with valuable insights on commodity trade (Armington 1969), land allocation (Ahmed et al 2008), irrigation economics (Haqiqi and Hertel 2016), value of water (Haqiqi et al 2016), water rights (Jame and Bowling 2020), water stress (Roath 2013), and groundwater (Befus et al 2017). This study extends the previous modeling work of Baldos et al (2020) by incorporating a new land allocation framework to improve the modeling of land-use changes at each location (Zhao et al 2020) as described in S.2.4. This framework is particularly appropriate as we expect to see a conversion of cropland from irrigated to rainfed, and vice versa. The new approach ensures we preserve the physical area as opposed to the economic volume. Another major extension of SIMPLE-G is the introduction of a relocation module to improve the modeling of changes in pattern of agricultural activity across grid cells and crop production zones defined by the USDA Farm Resource Regions (FRR), treating crop commodities from each of these FRR's as differentiated commodities. This allows us to capture the tendency of crops to shift, first and foremost, among the same FRR (e.g. the 'Fruitful Rim'). The data in SIMPLE-G have also been updated to reflect the most recent cost of production estimates by USDA. For more details see S.1.
2.1. Global change scenarios
Key elements of our global change scenario are presented in table 1. In this scenario, we consider changes in population and income as in Baldos and Hertel (2014) based on the 'business as usual' Shared Socioeconomic Pathway 2 from 2010 to 2050. Regarding productivity, we assume that the historical rates of productivity growth rates persist to mid-century (Fuglie 2012) and apply a uniform cumulative TFP growth in the processed food sector. Here, TFP growth shows how much more production is possible using the same volume of inputs.
Table 1. Projected percentage changes in population, income, and productivity from 2010 to 2050. Productivity is measured by growth in Total Factor Productivity (TFP).
| Region | Population | Income per capita | Crop TFP | Livestock TFP |
|---|---|---|---|---|
| East Europe | −12.7 | 239.5 | 17.6 | 50.0 |
| North Africa | 44.0 | 224.7 | 42.2 | 17.7 |
| Sub Saharan Africa | 139.4 | 401.0 | 17.9 | 17.7 |
| South America | 31.1 | 176.3 | 132.8 | 157.0 |
| Australia | 33.8 | 70.7 | 64.2 | 17.7 |
| Europe | 0.0 | 66.3 | 78.6 | 17.7 |
| South Asia | 40.8 | 640.6 | 83.3 | 96.0 |
| Central America | 41.2 | 154.6 | 115.4 | 157.0 |
| South Africa | 16.0 | 239.5 | 26.8 | 17.7 |
| South East Asia | 32.1 | 363.6 | 47.0 | 157.0 |
| Canada | 25.8 | 56.4 | 71.1 | 17.7 |
| United States | 25.0 | 58.6 | 71.1 | 17.7 |
| China | −6.3 | 606.7 | 121.7 | 157.0 |
| Middle East | 65.2 | 102.6 | 41.5 | 17.7 |
| Japan Korea | −14.5 | 97.6 | 75.0 | 17.7 |
| Central Asia | 52.3 | 394.2 | 25.2 | 50.0 |
Sources: Percentage changes in population and income are obtained from Baldos and Hertel (2014) aggregated to 16 regions from country-level information based on SSP2 (O'Neill et al 2014). The changes in productivity are calculated based on Fuglie (2012). The cumulative rate of productivity growth in the processed food sector is 42% worldwide.
The purpose of this study is not to provide comprehensive future projections but rather to disentangle the significance of global drivers of local stresses within a GLG framework. While considering heat and water stress can affect the estimates on local and regional productions, it is unlikely that it changes the significance of teleconnections as they are mostly related to international trade pathways.
2.2. Local sustainability scenarios
In addition to the global-to-local analysis, this paper also evaluates the global impacts of a sustainable groundwater policy for the United States. Here, the sustainability policy is defined as restricting groundwater withdrawals to the rate of groundwater recharge in unsustainable grid cells across the US. The data on extraction and recharge rates used in this study is obtained from the USGS (Reitz et al 2017) as described in section S.4 of the SI). We first construct a ratio showing the groundwater extraction (Maupin et al 2014 to recharge at each location circa 2010. As the year 2010 was a relatively wet year, with abnormally high recharge rates, the 2010 ratio is likely to underestimate the long-run sustainability stress. Therefore, we use a five-year average: 2007–2012 to calculate the ratio of groundwater extraction relative to local groundwater recharge by 5 arc-min grid cells circa 2010. We define the shocks to the groundwater supply module based on this ratio.
3. Results
3.1. Global to local analysis of groundwater demands
The global change scenario includes changes in income per capita, population, and TFP along a business pathway from 2010 to 2050.
3.1.1. Global decomposition
Overall, the changes in income and population, taken on their own, serve to boost the equilibrium crop production and input use (land, water, fertilizer). However, global TFP plays a critical role in offsetting a major portion of the pressure from income and population growth on agricultural inputs. For example, the changes in population and income alone would increase global cropland by around 29.91% (13.27% + 16.64%), while TFP is projected to reduce it by 22.99% leading to a far more modest 7.14% final increase in cropland in this scenario (figure S.39). This reveals the significance of TFP as a tool to reduce the stress on global land and water resources.
3.1.2. Regional decomposition
Figure 2(a) shows the major drivers of production change by region, while the drivers of change in US groundwater withdrawals are illustrated in more detail in figure 2(b). The biggest impacts on the US groundwater are from population increase in the US, South Asia, and Sub-Saharan Africa as well as income growth in Sub-Saharan Africa, China and South Asia. Here, the US TFP growth also contributes to more US groundwater withdrawals due to relatively lower TFP growth in the US and a possibility of rebound effect. However, global TFP growth offsets the impacts of increased income and population.

Figure 2. (a) Decomposition of changes in regional crop production from 2010 to 2050 due to the combined effect of changes in per capita income, population, and technology, around the world, as well as growth in biofuels demand. (b) Decomposing the drivers of changes in the US groundwater withdrawals from 2010–2050 as computed by SIMPLE-G-US-Allcrops, based on SSP2 (Shared Socioeconomic Pathways, middle of the road), in absence of climate change. Improvement in global productivity can completely offset the impacts of increased population and income, conditional to sufficient investments. Also, rebound effect causes increase in groundwater withdrawals.
Download figure:
Standard image High-resolution imageFigure 2(a) summarizes the projected change in regional crop production and the contribution of each driver to this outcome. In the US, production is projected to rise by nearly sixty percent or roughly one billion metric tons, valued at $112 billion (in 2010 prices), over this four-decade period. The drivers of US crop output growth are relatively evenly divided between increases in population—both domestic and foreign (red bar), rising per capita incomes around the world (green bar), and improved productivity in global crop production (blue bar). In Eastern Europe and China, regions with little projected population growth (red bar), income is the main driver of crop production (green bar). Income growth is also a key driver of output growth in South Asia, whereas population growth is the most important food demand driver in Africa. Note that global productivity growth has a negative impact on output in Central Asia, South Africa, Sub-Saharan Africa, and Eastern Europe. This is mainly caused by a loss in competitiveness due to low productivity growth in these regions compared to the world.
Although productivity growth leads to higher yields and therefore moderates the demand for land, the impact of population and income growth on land use is dominant in all regions except for Europe. Sub-Saharan Africa (+120 Mha) and South Asia (+36 Mha) are projected to have the largest increases in cropland due to strong domestic demand growth in those two regions. Our analysis indicates that growth in income and population outside the US is far more important in driving US crop production (contributing to a 28.9% increase) than income and population growth within the US (contributing just a 6.6% increase). This is due to higher income growth rates in the developing and emerging economies and higher rates of population growth in Africa and other low-income regions. For details on the regional decomposition of global drivers of changes in water, land, and fertilizer inputs see figures S.34–S.36.
3.1.3. Local decomposition
Figure 3 illustrates the pattern of changes in groundwater withdrawals and irrigated areas across the US due to one million population increase in each world region. This is calculated by dividing the computed contribution of population change in each global region by the number of population change in that region. For example, if the model calculates that Y people increase in region r has caused X ha change in irrigated area in subregion z, then the average impact of change in population in r on irrigated area in z is equal to Xz /Yr . Similar calculations are done for water in m3. The general finding is that normalized population changes in Canada and Europe will have greater contributions to change in water withdrawal and irrigation contraction, four times bigger than China, for a given size of population change. Note that population change in any region has a direct relationship with water and irrigation in the US. Thus, a decline in population, in China for example, means lower stress on land and water resources in the US. Another general finding is that most of the changes occur in the Fruitful-Rim and Basin-and-Range in the Western US. Finally, a one million person increase in the world population can increase irrigated area in the US by 10–40 thousand hectares depending on the source of population growth. This means the marginal increase in per capita virtual water and land use is up to ten times bigger than the current average per capita virtual water and land use as shown in table S.20.

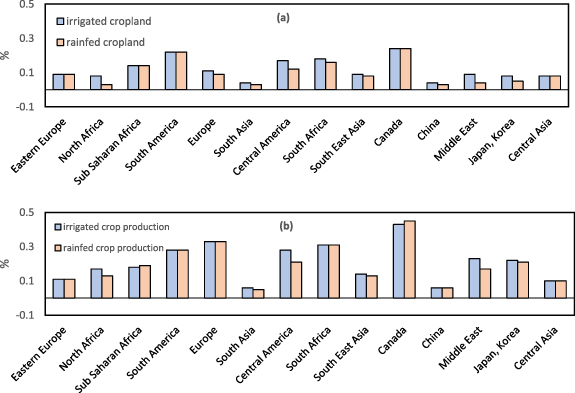
Figure 3. Impacts of one million additional population in each region on (a) irrigated cropland and (b) groundwater withdrawals in the US. Uniform population increases/decreases in Europe, Canada, Japan and Korea have bigger impact on water and land resources in the US than population increase/decreases elsewhere. A decline in population of these regions can cause bigger decline in cropland in the US. In general, the impacts on the Western regions (Fruitful Rim, Basin and Range) are largest. ** Abbreviations for: Heartland, Northern Crescent, Northern Great Plains, Prairie Gateway, Eastern Uplands, Southern Seaboard, Fruitful Rim, Basin Range, and Mississippi Portal.
Download figure:
Standard image High-resolution imageFigure S.37 highlights the major findings at the grid cell level. First, the most rapid irrigation expansion (in percentage terms) is expected to occur in the Eastern US. This is in line with current observations which show rapid percentage expansion in the east and declines in the west during the 1997–2017 period (USDA 2019, Xie et al 2021). Second, foreign demand drivers of groundwater withdrawals are more important than US demand drivers. SIMPLE-G is to provide economic insights regarding the likely impacts of changes and unintended consequences of policies for water and land resources.
3.2. Local to global analysis of US groundwater sustainability policies
We implement the sustainability policy by reducing groundwater withdrawals to the rate of recharge (the shock is illustrated and described in section S.4 of the supplementary information).
3.2.1. Local impacts and spillovers
At the local level, the first response to this policy is a reduction in groundwater withdrawals. Figure 4(a) shows the resulting change in groundwater withdrawals by grid cell. The green areas require more than 50% reduction in groundwater withdrawal. This induces an increase in groundwater withdrawals in all other locations within the US. The biggest increase in groundwater withdrawals occurs in the southern and eastern parts of the Fruitful Rim region as Texas and Florida have appropriate agro-ecological conditions to produce similar products to California (the targeted regions).

Figure 4. Percentage change in groundwater withdrawals (a) and associated cost of groundwater to producers (b) by 5 arc-min grid cells in response to a policy restricting groundwater withdrawals to the level of average annual recharge. Note: white areas are not cultivated.
Download figure:
Standard image High-resolution imageThe groundwater restriction scenario is expected to increase the shadow price (marginal value of water to the producer) of water by over 50% in the targeted regions. This raises the average crop production cost by 9%–15% across the targeted regions. Figure 4(b) shows the projected change in the equilibrium price (value) of groundwater in the US. For the targeted region, this rising scarcity value is mainly due to a lower supply of water. However, for other parts of the US, the increase in groundwater shadow price is due to changes in the demand for irrigation.
Another potential local response to this groundwater sustainability scenario is to increase the use of surface water as this offers a potential substitute—albeit an imperfect one—for groundwater. It is not considered a perfect substitute as the regulations and the extraction methods are different and farmers may not have the same control over the timing of water availability. Figure 5(a) shows the estimated change in US gridded surface water withdrawal in the wake of the groundwater sustainability policy. Depending on water availability and institutions, the surface water withdrawals might increase from 5% to more than 25% in non-targeted parts of the US. The surface water withdrawal is projected to decline in the restricted grid cells due to large reductions in the irrigated area (figure 5(b)). While the global response is small, the base over which this applies is large, so that while US irrigated area declines by 11.6 million hectares, global cropland area increases by 29.5 million hectares in response to US groundwater restrictions. This reflects the extremely high yields on US irrigated croplands which must be replaced by production elsewhere to meet global food demands.

Figure 5. Local responses to groundwater restrictions; (a) percentage change in surface water withdrawals by 5 arc-min grid cells; (b)Percentage change in total cropland area. Note: white areas are not cultivated.
Download figure:
Standard image High-resolution image3.2.2. Global impacts
Figure 6(a) reports the estimated % change in global cropland area due to US groundwater sustainability restrictions which is less than 1% in each region. This experiment shows that local sustainability solutions may be viewed less favorably in a global context. The unintended consequences include possible deforestation (increase in cropland) and water quality issues (higher fertilizer applications) in non-targeted areas. We need a global approach to evaluating water policies to consider significant feedback from the human system to natural resource use (Biswas 2008). Indeed, a global approach is required to design effective and efficient sustainability policies.
Figure 6. Global production (a) and land use (b) responses to imposing a US groundwater sustainability constraint in 2050.
Download figure:
Standard image High-resolution image
Table 2 depicts the impacts on the world and the US. It is projected that this local groundwater sustainability policy may lead to a 0.1% increase in global cropland area (20 million hectare) and a 0.3% increase in fertilizer application worldwide. In the US, the irrigated area declines by 2.96% leading to a 16.5% reduction in irrigated production (787.9 million tons corn-equivalent). The responses within the US are estimated to increase rainfed area (extensive margins) and fertilizer application in the rainfed areas (intensive margins). This is mainly due to a 9.4% increase in local crop prices that will motivate other farmers to increase their production and new farmers to enter the market.
Table 2. Projected percentage changes in cropland area, water withdrawal, and yields.
| World | US | |||||
|---|---|---|---|---|---|---|
| Irrigated | Rainfed | Total | Irrigated | Rainfed | Total | |
| % | ||||||
| Crop production (%) | −1.03 | 0.61 | −0.07 | −16.45 | 5.36 | −2.96 |
| Cropland area (%) | −0.31 | 0.24 | 0.11 | −4.14 | 1.14 | 0.17 |
| Surface water withdrawal (%) | — | — | 1.33 | — | — | 4.10 |
| Groundwater withdrawal (%) | −9.25 | — | −9.25 | −61.73 | — | −61.73 |
| Fertilizer application (%) | −0.31 | 0.39 | 0.25 | −10.78 | 4.49 | 1.45 |
| Δ | ||||||
| Crop production (m ton) | −461.0 | 394.4 | −66.7 | −787.9 | 430.5 | −357.4 |
| Cropland area (m ha) | −9.8 | 29.5 | 19.7 | −11.6 | 14.6 | 3.0 |
4. Discussion
There have been several attempts to project future water withdrawals based on gridded models (Herbert and Döll 2019), county-level analysis (Roy et al 2012), Hydrologic Unit Codes (Brown et al 2019), or at the global scale (Boretti and Rosa 2019). However, most of the current studies have ignored the role of technological progress (in terms of TFP). We show that productivity improvements in crop production, livestock sector, and processed food activities can offset the pressure on water resources over the coming decades. However, investments in R&D (research and development) are required to achieve the suggested productivity improvements (Baldos and Hertel 2018, Baldos et al 2019). The continued improvement in productivity, which follows investments in R&D over the past, is essential to avoid increasing stress on water resources. Although the improvement in irrigation efficiency is expected to increase water use (Perry et al 2017, Grafton and Wheeler 2018, Perry 2018), growth in productivity is able to reduce the stress on water resources by offsetting the demand pressures. Given the uncertainty in TFP calculations, future studies should explore the consequences of alternative R&D and TFP trajectories (Fuglie et al 2022).
Over the last few decades, the policy discussion around groundwater sustainability has evolved from a legal and economic definition of safe yield, i.e. the amount of water that can be withdrawn before it is no longer economically feasible, to a more socially and environmentally based definition of sustainability used that can provide a long term balance between withdrawals and impacts (Alley et al 1999, Alley and Leake 2004). Even a withdrawal amount that is replenished each year can lead to a decrease in natural discharge and cause harm to ecosystems that rely on groundwater contributions, so in many locations, this sustainable yield is substantially less than the natural recharge rate (Sophocleous 2000). The sustainability scenario undertaken here, therefore, provides a conservative estimate of the economic impacts of a sustainable groundwater policy. In some cases, restricting groundwater withdrawals to estimated annual rates of recharge allows for extraction far above sustainable yield.
Aeschbach-Hertig and Gleeson (2012) and Piemontese et al (2020) call for a more comprehensive socioeconomic strategy and more attention to the significance of local population and equity in sustainability studies. This study contributes to the growing body of evidence on the importance of GLG approach for sustainable agriculture (Hertel et al 2019, Haqiqi et al 2022, Ray et al 2023). While global costs of sustainability might be small due to economic responses and reallocation of resources, the local benefits of sustainability and local costs of ignoring it are significant.
Gleeson et al (2012) argue that groundwater sustainability is a values-driven process involving social, economic, and environmental factors that cannot be defined in terms of a given withdrawal target and that sustainability planning for groundwater must utilize a long-time horizon (50–100 years), involve local, adaptive input and utilize models capable of backcasting from desired outcomes to policy options that can support them. This work provides utilizes a publicly-available, multiscale modeling tool (SIMPLE-G) that can be incorporated into regional community planning efforts to examine the socio-economic impacts of various management strategies, over long-time horizons. However, we would argue that, in addition to a local, physically-based analysis to inform policy options, given linkages to the global food system, community-level planning for groundwater sustainability options must also include a broader perspective, considering the role of global economic drivers.
Another benefit of the multi-scale modeling framework is the capability to capture the interactions of different countries' policies and their local impacts. Disaggregating production in the US while keeping other regions un-gridded in the background permits us to consider the market responses by US trade partners, even as we explore in detail US domestic policies. These global market developments are potentially important when they are implemented by major trade partners and food-producing countries. One outstanding example is China which has been aggressively pursuing national policies to achieve sustainable agricultural development during the past decade. The National Sustainable Agricultural Development Plan (2015–2030) that was released in 2015, continues to emphasize the contribution of agricultural science and technology (more than 60% to total output growth), cropland protection (no less than 120 million ha of cropland), and efficient irrigation (capped national irrigation water use at 700 billion m3 by 2030 and an irrigation efficiency index not lower than 0.60). It is important to be able to factor such major developments into the analysis of US agriculture and sustainability policies at the national and local levels.
5. Conclusion
With limited technological progress, increasing stresses on water and land resources are projected to emerge because of anticipated growth in demand for food. Specifically, groundwater withdrawals in some locations are expected to increase by more than 50%. The underlying drivers of these stresses are global in nature, with demand growth in South Asia and China alone accounting for roughly one-quarter of US irrigated cropland expansion. However, strong productivity growth can offset the pressure from global changes in population and growth. Unfortunately, groundwater pumping for irrigation and other uses now exceeds annual recharge rates by more than ten times in parts of the Central Valley of California, the High Plains Aquifer, and the Snake River Basin of the United States. This figure is expected to further deteriorate in the absence of regulation.
We find that local water policies can have unanticipated spillover effects, thereby exacerbating water stresses in other parts of the world. Furthermore, any attempt to restrict water for irrigation will result in the reallocation of cropping activity to other parts of the world, as well as to other regions of the country. Given the increase in water and land use in other parts of the world under the US sustainability policy (around 20 million hectares), the global net environmental benefit of such a policy may be negligible or even negative due to spillover effects. Cropland expansions in other parts of the world can cause more biodiversity loss, deforestation, and water pollution. Dealing with this sustainability challenge will require global coordination of resource governance as well as institutional reforms. The GLG framework here offers a practical means for analyzing the consequences of such policy proposals as they emerge.
Acknowledgments
The authors acknowledge support from the National Science Foundation HDR award # 2118329: "NSF Institute for Geospatial Understanding through an Integrative Discovery Environment (I-GUIDE); the United States Department of Energy, Office of Science, Biological and Environmental Research Program, Earth and Environmental Systems Modelling, MultiSector Dynamics Contract DE-SC0016162 and DE-SC0022141; the United States Department of Agriculture AFRI Grant #2019-67023-29679: 'Economic Foundations of Long Run Agricultural Sustainability'; and the National Science Foundation INFEWS award #1855937: 'Identifying Sustainability Solutions through Global-Local-Global Analysis of a Coupled Water-Agriculture-Bioenergy System'.
Data availability statement
The SIMPLE-G-US model codes (v1.1)are available on myGeoHub (Woo et al 2020).
All data that support the findings of this study are included within the article (and any supplementary files).
Supplementary data (4.9 MB PDF) The supplementary information provides a detailed technical description of the SIMPLE-G-US model, dataset, and validation.