


Abstract
Global climate changes give us the important task of obtaining information about the spatial distribution of bioclimatic comfort indicators at the global or continental level. One of the most applicable tools can be based on reanalysis data (meteorological gridded data with global coverage). This issue is fully relevant for the territory of Northern Eurasia with its diverse climates, rapid environmental changes, and often sparse network of in situ observations. In this paper, we present a conceptually new dataset for the most popular thermal comfort indices, namely heat index (HI), humidex (HUM), wind chill temperature, mean radiant temperature, physiologically equivalent temperature (PET) and Universal Thermal Comfort Index (UTCI) derived from ERA-Interim reanalysis hourly data for the territory of Northern Eurasia (the area limited by 40° N–80° N, 10° W–170° W). The dataset has horizontal resolution of 0.75° × 0.75° (up to 79 km), temporal resolution of 3 h, and covers the period from 1979 to 2018 (40 years), which corresponds to the standard of the World Meteorological Organization in determining the parameters of the modern climate. Time series of indices are supplemented with a set of 8092 pre-calculated statistical parameters characterizing climatology of the thermal stress conditions. We further present several examples of the North Eurasian Thermal Comfort Indices Dataset (NETCID) data application, including analysis of the spatial heterogeneity of thermal stress conditions, assessment of their changes and analysis of specific extreme events. Presented examples demonstrate a pronounced difference between considered indices and highlight the need of their accurate selection for applied tasks. In particular, for the whole study areas HI and HUM indices show much smaller thermal stress repeatability and weaker trends of its changes in comparison to PET and UTCI indices. NETCID is available for free download at https://doi.org/10.6084/m9.figshare.12629861.
Export citation and abstract BibTeX RIS

Original content from this work may be used under the terms of the Creative Commons Attribution 4.0 license. Any further distribution of this work must maintain attribution to the author(s) and the title of the work, journal citation and DOI.
1. Introduction
The assessment of human perception of the thermal environment is becoming highly relevant in the context of global climate change and increasing intensity of the impact of weather conditions on public health. This issue goes beyond the scope of biometeorology as a science and becomes a key component in a forecast system nowadays. The 'quiet revolution' in the past 10 years in weather forecasts (Bauer et al 2015) has led to the technological introduction and assimilation of a large amount of new data (Anderson et al 2021). Thanks to the development of such efforts, in the near future an additional improvement is expected in the quality of forecasting dangerous adverse weather conditions, primarily abnormal heat (cold), heavy rainfall (rain and snow) and gusts of wind (Johny and Prasad 2018, Lecha Estela 2018, Luitel et al 2018, Sahoo et al 2019, Yin et al 2019) One of the important activities of weather services is also warning the population about a possible health hazard under the influence of weather conditions that can be based on thermal comfort (bioclimatic) indices. However, the use of these indices is still limited in national forecasts and very few countries, such as Germany, Greece, USA, and Canada, apply bioclimatic indices in weather alerts (Giannaros et al 2018, Casanueva et al 2019).
Thermal comfort assessment is an important task in developing of strategic mitigations and adaptations plans to climate change. However, the specific of a thermal environment is mostly based on air temperature or land surface temperature (Dong et al 2020). A human perception of the thermal environment is often neglected in strategic documents due to the need to calculate bioclimatic indices. Nevertheless, an examples of Yangtze River Delta urban agglomeration (Wang et al 2020), Wuhan (Dong et al 2020), Moscow (Zemtsov et al 2020), as well as northern regions (Konstantinov et al 2020, 2021), and other areas (Bleta et al 2014, Ahmadi and Ahmadi 2017, Basarin et al 2018, Geletič et al 2018) showed that bioclimatic indices can be used as tools for spatial thermal stress zoning at various territorial levels. The results of these studies can be highly important in order to protect socially vulnerable population.
A number of works indicate that an increase in the frequency and duration of heat or cold waves negatively affects public health, and some events—Chicago heat wave in 1995 (Dematte et al 1998) European heat wave in 2003 (Muthers et al 2010) Russian heat wave in 2010 (Shaposhnikov et al 2014) have become the drivers of the development of modern studies in environmental epidemiology concerning temperature-related mortality and morbidity (Gronlund et al 2018, Son et al 2019). However, the air temperature remains one of the main indicators for heat-related mortality assessment (Dimitrova et al 2021, Zafeiratou et al 2021) that in some cases might be associated with the complexity of calculating indices.
New challenges require a development of new datasets that contains not only various meteorological parameters but also specific bioclimatic indices. Some other regional studies was performed in Greece (Kamoutsis et al 2013) as well as outdoor thermal comfort surveys data (Chen et al 2022). Some efforts are expressed in creating a non-profit website considering local and global threats to human health and society from climate change (see for example Climate CHIP project www.climatechip.org/).
The rapid development of atmospheric reanalysises (Parker 2016), that are the product of model assimilation of a large number of diverse observations, allows the creation of thermal comfort datasets at global scale with a high spatial resolution (Yan et al 2021). Reanalysis data has already served as source meteorological data for several regional bioclimatic assessments (Jacobs et al 2013, Di Napoli et al 2018, Giannaros et al 2018, Varentsov et al 2020) as well as for developing open-access datasets. The first global gridded dataset of Universal Thermal Climate Index (UTCI) based on ERA-5 reanalysis with 0.25° resolution (Hersbach et al 2020) appeared in 2020 (Di Napoli et al 2021). The suitability of ERA5-HEAT dataset in comparison with station-based air temperature for health-related studies was demonstrated in 21 cities across 9 European countries (Urban et al 2021). Recent regional dataset of human thermal stress indices for Southern and Easter includes UTCI and several simpler indices derived based on ERA5-Land reanalysis data with 0.1° resolution (Yan et al 2021).
It should be especially noted that all the above described databases (based on ERA5) do not contain output fields with the physiologically equivalent temperature (PET) index (Höppe 1999), due to the exceptional resource intensity of calculations. And meanwhile, it is one of the best predictors of the risk of mortality during hot events (Shartova et al 2018).
Northern Eurasia, with its diverse climatic conditions and significant environmental problems, experiences lack of thermal comfort studies and open-access data on human thermal comfort indices. This large region extends form Russian Arctic where the highest rates of climate warming are observed (Shevnina et al 2017, Hjort et al 2018, Khlebnikova et al 2018, Zolotokrylin et al 2018, Marshall 2021) to China with its dense population and serios environmental problems (Ma et al 2017, Tvinnereim et al 2017, Cao et al 2018, Yang et al 2018, Yue et al 2019) and EU countries where governments are especially concerned about climate change adaptation (Nash and Steurer 2019). Hence, creation of thermal comfort dataset specifically for the Northern Eurasia would cover the diverse needs of researchers, legislative authorities and private business, extremely heterogeneous in the manner of decision-making. Thus, this study aimed the creation of gridded dataset for Northern Eurasia Thermal Comfort Indices Dataset (NETCID) adopting various thermal comfort indices that could be useful to a wide circle of specialists, including ecologists, epidemiologists, physicians, etc (figure 1).
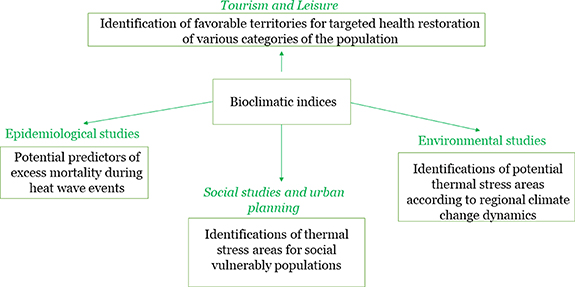
Figure 1. Examples of human thermal comfort assessment in environmental, epidemiological and social studies.
Download figure:
Standard image High-resolution imageIn contrast to other existing thermal comfort data sets which are based on ERA5 reanalysis data, we selected older ERA-Interim reanalysis (Dee et al 2011) for NETCID development. ERA-Interim with its grid step of 0.75° is less detailed than ERA5, and its production unfortunately finished in 2019. Nevertheless, ERA-Interim was probably the most popular data set in atmospheric research until the ERA5 was released. Moreover, ERA-Interim dataset has been extensively validated for Northern Eurasia. For example, ERA-Interim provides the best verification results for wind speed, near-surface temperature, and radiative fluxes in comparison to six other global reanalysis products (ERA5 was not included), as is shown in a detailed evaluation study (Lindsay et al 2014). At the same time for Arctic region detailed ERA5 forcing data did not demonstrate any clear advantage over the ERA-Interim data in the paired experiments, at least for the temperature and wind speed (Platonov and Varentsov 2021). Another reason for using ERA-Interim data is associated with significant computational demands needed for data processing. Processing of ERA5 data with its higher spatial (0.25°) and temporal (1 h) resolutions require 27 times more computations than for ERA-Interim data. Such difference is not critical for simple indices and even for calculation of the UTCI which could be efficiently calculated from gridded data sets. However, it dramatic for calculation the PET, which could be derived only using convenient RayMan software (Matzarakis et al 2010). Migration to ERA5 is planned for the next NETCID release that should be in line with appearance of new studies confirming the reliability of ERA5 reanalysis for different parts of Northern Eurasia.
The NETCID covers the territories of Europe and Asia north of 40° N from 1979 to 2018.
2. Data source and methods
Although the discussion about the best indices continues, their choice depends largely on the purpose of use and study area (Staiger et al 2019). A detailed overview of the more than 100 indices could be find in the studies (Epstein and Moran 2006, de Freitas and Grigorieva 2015, 2017, Potchter et al 2018). The NETCID dataset includes five most popular thermal comfort indices, namely heat index (HI), humidex (HUM) and wind chill temperature (WCT), Physiological Equivalent Temperature (PET) and Universal Thermal Climate Index (UTCI), the features of which are summarized in supplementary table S1. The HI, HUM and WCT indices belong to a group of so-called simple indices, which are based on empirical relationships on meteorological parameters, and they are implemented in National Weather Services in USA (HI) and Canada (HUM, WCT). PET and UTCI indices are based on human energy balance models provide a more comprehensive and accurate representation of human thermal perception (Matzarakis et al 1999, Blazejczyk et al 2012). Despite the limitations concerning the validation of energy balance models (de Freitas and Grigorieva 2017) and uncertainties of gradation threshold values in various climates (Chen and Matzarakis 2018, Binarti et al 2020)), PET and UTCI remain the most useful thermal comfort indices.
We developed NETCID dataset based on meteorological data from ERA-Interim reanalysis (Dee et al 2011) produced by European Center for Medium-Range Weather Forecasts (ECMFW) and accessed from the ECMWF data portal (https://apps.ecmwf.int/datasets/data/interim-full-daily/levtype=sfc/). The spatial resolution of the ERA-Interim reanalysis data is 0.75° latitude × 0.75° longitude; the temporal resolution is 3 h. The data processing was performed for territory limited by 10° E–170° W, 40–80° N and for the time period from 1 January 1979 to 31 December 2018 (40 years).
Calculation of the most advanced thermal comfort indices, PET and UTCI, was performed using RayMan software (Matzarakis et al 2010) which is a widely accepted tool in state-of-the-art biometeorological studies. Unfortunately, this software does not support processing of the gridded data sets. This problem was solved with the help of the developed data processing chain, which included several format conversions (NetCDF to text tables and vice versa) and parallel computations with RayMan. Simple indices (HI, HUM and WCT) were calculated in Matlab and further saved to same NetCDF files. The description of data processing chain is presented in supplementary S2.
To illustrate possible applications of NETCDI data, we present several types of data analysis, focused on climatological means of thermal comfort indices, repeatability of different grades of thermal stress as well as trends of all these parameters. Repeatability of thermal stress grades was calculated using ranges of indices compiled from (Masterton and Richardson 1979, Steadman 1979, Matzarakis et al 1999, Blazejczyk et al 2012), see supplementary table S2 for details. When analyzing trends, the Sen's slope estimator was used to evaluate the rates of changes, and Mann-Kendall nonparametric statistical test was used to evaluate the significance level of the trends (Helsel and Hirsch 1992). These statistical metrics can be applied even if the time series do not conform to a normal distribution (Helsel and Hirsch 1992, Meals et al 2011). Therefore, they have been widely used in recent climate studies, see e.g. a detailed in (Kocsis et al 2017).
3. Results
3.1. NETCID dataset description
Developed NETCID is shared for scientific applications using Figshare repository (https://doi.org/10.6084/m9.figshare.12629861). Whole dataset is presented in NetCDF format and is spitted into 40 files, each of which corresponds to an area of 20 × 20 latitude/longitude degrees, allowing to download only the data for specific region. Each file contains five biometeorological indices (PET, UTCI, HI, HUM, WCT variables) and source meteorological parameters used for their calculation, namely 2 m temperature (t2m), 2 m relative humidity (rh2m), surface temperature (skt), total cloud cover (tcc) and 10 m wind speed (vel10). Additionally, NETCID data contains mean radiant temperature (MRT) which is an intermediate variable in PET and UTCI calculation. All listed variables are presented as 3D fields with dimensions of longitude, latitude, and time for the whole period of 1979–2018, i.e. there are 116 881 individual time steps corresponding to 3-hourly intervals. Data could be easily opened in NetCDF viewers such as Panoply (www.giss.nasa.gov/tools/panoply/) and further processed in any programming language that supports NetCDF format.
In addition, to simplify further climatological studies based on presented dataset, a set of statistical parameters was calculated based on the data and shared together with data set. These parameters are presented as a hierarchical Matlab data structure (*.mat format), that include in total 26 700 different parameters, including the mean values of the indices as well as repeatability of different thermal stress grades (see supplementary table S2).
Hierarchy of the data structure containing statistical parameters is presented in figure 2. The first structure level separates the parameters based on input data discreteness. There are parameters derived from data with original 3-hourly time step (hourly structure field) and several types of data with daily discreteness, including daily mean, minimum and maximum values (dmean, dmax and dmin fields), and additional hierarchy branch that include repeatability of simultaneous fulfillment of the given condition for daily maximum and minimum values (dminmax field). Each of these fields is further structured according to index and period (month or season). Statistical parameters are calculated for the whole year (all field), for each of 12 months and for each of 4 seasons of the year. For example, data.hourly.PET.JJA field contains statistical parameters based on hourly PET index values for summer (June–August), including the mean PET value, 1st and 99th percentiles, and strict and non-strict repeatability of the thermal stress grades. Strict repeatability includes the thermal stress only within the specific grade, and non-strict repeatability accounts also for the thermal stress higher than the given grade (e.g. non-strict repeatability of moderate heat stress include all other heat stress grades from high to extreme). Mean values and percentiles are not available where they are senseless, i.e. for HI, HUM and WCT indices, but are presented for basic meteorological parameters (t2m, rh2m, skt, tcc, vel10). In total, statistical dataset contains 8092 different last-level parameters. All of them are merged within the whole study area. The first-level field info contains information about grid and land-sea mask. There are two versions of statistical data set. In the first one (clim_stats.mat), all parameters are calculated based on the whole study period (1979–2018), so last level variables are represented as 2D fields and represent long-term climatology of thermal comfort conditions. The second one (year_stat.mat) contains parameters calculated separately for individual years from 1979 to 2018, so the last-level variables are represented as 3D fields with 40 time steps. This allows user to simply average the data within the given years, calculate the trends, etc.

Figure 2. Hierarchy of the data structure in NETCID dataset.
Download figure:
Standard image High-resolution image3.2. Data visualization and potential application of NETCID dataset
The fundamental value of the NETCID dataset is the combination of the most reliable and valid thermal comfort indices for the study area. Potential areas of NETCID data application include analysis of the human life quality, investigation of tourism potential and socio-economic development in various regions. Moreover, NETCID data provides unique opportunity to analyses the trends of the thermal comfort condition over wide and geographically diverse area of Northern Eurasia, and to compare the observed changes in terms of different indices. Below we present examples of NETCID data application for estimating different parameters of thermal comfort conditions and their changes during the study period.
3.2.1. Thermal comfort during summer and winter
Considering the increasing interest for spatially-explicit assessments, the spatial characteristics of seasonal averages of thermal comfort indices are presented. We start our analysis with a comparison between PET and UTCI climatology with air temperature, which was the simplest and most understandable weather and climate parameter (figure 3). For HI, HUM and WCT, which are defined only for a limited range of meteorological conditions, comparison of mean values is senseless and hence is not presented.

Figure 3. Spatial distribution of mean temperature (a), (b), PET (c), (d) and UTCI (e), (f) for winter (December–February, DJF) and summer (June–August, JJA) seasons.
Download figure:
Standard image High-resolution imageDuring summer, the temperature gradient is directed from north to south, and the minimums are observed on the islands of the Arctic Ocean (in some places they do not exceed 0 °C). In winter, the gradient is directed meridionally, i.e. from west to east with increasing continentality. The coldest temperatures below −40 °C are observed in the center of Yakutia (Russia), in the region where the Pole of Cold is located (Stepanova 1958, Kobysheva 2001, Darack 2013) and maximums are observed at the coasts of the Atlantic Ocean and Mediterranean Sea. Mean PET and UTCI values for summer, and mean PET for winter follow generally the same pattern as air temperature, in contrast to mean winter UTCI. Its minimum of mean UTCI in winter does not coincide the temperature minimum and is shifted to the Arctic Ocean, where local extrema below −50 °C are found. Such a mismatch is explained by high sensitivity of the UTCI index to wind speed, and by strong and persistent wind at the Arctic coast in winter (Varentsov et al 2020).
3.2.2. Heat and cold stress repeatability
Spatial difference in repeatability of various thermal stress grades provides the basis for deeper analysis of thermal comfort changes and assessment of potential health risks. In this paper, we compare and analyze mean repeatability of days when bioclimatic indices reach given thresholds, i.e. the thermal stress repeatability based on daily maximum or minimum values of the indices. Such comparison provides a good overview of the difference between the indices, that was found during the analysis of heat and cold stress repeatability by NETCID dataset even over the scale of whole Northern Eurasia (table 1).
Table 1. Repeatability (in %) of days with different thermal stress grades in summer and winter seasons during 1979–2018 period: mean value ( ) and 99th percentile (
 ) calculated for all land grid cells within whole study area.
| Thermal stress grade | HI | HUM | PET | UTCI | WCT | |||||
|---|---|---|---|---|---|---|---|---|---|---|

|

|

|

|

|

|

|

|

|

| |
| Summer | ||||||||||
| Moderate heat stress | 6.1 | 60.1 | 6.5 | 59.3 | 29.4 | 92.9 | 17.7 | 80.4 | n/a | |
| High heat stress | 0.6 | 16.4 | 0.1 | 2.0 | 12.0 | 73.8 | 2.6 | 39.5 | ||
| Very high heat stress | 0.0 | 0.0 | 0.0 | 0.0 | 2.7 | 40.2 | 0.2 | 6.2 | ||
| Extreme heat stress | 0.0 | 0.0 | 0.0 | 0.0 | 0.3 | 10.3 | 0.0 | 0.0 | ||
| Moderate cold stress | n/a | 99.7 | 100 | 78.2 | 100 | 0.5 | 4.9 | |||
| High cold stress | 78.0 | 100 | 6.5 | 71.5 | 0.0 | 0.0 | ||||
| Winter | ||||||||||
| Moderate cold stress | n/a | 100 | 100 | 99.8 | 100 | 94.7 | 100 | |||
| High cold stress | 100 | 100 | 98.8 | 100 | 64.1 | 99.7 | ||||
| Very high cold stress | 100 | 100 | 85.7 | 100 | 35.1 | 88.8 | ||||
| Extreme cold stress | n/a | n/a | 48.6 | 97.4 | 5.0 | 27.5 | ||||
The cold stress NETCID data set can be evaluated according to WCT, UTCI and PET indices. Yet for the PET, the cold stress grades have not yet been methodologically developed for application in severe winter conditions (Grigorieva and Matzarakis 2011, Varentsov et al 2020)
Hence, for winter season we compare the cold stress repeatability only according WTC and UTCI. A dramatic difference between these indices is clearly visible. In general, WCT provides much lower repeatability of all cold stress grades in comparison to UTCI (table 1), and different spatial patterns of the areas affected by the risk of cold stress (figure 4). For example, UTCI demonstrates almost 100% repeatability of high cold stress in winter in almost the entire territory of Russia and Kazakhstan, most of the Scandinavian countries, as well as throughout Mongolia (figure 4(a)). In the same time, 100% repeatability of the same WCT grade is achieved only in the northern half of the Russian Republic of Yakutia (figure 4(b)). Such patterns clearly illustrate the inconsistency between thermal stress grads for different indices (WCT grades are stricter than for UTCI). For the extreme cold stress grade, WCT-based repeatability is 0% for more than 75% of the territory of Northern Eurasia (figure 4(c)), but UTCI-based repeatability is zero only for countries of Western Europe (figure 4(d)). UTCI-based repeatability of the wintertime extreme cold stress is close to 100% at the wide area at the coast of Laptev Sea.
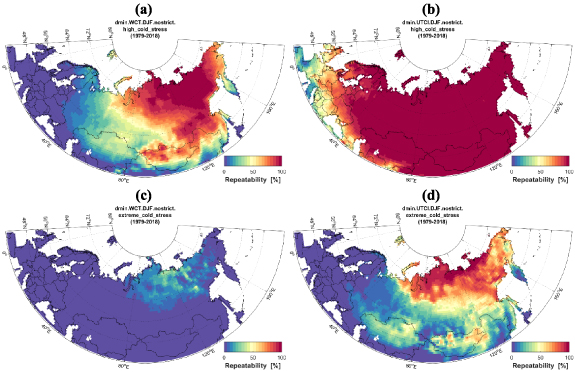
Figure 4. Repeatability of the days with different grades of the cold stress during winter according to WCT (a), (c) and UTCI (b), (d) indices.
Download figure:
Standard image High-resolution imageFor the summer season, NETCID dataset allows comparison between four indices, namely HI, HUM, PET and UTCI (figure 5). According to their physical basis, each index differs from the others, but there are also regions in which the indices demonstrate unanimity. For the Arctic coast and the northern coast of Scotland, none of the index shows the presence of days with moderate or stronger heat stress. Meanwhile on the south of Kazakhstan and in the countries of Central Asia, the moderate heat stress repeatability exceeds 80% according to all indexes. Also, all indices indicate impact of orography, e.g. a decrease of heat stress repeatability in the Ural Mountains, and the PET and UTCI indices reveal local minima associated with strong winds in the Lake Baikal region. Nevertheless, four indices differ strongly in terms area-mean thermal stress repeatability, with its lowest value of 6.1% found for HI, and highest value of 29.4% for PET (table 1). The most dramatic difference is observed between simple indices, HI and HUM, and more advanced PET and UTCI. The simple indices show high (more than 75%) repeatability of heat stress days only for Central Asia (Kazakhstan, Uzbekistan), and almost absence of such days for Fennoscandia and Russian Arctic and Siberia. Yet, PET and UTCI shows high repeatability of heat stress days also for Italy, Balkan countries and southern Russia, and extend the area with non-zero repeatability to British Islands, Scandinavia, Siberia and Yakutia. Such differences are not surprising, since the simple indices and their grades are defined for shadow conditions, and PET and UTCI represent the thermal sensation affected by solar radiation.
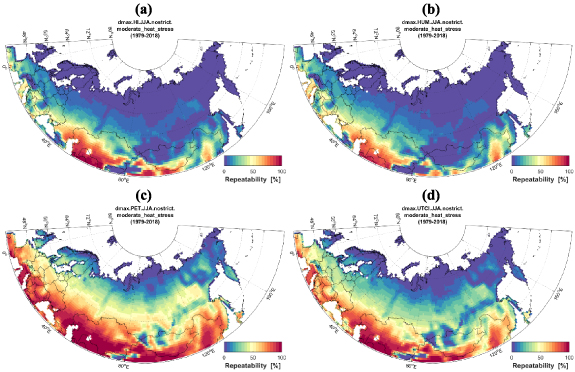
Figure 5. Repeatability of the days with moderate or stronger heat stress in summer according to HI (a), HUM (b), PET (c) and UTCI (d) indices.
Download figure:
Standard image High-resolution imageNETCID data allows comparing areas of Norther Eurasia not only in terms of heat or cold stress repeatability, but also, oppositely, in terms of repeatability of stress-free days, i.e. days without cold or heat stress. Stress-free days reportability can be analyzed based on UTCI index, which is most universal.
However, in winter repeatability of the days with moderate cold stress is 100% over whole study area, which makes wintertime stress-free days impossible for Northern-Eurasia. In summer, the repeatability stress-free days in Northern Eurasia does not exceed 30% (figure 6). In terms of stress-free days, and the most comfortable areas are the island of Hokkaido, the Crimean Peninsula, Italy, Turkey, and the coast of the Bay of Biscay in Europe, the south of Far East of Russia and North-Eastern China in Asia. Such regions are well known as areas with a pronounced maritime climate and with a well-known recreational potential.
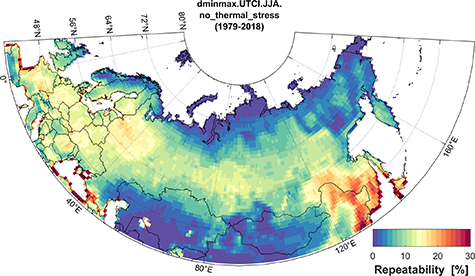
Figure 6. Repeatability of 'stress-free' days during summer according to UTCI.
Download figure:
Standard image High-resolution image3.2.3. Tracking main changes in thermal comfort
In addition to comparing different indices and different time periods, NETCID dataset allows to compare statistical parameters of the ongoing changes of the thermal comfort conditions, and to link them, as already mentioned, with the changes of meteorological parameters. Below we present several examples of the linear trend analysis thermal comfort parameters in Northern Eurasia based on NETCID dataset for the period of 1979–2018.
NETCID data clearly demonstrates that heterogeneity of the climate change rates in Northern Eurasia is also expressed in mean values PET and UTCI indices (figure 7). For both summer and winter seasons, the spatial patterns of PET and UTCI trends generally follow temperature trends, indicating the leading role of the temperature changes in the changes of the indices. In summer, the highest warming rates are found in Eastern Europe, Southern Siberia and Mongolia, while West Siberia and Northern Kazakhstan exhibit near-zero changes. In winter, the well-known rapid Arctic warming is accompanied by the near-zero changes in the wide areas of Siberia and in the Far East of Russia, and by even negative trends in the Southern Siberia and Mongolia. Despite the general similarity, reginal differences between dynamics of temperature and PET/UTCI indices still exist. For example, winter warming in north-western Russia is strongly expressed in terms of UTCI than in terms of temperature, while the rates of mean summer PET growth in south-western Russia exceed than the rates of the temperature growth. Such amplified rates of the UTCI and PET changes indicate the additional contribution from the long-term changes of other meteorological factors including wind speed and cloudiness (Varentsov et al 2020).
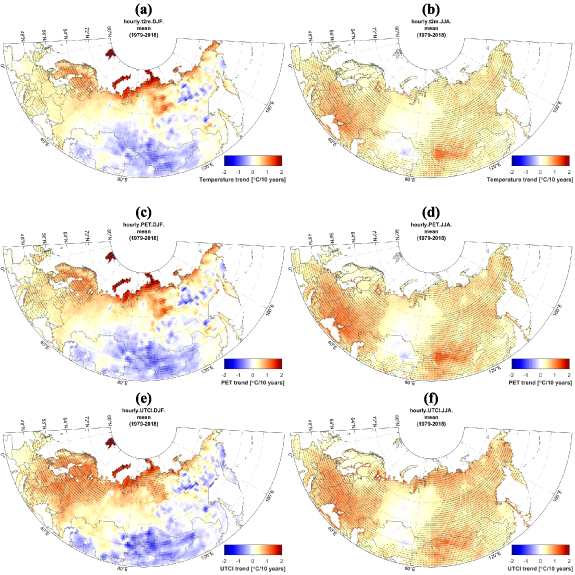
Figure 7. Spatial distribution of linear trend coefficients for mean temperature (a), (b), PET (c), (d) and UTCI (e), (f) for winter (a), (c), (e) and summer (d), (b), (f) seasons. Grid cells with significant trends are marked with black dots.
Download figure:
Standard image High-resolution imageSpatial heterogeneity and differences between bioclimatic indices are also expressed if we consider the trends of repeatability of different thermal stress grades. For example, comparison of the trends of repeatability of days with high or stronger heat stress for the warm period according to HI, HUM, PET and UTCI indices demonstrates different intensity and spatial patterns of the change rates (figure 8). There is almost complete absence of changes according to HUM index. This may be explained by the fact that high heat stress is already very rare according to HUM index (figure 5), so changes of its repeatability are also very small. On contrast, PET index represents the most pronounced changes. This can be explained by already high repeatability thermal stress according to PET index (figure 5) and its high sensitivity to solar radiation and hence to observed changes of summer cloudiness (see more detailed discussion in Varentsov et al 2020). The rest indices indicate generally consistent pattern with a hotspot of changes found in South-Eastern Europe including Ukraine, Russia and neighboring countries, where changing rates exceed 5% per decade.
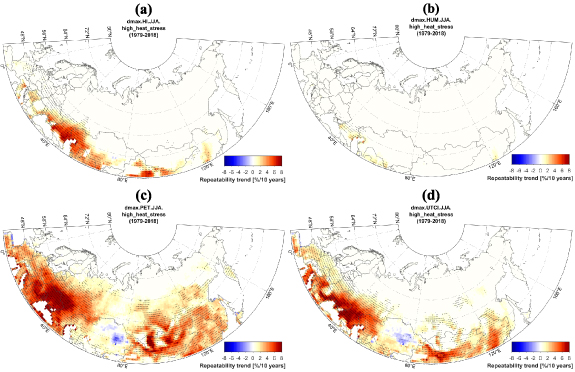
Figure 8. Linear trend coefficients for the repeatability of the days with high heat stress during summer according to HI (a), HUM (b), PET (c) and UTCI (d) indices. Significant cells are marked with black dots.
Download figure:
Standard image High-resolution imageThe most comprehensive example of thermal comfort trends analysis based on the NETCID data is the spatial heterogeneity of the trends for 'stress-free' days repeatability. As in section 'Heat and cold stress repeatability', we consider repeatability of 'stress-free' in summer. The positive dynamics with trend slope up to 2%–3%/10 years are observed in North-East of Russia (including Kamchatka and Yakutia) as well as in North-Western Europe, while negative trends are observed in southern Russia and north-east of China (figure 9).

Figure 9. Linear trend coefficients for the repeatability of the days without cold or heat stress during summer according to UTCI index.
Download figure:
Standard image High-resolution image3.2.4. Extreme heat events
NETCID data can be applied not only to study the long-term climatology of thermal comfort conditions, but to also provide the data for specific high-impact extreme events such as worldwide-known heat waves. Here, NETCID dataset could provide an opportunity for comparison of various extreme events in a common framework of thermal stress assessment. On the example of 2003, 2010 and 2018 we visualized and compared the anomaly of the high thermal stress repeatability against its long-term climatology to show, how each of these years was extreme at one point or another. Figure 10 present such anomalies based on PET. This index, as the most sensitive to extreme heat, clearly showed territorial differences in thermal stress.
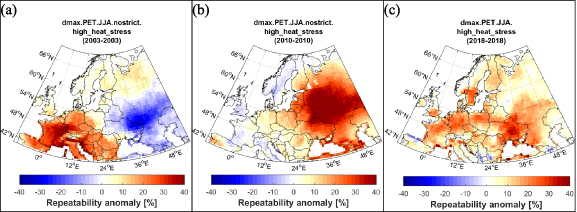
Figure 10. Anomaly of the repeatability of days with high or stronger heat stress in Europe according to PET index during summer 2003 (a), 2010 (b), 2018 (c), calculated with respect to the average value of high or stronger heat stress repeatability over period 1979–2018.
Download figure:
Standard image High-resolution image
In 2003 the most exposure was on the territory of France, north of Italy and Adriatic coast (figure 10(a)). This led to unprecedented 70 000 additional deaths in Europe (Robine et al 2008). The effect of heatwaves on mortality was observed and studied in many European countries (Conti et al 2005, Ly et al 2005, Díaz et al 2006), and France was the most affected (Filleul et al 2006) with 15 000 excess deaths (Fouillet et al 2006). Thus, the spatial distribution of thermal stress based on PET quite well indicated the most affected areas. The severity of heat stress in 2010 significantly exceeded 2003, including the spatial distribution (figure 10(b)). However, this heat wave was underestimated in terms of excess mortality. Reliable mortality estimates exist for the Moscow region only (Shaposhnikov et al 2014), while the strong thermal stress covered a significant area of the European part of Russia. Thermal stress during heat waves 2018 was least pronounced (figure 11(c)). However, local areas of thermal stress were found in southern Sweden and central part of Ukraine. The heat wave of 2018 caused the ecosystem impact due to the drought (Bastos et al 2020, Neuwirth et al 2021) and extreme long duration of the summer (Hoy et al 2020).
UTCI index marked less pronounced stress in Europe for 2003 and in Russia in 2010 in comparison to PET, and HI and HUM did not even clearly identify these heat waves (see supplementary S3 for details). None of indices except PET identified the heat wave for 2018. This is likely due thermal stress gradations for these indices are developed for another climatic conditions and hence are not sensitive to conditions which are considered as extreme for Europe. For example, indices designed to highlight hot and humid weather (e.g. Florida) may underestimate dry heat conditions in Europe and Russia. That is, in the future it makes sense to separately assess the ability of the indices to reproduce the super-extreme heat in individual countries.
4. Discussion and conclusions
In this study we presented a new dataset on the thermal comfort indices for Northern Eurasia (NETCID) derived from ERA-Interim reanalysis data. It includes five most popular thermal comfort indices, namely HI, HUM, WCT, PET and Universal Thermal Comfort Index (UTCI) with a horizontal resolution of 0.75° × 0.75° and a time resolution of 3 h for the 40 years (1979–2018) covering the area of Northern Eurasia.
The primary aim of dataset development and sharing is to provide a possibility to assess thermal stress for the territory of Northern Eurasia for climatic, environmental and social studies. A relatively wide selection of indices allows using that ones that are most suitable for a specific area of interest, both for physical reasons and for the established tradition. NETCID dataset has the following key advantages:
- possibility of choosing a thermal comfort index depending on the aim, season and study region.
- opportunity to comparison of different weather events in a common framework of thermal stress assessment.
- applicability for wide range of applied studies, including assessment of thermal-related consequences in health.
Additional advantage of NETCID dataset lies in the presence of a set of pre-calculated statistical parameters, illustrating the climatology of thermal comfort conditions of Norther Eurasia and their changes. In presented paper, we used these parameters to illustrate several examples of NETCID data application, including the comparison between different biometeorological indices and their trends in terms of the mean values as well as repeatability of different thermal stress grades. We revealed that considered indices differ dramatically in terms of thermal stress climatology and trends, as well as representation of specific extreme events. For summer, simple indices (HUM and HI) are much stricter than advanced UTCI and PET indices and represent much lower repeatability of heat stress as for specific heat waves as for climatological means. PET, being more sensitive to solar radiation and less to wind speed under hot conditions than UTCI, represents the highest repeatability of the days with strong heat stress. For winter, UTCI is much less strict than WCT and represents higher repeatability of cold stress. Overall, the UTCI was found to be slightly more sensitive to MRT, moderately more sensitive to humidity and much more sensitive to wind speed than the PET. This dynamic changed slightly depending on the environment and the season. In hot weather, the PET was found to be more sensitive to MRT and therefore reached high values that could potentially be hazardous more frequently than the UTCI and the HX. In turn, the UTCI's stronger sensitivity to wind speed makes it a superior index to identify potentially hazardous weather in winter compared to the PET and the WCT (Provençal et al 2016). Additionally, we introduced and analyzed an important parameter describing the repeatability of the stress-free days, which has not been systematically evaluated for Northern Eurasia prior to our study.
NETCID is a first publicly available data set that provides a long-term data on more than one thermal comfort index for Northern Eurasia. An only alternative to NETCID is a recently released ERA5-HEAT data set which include UTCI index derived from ERA5 reanalysis (Di Napoli et al 2021). ERA5-HEAT has several evident advantages against NETCID, firstly the global coverage, longer temporal coverage, higher spatial resolution of 0.25° of latitude/longitude, likely higher quality of sourced meteorological data, and on-fly updates. Nonetheless, a first-glance comparison between UTCI values according to NETCID and ERA5-HEAT shows good agreement for time series as well heat stress repeatability during heat waves (supplementary S4). Hence, and advantages of ERA-HEAT do not result in significant differences between data sets. Moreover, there are several advantages of NETCID over ERA5-HEAT, which could be considered as arguments for using NETCID or two data sets simultaneously:
- NETCID includes five different thermal comfort indices instead of only one, UTCI, in ERA5-HEAT. Three of these indices (HI, HUM, WCT) could be easily calculated from meteorological data including ERA5. However, their calculation on decadal timescale for so large area still require significant storage and time for data downloading and processing, while NETCID provides ready-to-use time series. More importantly, NETCID includes PET index. Presented examples illustrate than PET is more sensitive indicator of heat stress than other considered indices in terms of long-term thermal comfort climatology as well as specific heat waves (see figures 5, 10 and supplementary S3). Moreover, comparison between NETCID and ERA5-HEAT data for three European heat waves shows that PET index represents significantly higher heat stress repeatability that UTCI values derived both datasets (see supplementary S4). In contrast to simple indices and UTCI, PET could not be quickly calculated from gridded data sets, which highlights the relevance of ready-to-use PET time series already available in NETCID.
- Secondly, there are significant differences in approaches of UTCI index calculation. In NETCID, UTCI as well as PET is calculated using convenient RayMan software, which is computationally ineffective but is assumed as a 'gold standard' of long-term biometeorological studies (Matzarakis et al 2007, Fröhlich et al 2019). In ERA5-HEAT data, UTCI values are derived from reanalysis data based on authors' custom data processing tools based on open-access UTCI calculation code and custom MRT parameterizations (Di Napoli et al 2021). Such approaches are evidently more computationally effective that ours, and they allow incorporating likely more accurate radiative fluxes directly from reanalysis instead of their simple parameterization in RayMan. However, results of UTCI calculation in such approach are inconsistent with results, obtained with RayMan software, due to the different MRT parameterizations and other model options. Thus, we consider the consistency with other RayMan-based studies as advantage of NETCID.
- Finally, the presence of a large set of pre-calculated statistical parameters is available only in NETCID. It provides diverse ready-to-use data on thermal comfort climatology in Northern Eurasia, which could be used without any additional processing.
Anyway, the consolidation in one dataset of relatively simple empirical indices (HI, HUM, WCT) and those ones based on more advanced physiological models (PET, UTCI) allows to community to critically compare the indices with each other for different territories, which could be a progressive direction for international community of professionals. Creation of such new datasets is useful not only for practical use but may enlarge our knowledge about applicability of various indices for different climate zones.
Acknowledgment
This research was supported by the Ministry of Science and Higher Education of Russia (Contract 075-15-2021-574). The work of Mikhail Varentsov has been partially supported by Ministry of Education and Science of the Russian Federation as part of the program of the Moscow Center for Fundamental and Applied Mathematics under the Agreement No. 075-15-2022-284; the work of Pavel Konstantinov and Natalia Shartova has been partially supported by the Interdisciplinary Scientific and Educational School of M.V. Lomonosov Moscow State University «Future Planet and Global Environmental Change».
Data availability statement
The data that support the findings of this study are openly available at the following URL/DOI: https://doi.org/10.6084/m9.figshare.12629861.
Supplementary data (5.5 MB PDF)